Brillouin scattering in planar waveguides. II. Experiments
A. Chiasera, M. Montagna, E. Moser, F. Rossi, C. Tosello, M. Ferrari, L. Zampedri, S. Caponi, R. R. Gonçalves, S. Chaussedent, A. Monteil, D. Fioretto, G. Battaglin, F. Gonella, P. Mazzoldi, and G. C. Righini
Citation: Journal of Applied Physics 94, 4882 (2003); doi: 10.1063/1.1607520 View online: http://dx.doi.org/10.1063/1.1607520
View Table of Contents: http://scitation.aip.org/content/aip/journal/jap/94/8?ver=pdfcov Published by the AIP Publishing
Brillouin scattering in planar waveguides. II. Experiments
A. Chiasera, M. Montagna,a)E. Moser, F. Rossi, and C. Tosello
Dipartimento di Fisica, Universita` di Trento and INFM, via Sommarive 14, I-38050 Trento, Italy
M. Ferrari and L. Zampedri
CNR-IFN, Istituto di Fotonica e Nanotecnologie, via Sommarive 14, I-38050 Trento, Italy
S. Caponi
Dipartimento di Fisica, Universita` dell’Aquila and INFM, via Betoio Coppito, I-67100 L’Aquila, Italy
R. R. Gonc¸alves
Istituto de Quimica-UNESP, P.O. Box 355, 14801-970-Araraquara, SP, Brazil
S. Chaussedent and A. Monteil
Laboratoire POMA, Unite´ Mixte de Recherche associe´e au CNRS 6136, Universite´ d’Angers, 2 boulevard Lavoisier, 49045 Angers, France
D. Fioretto
Dipartimento di Fisica, Universita` di Perugia and INFM, via Pascoli, I-06123 Perugia, Italy
G. Battaglin and F. Gonella
Dipartimento di Chimica Fisica, Universita` di Venezia and INFM, Dorsoduro 2137, I-30123 Venezia, Italy
P. Mazzoldi
Dipartimento di Fisica, Universita` di Padova and INFM, via Marzolo 8, I-35131 Padova, Italy
G. C. Righini
CNR-IFAC Institute of Applied Physics ‘‘Nello Carrara,’’ via Panciatichi 64, I-50127 Firenze, Italy
~Received 6 February 2003; accepted 17 July 2003!
Silica–titania planar waveguides of different thicknesses and compositions have been produced by radio-frequency sputtering and dip coating on silica substrates. Waveguides were also produced by silver exchange on a soda-lime silicate glass substrate. Brillouin scattering of the samples has been studied by coupling the exciting laser beam with a prism to different transverse-electric~TE!modes of the waveguides, and collecting the scattered light from the front surface. In multimode waveguides, the spectra depend on the mmode of excitation. For waveguides with a step index profile, two main peaks due to longitudinal phonons are present, apart from the case of the TE0
excitation, where a single peak is observed. The energy separation between the two peaks increases with the mode index. In graded-index waveguides, m21 peaks of comparable intensities are observed. The spectra are reproduced very well by a model which considers the space distribution of the exciting field in the mode, a simple space dependence of the elasto-optic coefficients, through the value of the refraction index, and neglects the refraction of phonons. A single-fit parameter, i.e., the longitudinal sound velocity, is used to calculate as many spectra as is the number of modes in the waveguide. © 2003 American Institute of Physics. @DOI: 10.1063/1.1607520#
I. INTRODUCTION
Brillouin scattering, by excitation with visible light, is a powerful nondestructive technique for the measure of the sound velocity in bulk transparent glasses.1Surface Brillouin scattering is extensively used in strongly absorbing materials or in thin films which cannot propagate the light.2–5 In this case, surface phonons, propagating along the plane and ex-ponentially decaying along the direction perpendicular to the surface, are active in the inelastic scattering. In planar waveguides, Brillouin scattering by bulk phonons can be measured by coupling the exciting laser line to a transverse-electric~TE!or transverse-magnetic~TM!mode of the guide by a prism.6 –11 The shape of the Brillouin spectra ~BS! is
mode dependent: Two main peaks are produced by the lon-gitudinal phonons and two by the transverse phonons, apart from the case of the TE0excitation, which produces a single
peak.11 This is because Brillouin scattering depends on the scattering angle and the light propagates in the waveguide at different angles for different modes, with a zig-zag path in a ray-tracing approach. A model for the calculation of the BS in a waveguide, valid for any refractive index profile, has been proposed in Ref. 12. This model makes provision for a rich phenomenology of line shapes in the case of graded-index waveguides.
The main aim of this article is to test this model on some waveguides of different thicknesses and compositions, ho-mogeneous or graded-index, produced by rf sputtering, sol gel, and ion mixing. The waveguides were characterized by scanning electron microscopy ~SEM!, Rutherford back-a!Electronic mail: [email protected]
4882
scattering ~RBS!, m-line technique, loss measurements, and Raman scattering. It is shown that a fit of the BS with the model of Ref. 12 allows the sound velocity of the waveguide to be measured with a good accuracy. This is an important characterization of a waveguide, as a preliminary step to op-timizing the fabrication process in view of integrated optics applications.13–15In fact, the measure of the sound velocity, together with that of the refractive index, can give informa-tion on possible porosity or nonstoichiometry of the wave-guide. For instance, a residual small porosity, frequently present in sol–gel produced glasses, may strongly affect the sound velocity,16,17 more than the refractive index. This is due to the fact that the mismatch of the refractive index is lower than that of the elastic constant, since the light propa-gates in the pores volume, whereas the acoustic waves can-not.
II. EXPERIMENT
A. Sample preparation
Silica–titania films were deposited by a rf sputtering technique, described in Ref. 18. Two samples, a silica slice (25370 mm2) and a silicon slice, were coupled on the
sample holder: The films deposited on silicon were used for performing SEM and RBS measurements. The as-prepared films on the silica substrate did not propagate the light be-cause of nonstoichiometric structure of SiOx withx,2, and thermal annealing in air for 6 h at 600 °C was necessary to achieve light propagation. The axis of circular symmetry of the sputtering apparatus was at the middle point of the long side border between the silica and silicon substrates. Due to the geometry of the plasma generated by circular magnetron, the thickness of the deposited films decreases from the axis toward the borders of the sample holder. This effect is evi-denced by the appearance of circular interference fringes on the films. For instance, the thickness of sample RFSW1, measured by a m-line technique, decreases from about 2.8 mm to 2.65mm going from near one border side of the slice to the other one, along a 15 mm length.
The sample RFSW1, used for photonics applications, was activated with 1 mol % Er.18,19The sample RFSW2 was produced with a higher erbium content. Due to an inhomo-geneous concentration of erbium caused by a progressive increase of the sputtering efficiency of the erbium wire, which was initially oxidized, a graded-index waveguide was produced. This effect was negligible for the RFSW1 wave-guide, having a lower erbium content.
Silica–titania sol–gel samples were deposited by a dip-coating technique, described in Ref. 20. The graded-index SiO2– TiO2planar waveguide~SGW1!was obtained by
sub-sequently depositing 35 layers of 8% TiO2– 92% SiO2
com-position, 25 layers of 16% TiO2– 84% SiO2, and finally 23
layers of 24% TiO2– 76% SiO2composition, on a silica
sub-strate (7032531 mm3). In parallel, three single-layered planar waveguides~R1, R2, and R3!were also produced, for reference, with the same composition and experimental pro-cedure. After each dip, the films were annealed in air at 900 °C for 30 s. After every ten dipping cycles, the films were heat treated at 900 °C for 2 min. Finally, the
waveguides were submitted to a further heat treatment at 1000 °C with a heating rate from 600 to 1000 °C of 20 °C/ min.
Waveguides were also produced by silver exchange on a soda-lime silicate glass substrate. Samples were obtained by melting, at 1400 °C, the base oxides with different weight concentrations; the glass used for the fabrication of the IEW1 waveguide had the composition 68.8 SiO2– 2.0 Al2O3– 1.0
P2O5– 14.8 Na2O– 1.0 K2O– 9.4 CaO–3.0 Er2O3. The
glasses were cut in 3532531 mm3 plates. The planar waveguides were obtained by immersing the plates for dif-ferent times, of the order of 1 h, in a molten salt containing 0.5 AgNO3 and 99.5 NaNO3 mol % at 325 °C, in order to
produce waveguides of different thicknesses.
B. Sample characterization
SEM was used to analyze the morphology of both the substrates and the waveguiding films. The surface of the films was analyzed by a JEOL-JSM 6300 apparatus at 15 kV by covering the films with a 20 nm gold layer. Energy dis-persive spectrometry ~EDS! was performed in order to achieve a compositional analysis, by using a Noran Instru-ments mod. Voyager apparatus. In order to obtain more ac-curate values for the concentration of the different atomic species, some samples were analyzed by RBS. RBS analyses were performed at INFN National Labs of Legnaro~Padova! using a 2.2 MeV 4He1 beam at normal incidence; scattered particles were detected at an angle of 160°.
The refractive index and the thickness of the waveguides were measured for both TE and TM polarization by an
m-line apparatus ~Metricon mod. 2010! based on the prism coupling technique. We used a gadolinium gallium garnet prism with a refractive index 1.9644 at 632.8 nm. The appa-ratus was equipped with a Si detector to collect the visible light. Two He–Ne lasers, operating at 632.8 and 543.5 nm, were employed. The resolution in the determination of the angles synchronous to the propagation modes was 0.0075°.
In order to measure propagation losses, the light inten-sity scattered out of the waveguide plane, which is propor-tional to the guided intensity, was recorded by a video cam-era. The losses were evaluated by fitting the intensity to an exponential decay function, assuming a homogeneous distri-bution of the scattering centers in the film.21 The measure-ments were performed by exciting the transverse electric TE0
mode of the waveguide with a He–Ne laser operating at 632.8 nm.
C. Brillouin scattering
BS spectra were measured by using an Ar1 laser, oper-ating at a power of about 250 mW on a single mode of the 514.5 nm line, coupled to a TEm mode of the waveguide by a prism. The scattered light was collected from the front surface in a direction nearly perpendicular to the planar waveguide. A He–Ne laser, coaxial with the detection axis allowed the actual orientation of the waveguide to be mea-sured, because the orientation changed with the mode index
m. A SOPRA double monochromator with gratings operating at the 11th order was employed. This slits were placed in
4883 J. Appl. Phys., Vol. 94, No. 8, 15 October 2003 Chiaseraet al.
order to have a typical frequency resolution of 0.03–0.06 cm21
. Some BS were measured by means of a Sandercock-type (313)-pass tandem Fabry–Perot interferometer char-acterized by a finesse approximately 100 and a contrast ratio greater than 531010.3 A single-mode diode pumped solid-state laser operating at 532 nm was used with a power of about 250 mW. The instrumental resolution function was es-timated by the half width at half maximum of the elastic peak and it proved to be around 0.013 cm21.
The low resolution of the Sopra apparatus was sufficient, except for the case of the spectra of the RFS2 waveguide. In this case, the use of the higher-resolution Fabry–Perot appa-ratus was really crucial to detect the structured BS.
III. RESULTS AND DISCUSSION
A. Homogeneous waveguides
The refractive index profile of the RFSW1 planar wave-guide, reconstructed from the effective indices at 543.5 nm by an inverse Wentzel–Kramer–Brillouin ~WKB!method,22 is similar for TE and TM polarizations, indicating that the birefringence in this waveguide is negligible. The refractive index along the thickness is sufficiently uniform, indicating a good homogeneity of the film. In fact, the six effective indi-ces, for the three TE and three TM modes, are reproduced within a Dn,0.001 by a single-step profile withng51.493 and thicknesst52.8mm. These data were obtained by cou-pling the waveguide in a region near the maximum thickness ~the center of the circular fringes!. The further the coupling from this region, the lower the effective indices. All data are consistent with a constant refractive index of the film ng
51.493 and with a thickness which decreases by about 5% ~fromt52.80mm tot52.65mm) at 1.5 cm from the center of the rings. At 514.5 nm, a fourth mode appears in TE polarization ~not in TM!, but this occurs only in the region where the thickness is greater than about 2.7mm. To calcu-late the electric-field patterns of the modes, we need the re-fractive index at 514.5 nm; the wavelength used in Brillouin spectroscopy. The value ng(514.5 nm)51.4975 is obtained by extrapolation from the data ng(543.5 nm)51.493 and
ng(632.8 nm)51.489. Since the dispersion curves of mixed SiO2– TiO2 systems are not available, the extrapolation
pro-cedure could be affected by a serious error.
EDS measurements on the film deposited on silicon sub-strate, reference of the RFSW1 waveguide, give a 92% SiO2– 7% TiO2– 1% ErO2/3 composition, with 10%
esti-mated error. The measured refractive index of the wave-guide, at 632.8 nm, is reproduced very well by the Lorentz– Lorenz equation for this composition, using n51.457 and
n52.385 for the refractive index of SiO2 and TiO2,
respec-tively. This indicates that the film has no important residual porosity.
An attenuation coefficient of 0.2 dB/cm is measured at 632.8 nm for the TE0 mode of the RFSW1 waveguide. The
main source of losses in this kind of waveguide is the surface roughness.23By SEM measurements, no surface structure is evidenced. The losses are low also at 514.5 nm, so that a nearly constant excitation is present along the path of about 5
mm of the guided light, seen by the collection optics of the Raman or Brillouin spectrometers.
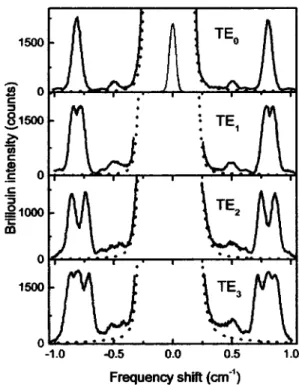
Figure 1 shows the BS of the RFSW1 waveguide, ex-cited in the four TEm modes. Two well defined peaks at about 0.5 cm21and 0.8 cm21appear in the TE0spectra, due
to the scattering from transverse and longitudinal phonons, respectively. They are relatively well resolved from the tails of the elastic scattering both in the Stokes and in the anti-Stokes parts of the spectrum. The elastic peak, reduced in intensity by a factor of about 104, is also reported in order to show the frequency resolution of the measure (Dn
50.055 cm21). The width of Brillouin peaks is larger than the frequency resolution of the apparatus.
The two weak peaks centered at about 0.6 cm21 and at 1.0 cm21
are spurious and their intensity depends on the quality of the prism waveguide coupling. They are due to substrate modes produced by light scattered at the prism waveguide coupling region: They dominate the spectra ob-tained by detuning the waveguide from the guiding angle on both sides, when the waveguide is not excited and a quite weak intensity enters into the substrate. These two spurious peaks are present in all spectra, but their intensity is usually weak and they are often confused in the background.
For TE1 excitation, the longitudinal and the transverse
peaks split into two components, even if the splitting of the transverse peak is not really well resolved. The splitting in-creases as the modal number inin-creases. The origin of this splitting, discussed in detail in Ref. 12, is easily explained by a simple ray-tracing approach, which considers that scatter-FIG. 1. BS of the RFSW1 waveguide, excited at 514.5 nm in the four TEm
modes. The scattering from transverse and longitudinal phonons appears in the spectral regions at about 0.5 cm21 and 0.8 cm21, respectively. The elastic peak of the TE0spectrum, reduced in intensity by a factor of about 104, shows the frequency resolution
~0.055 cm21! of the measure. The dotted lines are an estimation of the elastic tail, to be subtracted from the spectra.
ing occurs at two different exchangedqvalues, correspond-ing to the two directions of propagation of the laser beam in its zig-zag path within the waveguide.11The interference of the two scattered fields causes the appearance of a single peak in the case of TE0 excitation.
Form52,3, this splitting is large enough to cause a par-tial superimposition of the longitudinal and transverse parts of the spectrum; furthermore, the low-energy part of the transverse contribution is no longer well resolved from the elastic tail. The dotted lines in Fig. 1 are an estimation of this tail, to be subtracted from the spectra. After this subtraction, the anti-Stokes and Stokes spectra are compared to check intensities and frequency position of the peaks. The intensi-ties should be the same, since the Bose factor n(v,T), at room temperature and for v<1 cm21
, is much larger than 1.0. The peak positions, after the corrections for the nonlin-ear scan of the apparatus, are reproduced, from scan to scan, within 0.01 cm21
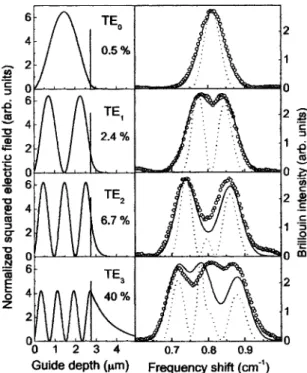
. This limits the accuracy of the measure of the longitudinal sound velocity to about 1% ~2% for the transverse one!. After this comparison, the average of Stokes and anti-Stokes spectra is considered. Figure 2 shows the result of this analysis in the longitudinal phonon spectral region, after a further subtraction of the transverse phonon contribution for the TE2 and TE3 spectra. The experimental
spectra are compared with the results of the calculation using the model of Ref. 12. Here, and in the following, we will use for the polarizability tensor the form Py y(X)}(n2(X)21),
where n(X) is the refractive index at a depth X from the surface of the film. For the waveguide under study, n(X)
51.4975 for X,2.75mm andn(X)51.4617, the value of the silica substrate, forX.2.75mm. The convolution of the calculated spectra with the spectral response of the apparatus is also shown, in order to allow a direct comparison with the experimental spectra. The calculated spectra were stretched in both directions: On the intensity scale, as usual, but also on the frequency scale. This corresponds to adjusting the sound velocities to fit the frequencies of the peaks. In this way, the values of the longitudinal and transverse sound ve-locities are obtained from each spectrum. The model repro-duces very well the TE0 and TE1 spectra while the
agree-ment, in the case of the TE2 spectrum, is not as close. The
TE3spectrum shows three peaks. The position of the central
peak is not reproduced by the model. This point will be discussed later.
Within the uncertainty due to the limited reproducibility of the peak frequencies, the value of the sound velocities are the same for all m, vL5(5.8860.06) km/s, and vT5(3.63
60.05) km/s.
A detailed analysis of the four experimental spectra of Fig. 2 shows that the center of mass of both the longitudinal and transverse contributions shifts slightly toward lower fre-quencies as the mode index mincreases. In fact, the wave-guide is positioned nearly perpendicular to the axis of light detection and turned at different angles in order to couple the exciting laser beam to the four modes. Therefore, the scat-tered light is not really collected exactly at 90° degrees, but at angles between 91° for the TE0 excitation and 88.5° for
TE3 excitation. Of course, the calculated spectra take into
account the actual orientation of the waveguide.
As shown on the left-hand side of Fig. 2, the three TEm modes with m<2 are very well confined in the waveguide, but this is not the case for the TE3 mode which extends
deeply into the substrate with an important evanescent tail. Therefore, the m<2 BS gain intensity only on the guiding film and indeed give the right information on their elastic properties. On the contrary, the TE3 spectrum has an
impor-tant contribution deriving from the silica substrate. In this case, the measured sound velocities are effective values, with different weights from the substrate and the film. This is better clarified in Fig. 3 by the comparison of the TE3spectra
taken by coupling the prism to different regions of the waveguides, corresponding to different values of thicknesst. In each measurement, the excited volume had a nearly equivalent thickness, because the waveguide was oriented on the coupling prism in order to have the laser beam tangent to the interference rings produced by the thickness gradient. A small change in the thickness has dramatic effects on the field profile of the TE3 mode and, therefore, on the BS, the
more important the evanescent field in the substrate, the more intense the central peak with respect to the two other external peaks. In fact, the external peaks are produced by the two beams which propagate with different wave vectors, and with a definite phase relation, causing interference, in the zig-zag path within the waveguide.12The central peak, on the contrary, is due to the scattering of the substrate, excited by the evanescent field. Since the model assumes a single sound FIG. 2. Left-hand side column: Calculated squared electric-field patterns of
thel5514.5 nm TEmexcitations as a function of the depth in the RFSW1
waveguide. The vertical bar indicates the position of the film–substrate in-terface. The percentage of the laser intensity traveling in the evanescent tail of the substrate is indicated. Right-hand side column: BS in the frequency region of the longitudinal phonons after subtraction of the elastic tail and of the estimated transverse contribution and averaging the Stokes and anti-Stokes spectra~open circles!; spectra calculated by the model~of Ref. 12! ~dotted line!withvL55.88 km/s for TE0excitation,vL55.90 km/s (TE1), vL55.86 km/s (TE2), andvL55.90 km/s (TE3); convolution of the calcu-lated spectra with the instrumental response~solid line!.
4885
J. Appl. Phys., Vol. 94, No. 8, 15 October 2003 Chiaseraet al.
velocity for the waveguide–substrate system, it cannot repro-duce the position of the two contributions at the same time. The frequencies of the two external peaks are reproduced by a longitudinal sound velocity ~of the waveguide! vL
55.88 km/s@Figs. 3~a!and 3~b!#, while the frequency of the central peak is reproduced by a longitudinal sound velocity vL56.10 km/s@Figs. 3~c!#. This value is close to that of the sound velocity of the substrate, vLS5(6.0560.06) km/s. Note that the scattered intensity at any frequency is obtained by squaring the sum of the fields scattered at any point in the system, i.e., waveguide and substrate. Therefore, the afore-mentioned attributions should be considered as purely in-dicative, since the interference of the two contributions is important. However, the spectrum of Fig. 3~c!is very similar to that of the bulk substrate, measured in a standard 90° geometry. As a matter of fact, in this case, most of the inten-sity ~77%! of the laser beam travels in the substrate. The width of the Brillouin line in the substrate spectrum ~not shown! is governed only by the frequency response of the apparatus since the excitation beam has a large waist~about 50mm!in this experiment; the width of the peak of Fig. 3~c! is greater, because the excitation exponentially decreases in the substrate ~half of the intensity is reached at a depth d 53.3mm from the waveguide–substrate interface!, so that phonons producing scattering do not have a well defined wave vector component along the direction perpendicular to the waveguide surface (DkX.1/d).
From the analysis of the RFSW1 waveguide, we con-clude: ~i! the measured sound velocities, vL5(5.88
60.06) km/s and vT5(3.6360.05) km/s, are slightly greater than those measured in Ref. 11. This could be attrib-uted to the higher-temperature annealing (Ta5600 °C in the present case,Ta5400 °C in the case of Ref. 11!, which im-proves the stoichiometry and reduces the losses by producing a more compact structure; ~ii! the model of Ref. 12 repro-duces the observed BS not only for well confined mode, but also for modes with an important evanescent field in the substrate, even if the two fit with different values of the sound velocities of the waveguide and substrate and are needed for reproducing the two contributions.
B. Graded-index waveguides
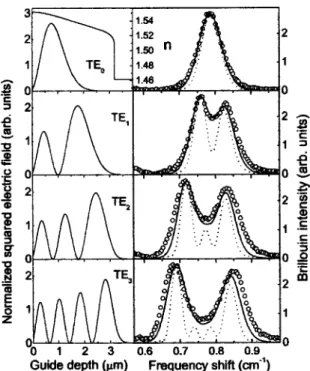
Figure 4 shows the BS of a graded-index planar wave-guide ~RFSW2! in the region of the longitudinal phonons. The upper left-hand side of Fig. 4 shows the refractive index profile obtained at 514.5 nm by extrapolation of those calcu-lated by a WKB inverse method at 543.5 nm and 632.8 nm, based on the m-line data. RBS data indicate that the silica/ titania ratio is constant across the waveguide ~10% TiO2– 90% SiO2). On the contrary, a gradient of erbium
concentration is measured. The ratio Er/(Si1Ti) increases from about 1.4 mol % near the substrate, to about 2.9 mol % at the surface of the film. The observed gradient of the re-fractive index can be ascribed to the erbium concentration gradient.24 The squared electric-field patterns of four TEm modes ~the waveguide has six TE modes at 514.5 nm! are also shown on the left-hand side of Fig. 4. The right-hand column of Fig. 4 shows the corresponding BS, measured by FIG. 3. Left-hand side column: Squared electric-field patterns of the l
5514.5 nm TE3excitations as a function of the depth in the RFSW1 wave-guide, calculated for three different values of the thickness. The vertical bar indicates the position of the film–substrate interface at 2.8mm~a!, 2.75mm ~b!, and 2.7mm~c!. The percentage of the laser intensity traveling in the evanescent tail of the substrate is indicated. Right-hand side column: Esti-mated BS of the longitudinal phonons~open circles!; spectra calculated with vL55.88 km/s@~a!and~b!#andvL56.1 km/s~c! ~dotted line!and convolu-tion of the calculated spectra with the instrumental response~solid line!.
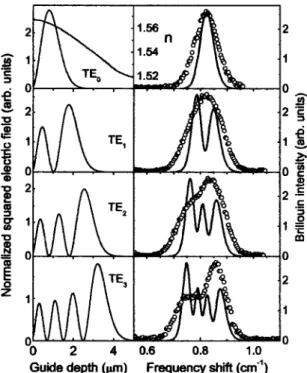
FIG. 4. Upper left-hand side frame: Refractive index profile at 514.5 nm of the RFSW2 waveguide, reconstructed from modal measurements at 543.5 nm and at 632.8 nm for the TE polarization. Left-hand side column: calcu-lated squared electric-field patterns of the five TEm modes at 514.5 nm.
Right-hand side column: estimated Brillouin spectra of the longitudinal phonons~open circles!; spectra calculated by the model~of Ref. 12!with vL55.6 km/s~dotted line!and convolution of the calculated spectra with the instrumental response~solid line!.
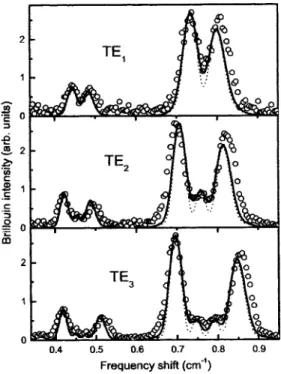
the SOPRA apparatus, together with the results of the model of Ref. 12 ~dotted line!. For TEm excitations with m>2, additional peaks between the two main longitudinal peaks appear in the calculated spectra. However, the minor struc-tures are lost after convolution of the calculated spectra with the response function of the SOPRA spectrometer~solid line in Fig. 4!. Higher-resolution measurements are indeed to possibly evidence the provisions made by the model. Figure 5 shows the BS for the modesm51, 2, 3 taken with higher resolution ~0.013 cm21! by using a tandem Fabry–Perot. This apparatus employs a single-mode diode pumped solid-state laser operating at 532 nm and, therefore, the data of Figs. 4 and 5 are not directly comparable. Of course, also the field profiles of Fig. 5~not reported; at 532 nm there are only five TE modes! and the calculated BS are slightly different from those of Fig. 4. The experimental resolution is now sufficient to detect the central peaks in the TE2 and TE3
spectra, as shown by the convolution of the calculated spec-tra with the response function of the Fabry-Perot ~solid line in Fig. 5!. As a matter of fact, the central structures, even if
not really well resolved, seem to appear, but the observed structures are broader than the calculated ones. The observed splittings are larger than the calculated ones and the relative intensities of the two main peaks of the longitudinal phonons are not well reproduced by the model. In this case, the com-parison of the experimental spectra with those calculated by the model of Ref. 12 is quite critical since the model does not reproduce the observed line shape very well. The lack of a full agreement is the main source of error in the estimated sound velocities. For TE3 excitation, both the transverse
(vT53.4560.04 km/s) and longitudinal (vL55.74
60.04 km/s) sound velocities appear to be slightly higher than those used for fitting the spectra of other excitations (vT53.3760.04 km/s,vL55.6060.04 km/s). This could be related to a gradient in the elastic constant profile caused by the gradient in the erbium content.
C. Sol–gel waveguides
A more stringent test of the Brillouin scattering model for the graded-index waveguides has been performed by pro-ducing a three-layered SiO2– TiO2waveguide by the sol–gel
dip-coating technique. The waveguide~SGW1!supports five TE and TM modes at 543.5 nm and four at 632.8 nm. Three single-layered waveguides~R1, R2, and R3!, with the same composition and growth procedure, were also produced for reference. The composition of the three layers was 8% TiO2– 92% SiO2, 16% TiO2– 84% SiO2, and
24% TiO2– 76% SiO2, respectively, starting from the
sub-strate. The thickness and refractive index of the three refer-ence waveguides, measured by m-line technique, are re-ported in Table I. The graded-index and the three single-layered waveguides were characterized by Raman scattering. The comparison of the Raman spectra taken by excitation in different modes of the graded-index waveguide, allows one to selectively study the three layers.25 From this study, the structure of the second and the third layer appears to be the same as that of the reference samples, but this is not the case for the first layer with the lowest titania concentration. The final thermal annealing at 1000 °C produced complete densi-fication in the reference waveguide, but a residual porosity was present in the first layer of the graded-index waveguide. This was probably due to a densification of the external lay-ers occurring at a lower temperature than that of the internal first one, which was indeed not allowed to freely expel its products of reaction. The Raman data were supported by the
m-line measurements: It was not possible to reproduce the five effective indices measured at 543.5 nm in the graded-index waveguide by using the values of thickness and refrac-FIG. 5. BS~open circles!of the RFSW2 waveguide by excitation at 532 nm
after averaging the Stokes and anti-Stokes spectra; spectra calculated by the model~of Ref. 12!usingvL55.6 km/s andvT53.37 km/s for them51, 2 spectra andvL55.74 km/s andvT53.45 km/s for them53 spectrum~ dot-ted line! and convolution of the calculated spectra with the instrumental response~solid line!.
TABLE I. Parameters of the three layered sol–gel silica–titania waveguide~SGW1!and of the three reference waveguides~R1, R2, and R3!: Chemical composition, thickness~t!, refractive index at 543.5~n!, number of TE and TM modes~N!, thickness (ti), and refractive indices (ni) of the three layers used for reproducing them-line
results.
Composition t(mm) n N ti ni
R1 (8% TiO2– 92% SiO2) 1.1560.10 1.49660.010 1 1.0 1.478
R2 (16% TiO2– 84% SiO2) 0.7860.05 1.55660.005 2 0.78 1.556
R3 (24% TiO2– 76% SiO2) 0.8960.05 1.62160.005 2 0.89 1.621
4887
J. Appl. Phys., Vol. 94, No. 8, 15 October 2003 Chiaseraet al.
tive index measured in the three reference waveguides. A refractive index lower than that expected for the 8% TiO2– 92% SiO2composition was needed for
reproduc-ing, in particular, the TE4 mode, which has a large field in
this layer. Therefore, we were forced to take, as free param-eters, the thickness and refractive index of this layer ~see Table I!, in this way reproducing them-line results within the experimental error. The refractive index profile, calculated at 514.5 nm by extrapolation of the data at 543.5 nm and at 632.8 nm, is shown on the upper left-hand side of Fig. 6. The calculated profiles of the squared electric field show that the different modes selectively excite the different layers of the waveguide: The TE0mode is practically completely confined
in the third~from the substrate!layer, while the TE4 mainly
occupies the first layer. The BS in the longitudinal phonon spectral region are shown on the right-hand side of Fig. 6, together with the calculated ones, after averaging the Stokes and anti-Stokes spectra and subtracting the transverse pho-non contribution. The longitudinal phopho-non contribution of the TE2 spectrum shows a feature with three peaks of
com-parable intensities. The phenomenology is very similar to that of the TE2 spectrum of the triangular refractive index
profile studied in Ref. 12. In such a system, the calculation made a provision for the presence ofm11 peaks of compa-rable intensity, for anym, instead of the two peaks typical of the step profiles.11For the TE0, TE1, and TE2 spectra, the
agreement is good even if the observed intensity of the higher-frequency components in the TE1 and TE2 spectra is
lower than expected and the observed linewidth is slightly larger than expected. In the TE3 spectrum, only three peaks
are observed instead of the four calculated ones. The TE4
shows a single strong peak with shoulders, partially repro-duced by the calculations. It is possible that the lack of com-plete agreement of the model results with the experimental TE3and TE4spectra is due to bad modeling of the first layer.
In any case, a general agreement is present in all spectra, sufficient to determine with high accuracy the longitudinal sound velocity. Within the experimental error, we use the same value vL.5.9 km/s for the four excitation withm<3. These four modes involve, with different weights, the two external layers with the compositions 24% TiO2– 76% SiO2
and 16% TiO2– 84% SiO2. We should conclude that the
longitudinal sound velocity is nearly the same for the two compositions. A rather weak dependence of the sound veloc-ity on the titania content was already observed.11,26 On the contrary, the TE4spectrum, with most of the excitation in the
internal layer with the composition of 8% TiO2– 92% SiO2,
shows a lower value of the longitudinal sound velocity, vL
.5.75 km/s. Therefore, the Brillouin scattering result is in agreement with those of the measurements of the refractive and of Raman scattering, all indicating that this internal layer has a residual porosity and did not undergo full densification. The BS of transverse phonons is well resolved from the longitudinal contribution and the tail of the Rayleigh scatter-ing only for the excitation in TE0 and TE1 modes. The two
spectra are fitted withvT53.6 km/s.
D. Ion-exchanged waveguides
Figure 7 shows the result for a Ag-exchanged soda-lime waveguide~IEW1!. The refractive index profile at 514.5 nm, FIG. 6. Upper left-hand side frame: Refractive index profile at 514.5 nm of
the three-layered SGW1 planar waveguide. Left-hand side column: Calcu-lated squared electric-field patterns of the five TEmmodes. Right-hand side
column: BS~open circles!, calculated spectra~dotted line!, and convolution of the calculated spectra with the instrumental response~solid line!. The longitudinal sound velocity used in the fit isvL55.9 km/s form50, 1, 2, and 3 andvL55.75 km/s form54.
FIG. 7. Upper left-hand side frame: Refractive index profile at 514.5 nm of the IEW1 waveguide. Left-hand side column: Calculated squared electric-field patterns of the four TEmmodes. Right-hand side column: Experimental
~open circles!and calculated~solid line!Brillouin spectra. The longitudinal sound velocity used in the calculation are vL55.68 km/s for m50, vL
55.70 km/s form51, 2, andvL55.75 km/s form53.
reported in the upper left-hand side frame, was obtained by extrapolation of the profiles at 632.8 nm and 543.5 nm. The graded-index profile is caused by the exchange of Na1 ions with heavier Ag1 ions and reflects the Ag1 concentration, which extends to about 3mm in the glass.27The observed BS show quite broad peaks, much broader than the calculated ones and broader than those of the experimental resolution. The expected splitting of the TE1 spectrum is not observed
and only two broad peaks, not well resolved, appear in the TE2and TE3spectra, instead of the three and four expected,
respectively. Furthermore, the low-frequency component is weaker than the high-frequency one, whereas the calculation makes the opposite provision. Very similar results were ob-tained on other Ag-exchanged soda-lime waveguides, includ-ing a thicker waveguide with ten TE modes at 514.5 nm.28 The simple model, which does not account for phonon re-fraction and reflection, does not accurately reproduce the spectra in these waveguides with a gradient in the elastic constants. In any case, the comparison of the calculated spec-tra with the observed ones provides interesting information. The best agreement, even if there is some degree of arbitrari-ness in the superposition of the measured and calculated spectra, is obtained with different values of the sound veloc-ity for the different TE modes. The value of the effective sound velocity seems to increase with the m-modal index, toward the bulk value vL55.9 km/s. Looking at the excita-tion profiles reported on the left-hand side of Fig. 7, we conclude that the exchange of sodium with silver lowers the sound velocity of the glass as expected since the mass den-sity of the glass should increase.
IV. CONCLUSIONS
BS produced by bulk phonons have been detected in waveguides of different thicknesses and compositions, in-cluding graded-index waveguides, with the excitation in a mode of the waveguide. The shapes of the BS depend on the mode index and are structured. We can account for the main features of the spectra by means of a simple model which assumes a single-sound velocity for the whole system. The fit to the experimental spectra provides an effective sound ve-locity relative to the excited layer of the waveguide. In a multimode waveguide, if the modes propagate at different depths, different values of the effective sound velocity are obtained. This allows information to be obtained on the elas-tic properties of different layers. In a sol–gel derived wave-guide, a residual porosity in an internal layer was evidenced by measuring a longitudinal sound velocity lower than that of the densified glass. By comparing the effective longitudi-nal sound velocities at different depths in an Ag1-exchanged soda-lime waveguide, we showed that the exchange of so-dium with silver lowers the value of the sound velocity.
ACKNOWLEDGMENTS
This research was performed in the context of the fol-lowing projects:~No. CNR-ICCTI 2001-2004!Optical
Am-plification in Rare-Earth-Doped Glass Integrated Optical Waveguides,~No. CNR-CNRS 2002-2003!Improvement of the Multitarget rf Sputtering and Sol–Gel Techniques for Fabrication of Er312Yb31 Silica-Based Photonic Compo-nents Operating in the C-Telecommunication Band, and~No. COFIN 2002! Materiali Nanostrutturati per l’Ottica Inte-grata.
1D. Heiman, D. S. Hamilton, and R. W. Hellwarth, Phys. Rev. B19, 6583
~1979!.
2
J. R. Sandercock, inLight Scattering in Solids, edited by M. Cardona and G. Guntherodt~Springer, Berlin, 1982!.
3F. Nizzoli and J. R. Sandercock, inDynamical Properties of Solids, edited
by G. Horton and A. A. Maradudin~North–Holland, Amsterdam, 1990!, p. 281.
4P. Mutti, C. E. Bottani, G. Ghislotti, M. Beghi, G. A. D. Briggs, and J. R.
Sandercock, in Advances in Acoustic Microscopy, edited by G. A. D. Briggs~Plenum, New York, 1995!, p. 249.
5A. C. Ferrari, J. Robertson, M. G. Beghi, C. E. Bottani, R. Ferulano, and
R. Pastorelli, Appl. Phys. Lett.75, 1893~1999!.
6J. R. Sandercock, Phys. Rev. Lett.29, 1735~1972!.
7N. L. Rowell, V. C.-Y. So, and G. I. Stegeman, Appl. Phys. Lett.32, 154
~1978!.
8
N. L. Rowell and G. I. Stegeman, Phys. Rev. Lett.41, 970~1978!.
9
N. L. Rowell, V. C.-Y. So, R. Normandin, and G. I. Stegeman, Can. J. Phys.60, 1821~1982!.
10J. R. Sandercock, Top. Appl. Phys.51, 173~1982!.
11M. Montagna, M. Ferrari, F. Rossi, F. Tonelli, and C. Tosello, Phys. Rev.
B58, R547~1998!.
12A. Chiasera, M. Montagna, F. Rossi, and M. Ferrari, J. Appl. Phys.94,
4876~2003!.
13Integrated Optical Circuits and Components. Design and Applications
edited by E. J. Murphy~Marcel Dekker, New York, 1999!.
14
Opt. Eng.37, 1100~1998!,~Speical issue!.
15J. D. Shephard, D. Furniss, P. A. Houston, and A. B. Seddon, J. Non-Cryst.
Solids284, 160~2001!.
16A. Bartolotta, G. Carini, G. D’Angelo, M. Ferrari, A. Fontana, M.
Mon-tagna, F. Rossi, and G. Tripodo, J. Non-Cryst. Solids280, 249~2001!.
17F. Terki, J. Pelous, P. Dieudonne, and T. Woignier, J. Non-Cryst. Solids 225, 277~1998!.
18C. Tosello, F. Rossi, S. Ronchin, R. Rolli, G. C. Righini, F. Pozzi, S. Pelli,
M. Fossi, E. Moser, M. Montagna, M. Ferrari, C. Duverger, A. Chiappini, and C. De Bernardi, J. Non-Cryst. Solids284, 230~2001!.
19S. Ronchin, A. Chiasera, M. Montagna, R. Rolli, C. Tosello, S. Pelli, G. C.
Righini, R. R. Gonc¸alves, S. Ribeiro, C. De Bernardi, F. Pozzi, C. Du-verger, R. Belli, and M. Ferrari, Proc. SPIE4282, 31~2001!.
20
L. Zampedri, M. Ferrari, C. Armellini, F. Visintainer, C. Tosello, S. Ronchin, R. Rolli, M. Montagna, A. Chiasera, S. Pelli, G. C. Righini, A. Monteil, C. Duverger, and R. R. Gonc¸alves, J. Sol-Gel Sci. Technol.26, 1033~2003!.
21S. Pelli and G. C. Righini,Advances in Integrated Optics, edited by M.
Martellucci, A. N. Chester, and M. Bertolotti~Plenum, New York, 1994!, p. 1.
22K. S. Chiang, J. Lightwave Technol.3, 385~1985!.
23C. Tosello, F. Rossi, S. Ronchin, R. Rolli, G. C. Righini, F. Pozzi, S. Pelli,
M. Fossi, E. Moser, M. Montagna, M. Ferrari, C. Duverger, A. Chiappini, and C. De Bernardi, J. Non-Cryst. Solids284, 230~2001!.
24C. Duverger, M. Montagna, R. Rolli, S. Ronchin, L. Zampedri, M. Fossi,
S. Pelli, G. C. Righini, A. Monteil, C. Armellini, and M. Ferrari, J. Non-Cryst. Solids280, 261~2001!.
25
M. Ferrari, M. Montagna, S. Ronchin, F. Rossi, and G. C. Righini, Appl. Phys. Lett.75, 1529~1999!.
26K. Hirao, K. Tanaka, S. Furukawa, and N. Soga, J. Mater. Sci. Lett.14,
697~1995!.
27
G. C. Righini, S. Pelli, M. Brenci, M. Ferrari, C. Duverger, M. Montagna, and R. Dall’Igna, J. Non-Cryst. Solids284, 223~2001!.
28M. Montagna, S. Ronchin, F. Rossi, C. Tosello, E. Moser, M. Ferrari, and
G. C. Righini, Proc. SPIE3942, 224~2000!.
4889 J. Appl. Phys., Vol. 94, No. 8, 15 October 2003 Chiaseraet al.