Abstract— A recursive procedure is applied to the measured near-field profiles of buried optical waveguides recorded in a lithium fluoride (LiF) crystal by femtosecond laser pulses in order to estimate the core dimensions and the refractive index increase. Albeit the waveguides transversal section geometry is quite complex it is possible to obtain the horizontal and vertical widths and the average refractive index maximum increase assuming a simplified rectangular transversal section in the simulation. The procedure is validated by comparing the simulated results with the experimental near-field profiles and the maximum refractive index values of two commercial optical fibers. Typical dimensions of ~(8x10)µm2 and refractive index changes of ~(2-10)x10-4 were obtained for the LiF waveguides at several wavelengths.
Index Terms— Refractive Index Increase, Core Dimension, Optical
Waveguide, Lithium Fluoride, Femtosecond Laser.
I. INTRODUCTION
The dimensions and refractive index (RI) of the core are important parameters for optical
waveguides characterization. These two main attributes and the wavelength behavior permit to specify
the light acceptance into the waveguide (numerical aperture), the propagation condition, dispersion
relation, electromagnetic profile and cutoff frequency of a supported mode, as well as the coupling
coefficient to other waveguides. All of these parameters can be controlled by changing the core
dimensions, the core refractive index or both [1].
The increase ( ) in the spatial RI profile and the waveguide core dimensions can be estimated by
different techniques, such as reflectivity method [2], scattering pattern [3], surface plasmon resonance
[4], prism coupling [5, 6], surface topography [7], refraction method and estimate from near field
profile (NFP) [8, 9]. An inversion of the scalar wave equation to estimate the dimensions and the RI
profile of the waveguide is possible with good signal noise ratio NFP [10].
The experimental requirements associated to the mentioned techniques turn difficult their
application to analyze the RI profile and core dimensions of deep buried optical waveguides recorded
by high intensity pulsed laser beams. This recording technique consists of focusing a laser beam in a
Dimensions and Refractive Index Estimates
of Deeply Buried Optical Waveguides in
Lithium Fluoride
Ismael Chiamenti1, Francesca Bonfigli2, Rosa Maria Montereali2 and Hypolito J. Kalinowski1 1. Federal University of Technology - Paraná, 80230-901, Curitiba, Brazil 2. ENEA C. R. Frascati, Photonics Micro and Nanostructures Laboratory, UTAPRAD-MNF, 00044
Frascati (RM), Italy
sample that is displaced perpendicular or longitudinal with respect to the laser propagation direction
[11, 12]. The focused laser spot induces modifications of the sample structure resulting in RI changes.
The RI profile recorded by this technique usually does not show a regular transverse shape [13, 14].
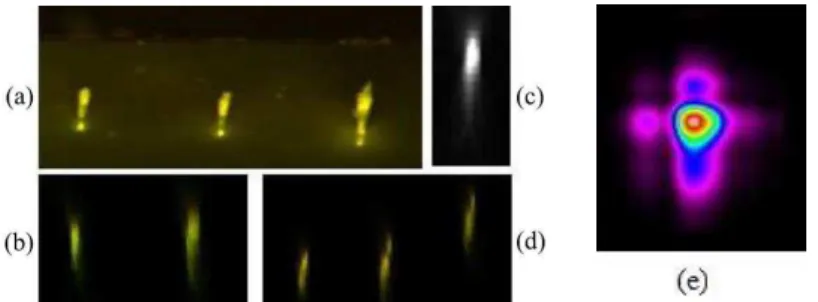
Recently, the writing of fs induced waveguides in Lithium Fluoride and several of their
characteristics were reported [15, 16], the observed transversal cross section is also not regular, as can
be seen in Fig. 1, which shows fluorescence confocal laser microscopy images of the transverse plane
from (a) the side face and (b to d) from the bulk of a lithium fluoride crystal, where several optical
waveguides were recorded by a femtosecond pulsed laser. The visible fluorescence is due to the local
formation of laser-active aggregate color-centers in the LiF matrix [15, 16]. Figure 1(e) shows the
NFP measured from one waveguide when using an ASE source, with central wavelength at 1550 nm,
to launch light into the waveguide.
Fig. 1. Core transverse section of optically recorded color-center waveguides in a LiF crystal as seen by fluorescence confocal laser microscopy: (a) side face, (b-d) inside the crystal
and (e) the NFP from waveguide #4, @1550 nm,
In this manuscript we detail the recursive procedure used to estimate the average and transverse
dimensions of that optical waveguides, deeply recorded by intense laser pulses in an optically
transparent material such as LiF. The approach uses a non destructive technique to measure the NFP.
Assuming a rectangular core with step refractive index profiles, a recursive procedure is applied to the
experimental data. The approach is validated on two commercial optical fibers, comparing the
obtained results with their known parameters. Subsequently the procedure is used to estimate the
average and the transverse dimensions of optical waveguides recorded ~160 µm deep from the top
polished surface in a LiF crystal, at several wavelengths.
II. MATERIALS AND METHODS
A. Numerical Modeling
The proposed procedure uses (i) the NFP measured at a specific wavelength (635 nm, the measured
data is treated with 1 Hz low-pass filter in order to reduce the numerical error in the second
derivatives calculation [8]) to estimate the maximum values in the horizontal and vertical
directions, and , respectively. The estimation uses an inversion of the scalar
[ ] (1)
where is the Laplacian operator in the plane transversal to the propagation direction, is the
field function amplitude, the vacuum wave number, the refractive index of the medium and the
propagation constant. Considering a small refractive index increase, n, and disregarding the square
term, , it is possible rewrite equation (1) as[8]
√ √
(2)
where is the near field intensity measured experimentally and the refractive index of the
surrounding medium, in this case the LiF bulk value at the selected wavelength. (ii) The estimated
maximum and are used to simulate the NFP of an optical waveguide at the same wavelength
of the light source used to obtain the experimental NFP. Due the unknown core shape of the
waveguides, the NFP simulation considers a simplified rectangular core transverse section and
TE polarization. The propagation constant is obtained from effective index method and the spatial
field distribution from Marcatili's Method [1, 17]. The waveguide transverse section dimensions,
H and V, related to the horizontal and vertical directions, respectively, are adjusted to achieve the best
fit between experimental and simulated NFP. The results consist of a set of transverse section
dimensions as function of the RI estimate for the horizontal and vertical directions. (iii) Finally, in
order to corroborate the estimate values of RI and core dimensions, the procedure is applied using
NFP measured with light sources at other two wavelengths, 460 nm and 1550 nm, as well at 635nm.
The values of , H and V are adjusted to achieve best fitted experimental and simulated NFP for the
set of three different wavelengths. The final data consist of a set of values, each one related to a
considered wavelength and just one couple of dimensions H and V for each waveguide. The code was
implemented in MATLAB.
B. Numerical Test on Optical Fibers
The NFP simulation procedure is applied to the analysis of two commercial optical fibers
(FSSN-3224-SM @ 632.8 nm and COA-SMMF-SM @ 1550 nm. The proposed approach was tested using
the maximum values estimated from the measured NFP for both optical fibers. The results were
also compared with the step-index profile provided by the manufacturers. The NFP measurements
were performed by using a semiconductor laser at 635 nm and a broad C-band source.
As an example, Fig. 2a shows the estimated from the measured NFP together with that value
provided by the manufacturer for the single mode fiber at 1550 nm. Fig. 2b shows the experimental
NFP compared with those calculated by using the maximum values reported in Fig. 2a and the
Fig. 2. (a) spatial profiles provided by the manufacturer and the estimated one derived from the NFP measured at 1550nm and (b) the experimental and simulated NFP using the RI provided by manufacturer and the maximum value of the estimated for the COA-SMMF-SM sample.
In Fig. 2b the central region of the simulated intensity profile (from its maximum to about 35 % of
it) agrees well with the measured NFP for both wavelengths, the absolute mean errors are less than
1 % and than 2 % for the single mode optical fibers at 632.8 nm and 1550 nm, respectively. The tails
show differences attributed to the transverse core geometry, circular for the commercial optical fibers
and rectangular in the simulations. Table I shows the values of the full width at half maximum of NFP
as derived from measurements and from the simulations for the two optical fibers at both
wavelengths, using the values provided by the manufacturer and those estimated by the NFP. In
both case, the differences are consistent with the uncertainty of the used NFP measure system (~5 %)
and agree with the values provided by the optical fibers manufacturers: 4.0 ± 0.5 µm and
10.5 ± 0.8 µm for single mode optical fibers at 632.8 nm and 1550 nm, respectively.
TABLE I.OPTICAL FIBERS MODAL FIELD DIAMETER,FWHM[µm], AT TWO WAVELENGTHS.
Optical Fiber Direction Experimental Calculated
Manufacturers Estimated
[email protected] H 4.05 4.01 4.06
V 4.11 4.01 4.07
SM@1550nm H 10.45 10.16 10.37
V 10.56 10.14 10.34
C. Experimental Details
We analyzed color-center optical waveguides recorded in a LiF crystal, which has a RI of 1.39599,
1.39123 and 1.38275 at the wavelengths 457.9 nm, 635 nm and 1550 nm, respectively [18]. The
crystal was directly irradiated with a focused femtosecond laser beam using a 20X microscope
objective. The laser has 1 kHz repetition rate and emission band centered at 800 nm. The optical
waveguides were recorded at depths of ~160 µm below the polished crystal top surface. The NFP was
measured launching different light sources in the waveguides by a 10X microscope objective. At the
(models BP104UV and BP104IR, depending on the used wavelength). The microscope objectives and
the LiF crystal were assembled on translation stages Newport ULTRAlign 561 series to achieve the
optical alignment. The LiF crystal is hard and it is difficult to properly polish or cleave its side facets.
This implies that mechanical damages generated by the focalized laser beam on the entrance and exit
sides during the waveguides recording process could not be fully eliminated. Methods that require
high quality of the NFP measure can have limitations under such conditions [8, 9].
III. RESULTS AND DISCUSSION
Using the described approach the core dimensions and the corresponding are adjusted to match
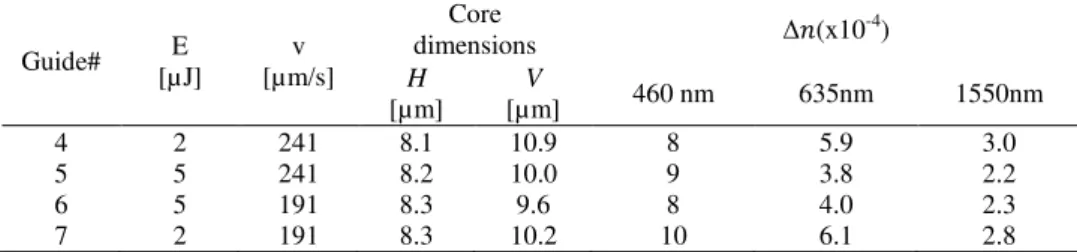
the experimental NFP at each of the used wavelengths. Table II shows the recording parameters of the
LiF waveguides (laser energy and sample translation velocity), the calculated values of the core
dimensions and increase, from the best fitted simulated NFP.
TABLE II.RECORDING PARAMETERS, CORE DIMENSIONS AND REFRACTIVE INDEX CHANGE
VALUES ESTIMATED AT THREE WAVELENGTHS FOR SEVERAL LIF WAVEGUIDES.
Guide# E [µJ]
v [µm/s]
Core
dimensions (x10
-4 )
H
[µm]
V
[µm] 460 nm 635nm 1550nm
4 2 241 8.1 10.9 8 5.9 3.0
5 5 241 8.2 10.0 9 3.8 2.2
6 5 191 8.3 9.6 8 4.0 2.3
7 2 191 8.3 10.2 10 6.1 2.8
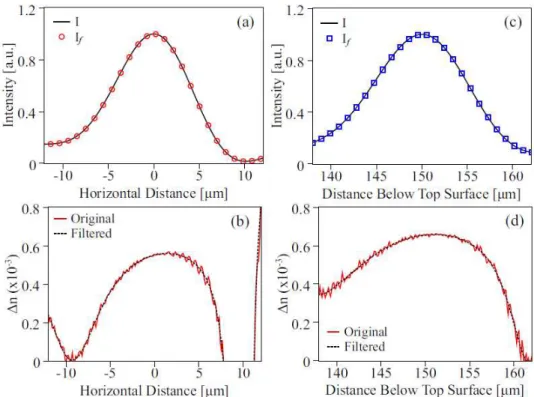
Fig. 3(a, c) shows the experimental NFP as measured at 635 nm and after numerical processing
with a 1 Hz low pass filter, I and If, respectively, for the horizontal (Fig. 3a) and vertical (Fig. 3c)
directions. From these plots it is possible to see that the filtering process influences only the noise on
the estimate, without distorting its main features, as shown in Fig. 3(b) and (d). According with
these values, the experimental and simulated NFP for the waveguide #4 on horizontal and vertical
directions are shown in Fig. 4(a) and (b), respectively. The difference between the simulated and
measured NFP intensity profiles outside the central region can be attributed to several factors,
including scattering of light at damage regions caused by laser ablation at the waveguide exits, multi
modal propagation, leaky modes and interference patterns generated by reflections. Disregarding
these side regions, the measured intensity profiles agree well with the simulated NFP.
Table III summarizes the values of the full width at half maximum of the experimental and
simulated NFP corresponding to the dimensions and refractive index differences given in Table II for
Fig. 3. Measured, I, and filtered, If , experimental NFP (a,c) and estimate (b,d)
on horizontal (a-b) and vertical (c-d) directions of waveguide #4 at 635 nm.
Fig. 4. Experimental and simulated NFP of waveguide #4 at 635 nm, for (a) horizontal and (b) vertical directions.
TABLE IIIEXPERIMENTAL AND CALCULATED FWHM OF SEVERAL LIF WAVEGUIDES AT THREE WAVELENGTHS.
Guide#
FWHM [µm] at wavelengths
460nm 635nm 1550 nm
H V H V H V
4 Exp. 9.3 12.1 9.7 12.6 16.8 15.5 Sim. 9.0 11.9 9.8 12.5 14.5 17.0
5 Exp. 9.5 10.1 10.6 12.8 18.7 14.9 Sim. 9.1 10.9 10.3 12.1 16.4 17.9
6 Exp. 9.5 9.8 10.6 12.5 17.7 17.0 Sim. 9.2 10.5 10.4 12.0 15.7 17.1
At 460 nm and 635 nm the differences in the values of core dimensions directly derived from NFP
and those calculated on the basis of the values of Table II are less than 8 %. The greater mismatch
at 1550 nm can be ascribed to effects of the broadband light source used to measure the profile, with
respect to the single line wavelength used for the simulation. In this case, the experimental NFP
measures consist of a modal profile composition as a function of the wavelength.
IV. CONCLUSIONS
The results obtained with the proposed approach, together with those obtained in the numerical test
performed on commercial optical fibers, show the possibility to estimate the core dimensions and the
average increase of the refractive index of LiF optical waveguides without the need of knowing
details about the core shape and profile. Assuming a simplified rectangular transversal section, the increase and the transversal dimensions were estimated by a recursive procedure used to compare the experimental and simulated NFP of the waveguides at several wavelengths. The recursive
procedure permits to estimate these parameters from measured data with simple numerical treatments.
The estimated values obtained for optical waveguides recorded by fs laser pulses in LiF are in
order of (2 - 10)x10-4, at wavelengths in the visible to near-infrared spectral range and the best fitted
core dimensions are ~(8x10) µm2. The obtained results also support the possibility of recording low
index contrast buried optical waveguides in lithium fluoride crystal by femtosecond laser irradiation,
having single to few modes of propagation.
ACKNOWLEDGMENT
The authors thank Dr. Vladimir Kalinov for providing the used blank lithium fluoride crystals;
financial support from CNPq, CAPES, FINEP and Fundação Araucária (Brazilian Agencies) is also
highlighted. Dr. Kalinowski acknowledges support from ICTP (Italy), through its Senior Associate
Programme, for visiting periods at ENEA C.R. Frascati.
REFERENCES
[1] K. OKAMOTO, Fundamentals of Optical Waveguides. 2 ed. Amsterdam: Elsevier Inc., 2006.
[2] G. E. AIZENBERG, P. L. SWART and B. M. LACQUET, “A Digital Signal-Processing Analysis Technique for The Infrared Reflectivity Characterization of Ion-Implanted Silicon” Journal of Electronic Materials, vol. 21, pp. 1033-1040, 1992
[3] T. OKOSHI, Optical Fibers, First, Ed. Academic Press Inc., 1982.
[4] C. J. ALLEYNE, et al. “Numerical method for high accuracy index of refraction estimation for spectro-angular surface plasmon resonance systems” Optics Express, vol. 16, pp. 19493-19503, 2008.
[6] P. J. CHANDLER, F. L. LAMA, "A new approach to the determination of planar waveguide profiles by means of a non stationary mode index calculation," Optica Acta, vol. 33, pp. 127-143, 1986.
[7] A. CHIASERA, et al. “CO2 Laser irradiation of GeO2 planar waveguide fabricated by rf-sputtering” Optical Materials Express, vol. 3, pp. 1561-1570, 2013.
[8] M. L. BIBRA, A. ROBERTS, "Refractive Index Reconstruction of Graded-Index Buried Channel Waveguides from Their Mode Intensities," Journal of Lightwave Technology, vol. 15, pp. 1695-1699, 1997.
[9] S. Y. XU, et al “Refractive Index Profile in Photorefractive-Damage-Resistant Near-Stoichiometric Ti:Mg:Er:LiNbO3 Strip Waveguide” IEEE Photonics Journal, vol. 4, pp. 1823 – 1830, 2012.
[10] W. S. TSAI, S. C. PIAO, P. K. WEI, "Refractive index measurement of optical waveguides using modified end-fire coupling method," Optics Letters, vol. 36, pp. 2008-2010, 2011.
[11] K. M. DAVIS, et al. "Writing waveguides in glass with a femtosecond laser.," Optics Letters, vol. 21, no. 21, pp. 1729-1731, 1996.
[12] H. ZHANG, S. M. EATON, and P. R. HERMAN, "Single-step writing of Bragg grating waveguides in fused silica with an externally modulated femtosecond fiber laser," Optics Letters, vol. 32, no. 17, pp. 2559-2561, 2007.
[13] R. OSELLAME, et al. "Optical waveguide writing with a diode-pumped femtosecond oscillator," Optics Letters, vol. 29, pp. 1900-1903, 2004.
[14] G. BROWN, et al. "Ultrafast laser inscription of Bragg-grating waveguides using the multiscan technique," Optics Letters, vol. 37, pp. 491-493, 2012.
[15] I. CHIAMENTI, et al. “ Broadband Optical Active Waveguides Written by Femtosecond Laser Pulses in Lithium
Fluoride” Chinese Physics Letters, vol. 31, pp. 014201-014201-4, 2014.
[16] I. CHIAMENTI, et al. “Optical characterization of femtosecond laser induced active channel waveguides in lithium fluoride crystals” Journal of Applied Physics, vol. 115, pp. 023108 - 023108-7, 2014.
[17] M. ADAMS, Introduction to Optical Waveguide. John Wiley \& Sons Ltd., 1981.