Bovine gene polymorphisms related to fat deposition and meat tenderness
Marina R.S. Fortes
1, Rogério A. Curi
2, Luis Artur L. Chardulo
3, Antonio C. Silveira
2,
Mayra E.O.D. Assumpção
1, José Antonio Visintin
1and Henrique N. de Oliveira
21
Departamento de Reprodução Animal, Faculdade de Medicina Veterinária e Zootecnia,
Universidade de São Paulo, São Paulo, SP, Brazil.
2Departamento de Melhoramento e Nutrição Animal, Faculdade de Medicina Veterinária e Zootecnia,
Universidade Estadual Paulista “Júlio de Mesquita Filho”, Botucatu, SP, Brazil.
3
Departamento de Química e Bioquímica, Instituto de Biociências,
Universidade Estadual Paulista “Júlio de Mesquita Filho”, Botucatu, SP, Brazil.
Abstract
Leptin, thyroglobulin and diacylglycerol O-acyltransferase play important roles in fat metabolism. Fat deposition has an influence on meat quality and consumers’ choice. The aim of this study was to determine allele and genotype fre-quencies of polymorphisms of the bovine genes, which encode leptin (LEP), thyroglobulin (TG) and diacylglycerol O-acyltransferase (DGAT1). A further objective was to establish the effects of these polymorphisms on meat charac-teristics. We genotyped 147 animals belonging to the Nelore (Bos indicus), Canchim (5/8 Bos taurus + 3/8 Bos indicus), Rubia Gallega X Nelore (1/2 Bos taurus + 1/2 Bos indicus), Brangus Three-way cross (9/16 Bos taurus + 7/16Bos indicus) and Braunvieh Three-way cross (3/4 Bos taurus + 1/4 Bos indicus) breeds. Backfat thickness, total lipids, marbling score, ribeye area and shear force were fitted, using the General Linear Model (GLM) procedure of the SAS software. The least square means of genotypes and genetic groups were compared using Tukey’s test. Al-lele frequencies vary among the genetic groups, depending onBos indicus versus Bos taurus influence. The LEP polymorphism segregates in pureBos indicus Nelore animals, which is a new finding. The T allele of TG is fixed in Nelore, andDGAT1 segregates in all groups, but the frequency of allele A is lower in Nelore animals. The results showed no association between the genotypes and traits studied, but a genetic group effect on these traits was found. So, the genetic background remains relevant for fat deposition and meat tenderness, but the gene markers developed forBos taurus may be insufficient for Bos indicus.
Key words:bovine gene polymorphisms, candidate gene, fat deposition, beef cattle.
Received: September 14, 2007; Accepted: July 25, 2008.
Introduction
Fat deposition demands beef industry attention for many reasons. To name a few, lean to fat deposition ratio improvement means better feed conversion efficiency, less husbandry cost and lower pressure on world feed supplies (Sillence, 2004). The marbling aspect associates with intra-muscular fat deposition, interfering with consumer habits and meat pricing (Killinger et al., 2004). Controlling backfat deposition is important because carcass quality and backfat thickness measurements are strongly associated with percentage of retail product. The weight of retail cuts, a trait of economic importance, is related to the ribeye area (Taitet al., 2005). Last but not least, fat deposition,
espe-cially intramuscular fat, can interfere with meat tenderness perception (Crouseet al., 1989).
TheLEPgene encodes leptin, a 16-kDa protein pro-duced by adipocytes and implicated in food intake regula-tion, energy balance, reproduction efficiency and fat deposition (Houseknechtet al., 1998). Additionally, serum leptin has been correlated with fat deposition traits in cattle (Gearyet al., 2003), and LEPis likely associated to the
BM1500microsatellite, which is implicated in fat content of beef carcasses (Fitzsimmonset al., 1998). After Stoneet
al. (1996) mapped LEP to chromosome 4, many
poly-morphisms were described and associated with countless traits, from carcass fat content to fertility (Pomp et al.,
1997; Buchanan et al., 2002; Barendse et al., 2005;
Schenkelet al., 2005; Van Der Lendeet al., 2005). TheTGgene encodes thyroglobulin, the precursor of triiodothyronine and tetraiodothyronine, signals for fat cells development (Ailhaudet al., 1992; Darimontet al., 1993). Subcutaneous fat thickness and fat percentage of
tis-www.sbg.org.br
Send correspondence to Marina Rufino Salinas Fortes. Faculdade de Medicina Veterinária e Zootecnia, Departamento de Repro-dução Animal, Universidade de São Paulo, Av. Prof. Dr. Orlando Marques de Paiva 87, 05508-000 São Paulo, SP, Brazil. E-mail: marinafortes@usp.br.
sues in general, including milk, are expected to be
influ-enced byTG polymorphisms because the iodothyronines
affect adipocyte differentiation and the thyroid hormone levels influence milk fat percentage (Folley and Malpress, 1948). Attempts to associateTGmarkers and marbling or other fat deposition traits have been previously made, and
TGpolymorphisms are included in commercial panels (Ba-rendse, 1999; Barendse et al., 2004; Casas et al., 2005; Rinckeret al., 2006; Van Eenennaamet al., 2007).
Many association studies support the diacylglycerol O-acyltransferase 1 gene (DGTA1) as a marker for fat de-position traits (Thaller et al., 2003; Kühn et al., 2004; Tantiaet al., 2006).DGTA1encodes the catalyst enzyme of the reaction between diacylglycerol and acyl-CoA. This re-action is a final step in the synthesis of triglyceride, a major
fat component. So, the enzyme encoded byDGTA1
regu-lates the rate of triglycerides in adipocytes (Coleman and Bell, 1976) and has been implicated in energy homeostasis
(Havel, 2001). In addition,DGTA1maps to chromosome
14, whereTGis located, which is bodily related to the DNA marbling score marker CSSM66 (Barendseet al., 1997).
In spite of the support from the literature for selecting the candidate genes mentioned above, some conflicting re-ports show no association of these genes with fat deposition traits (Rinckeret al., 2006). Also, most studies were con-ducted withBos tauruscattle. Thus, the segregation and the
predictive value of theLEP, TG, and DGAT1
polymor-phisms for fat deposition and meat quality traits were yet to be analyzed inBos indicus(Nelore breed and Nelore cross-breed cattle).
The objectives of the present study were to estimate the allele and genotype frequencies of single nucleotide
polymorphisms (SNP) of theLEP,TGandDGAT1genes
and to associate genotypes with backfat thickness, total lipids (objective intramuscular fat deposition), marbling (subjective intramuscular fat deposition), ribeye area and shear force. The polymorphisms selected for the study were
LEP/Kpn2I (Buchanan et al., 2002),TG/PsuI (Thaller et al., 2003) andDGAT1/CfrI (Winteret al., 2002).
Material and Methods
Animals
The study included carcasses of Nelore breed and of crosses that use Nelore as a formation breed, consisting on five different genetic groups. The genetic groups were
clas-sified as follows: 46 animals were Nelore - N - (Bos
indicus), 41 Canchim - C - (5/8 Bos taurus + 3/8 Bos indicus), 19 Brangus Three-way cross - B3x - (9/16Bos taurus+ 7/16Bos indicus), and 15 Braunvieh Three-way cross - BV3x - (3/4Bos taurus+ 1/4Bos indicus). These an-imals were from the experimental feedlot facility of the De-partment of Genetics and Animal Nutrition - FMVZ, Botucatu, SP, Brazil. These cattle were sampled from four different farms, and the production system used in the
uni-versity facility has been previously described in detail (Curi
et al., 2005). Additional 26 Rubia Gallega X Nellore cross-bred - RGxN - (1/2Bos taurus+ 1/2Bos indicus) were sam-pled from a semi-intensive system. All animals were slaughtered within the age gap of 15 to 19 months.
After humanitarian slaughter, performed in a support-ive abattoir, carcasses were identified and cooled for 24 h, following which 2.50 cm-thick samples/steaks were re-moved from thelongissimus dorsimuscle, between the 12th and the 13thribs. The ribeye area (REA), also referred to as
longissimus dorsiarea, was measured at the abattoir by the quadrant methodology described in the USDA Quality Grade (USDA, 1989). The steaks were vacuum-packaged and aged at 1 to 2 °C until 14 dayspostmortemand then frozen until the further analyses were carried out.
Fat deposition and meat quality traits
Further phenotypic analyses such as backfat thick-ness (BT), total lipids (TL), marbling score (MS), and shear force (SF) measurements were performed at the Chemistry and Biochemistry Department of the Institute of Biosci-ences of the São Paulo State University (UNESP, Botucatu, SP, Brazil), as described below.
Backfat thickness was measured with a caliper, fol-lowing the methodology described in the USDA Quality Grade (USDA,1989). Marbling score was visually assessed (subjective scores from 1 to 5), according to the methodol-ogy described by the Aus-Meat Ltd (2001). Total lipids were evaluated using the method of Bligh and Dyer (1959). In short, six to eight cores of one inch x inch of meat were removed from the central area of eachlongissimus dorsi
steak, carefully avoiding visible fat tissue. As mentioned above, the steaks used for this sampling were removed from the area between the 12thand the 13thribs and were 2.54 cm thick. Then, the cores were minced and homogenized, be-fore weighing the 5 g used for lipids assessment. Chloro-form and methanol were added to the 5 g samples and rocked for over 30 min, for lipid extraction. Then, the sam-ples were centrifuged to separate three phases: hydrophilic (disposed), solid (disposed), and hydrophobic solution (used for volumetric measurements). Five milliliters of the hydrophobic phase were transferred to a previously weighed 50 mL beaker flask and let to dry overnight. The lipid content was calculated by the weight difference of the beaker. The lipid assessment of each animal was done in duplicate, and the final value is the mean of both results. Shear force was determined according to Wheeleret al.
Warner-Bratzler shear force measurement equipment (speed of 20 cm/min, with a 25 kg capacity).
DNA extraction and genotyping
After powdering meat samples with liquid nitrogen, DNA extraction was performed by digestion with protease K and precipitation with NaCl and alcohol, a non-phenolic method (Sambrook et al., 1989). After extraction, each DNA solution was checked for quantity and integrity by agarose gel electrophoresis, then diluted to work concentra-tion (10 ng/m) and stored at -20 °C until genotyping.
The animals were genotyped for the LEP, TG and
DGAT1genes by using the polymerase chain reaction - re-striction length polymorphism (PCR-RFLP) technique.
Al-leles C and T of the LEP gene were determined by the
amplification of a 94 bp fragment in exon 2, followed by di-gestion withKpn2I, as reported by Buchananet al.(2002). For the determination of allelesCandTof theTGgene, a 548 bp fragment located at the 5’ untranslated region was amplified and digested with thePsuI restriction enzyme, as described by Thalleret al.(2003). AllelesAandKof the
DGAT1 gene were identified by the amplification of a 411 bp sequence corresponding to a fragment of exon 8, followed by digestion withCfrI, as reported by Lacorteet al.(2006).
After digestion of the amplifiedLEP, TGandDGAT1
gene products, the DNA fragments were separated, respec-tively, on 3.5, 2 and 2% agarose gels in a horizontal electro-phoresis system. A standard molecular weight of 100 bp was applied onto each gel, next to the amplified and di-gested DNA fragments, so their size could be estimated. Ethidium bromide staining and exposure to ultraviolet light were used to visualize the DNA fragments in the gel. Using a digital documentation system, the gels were photo-graphed for ulterior data analyses. Individual genotypes were determined for each polymorphism by analyzing the size (in bp) of the fragments.
Statistical analysis
Genotype and allele frequencies were calculated for each polymorphism according to Weir (1990). Differences in allele frequencies of the polymorphisms within and be-tween genetic groups were determined by the method of Goodman adapted by Curi and Moraes (1981).
The traits of interest were analyzed by least square analysis of variance (p = 0.05), using the General Linear Model (GLM) procedure of the SAS program (SAS Insti-tute Inc, 2004). The linear model used to fit the quantitative variables included, in addition to the genotype effect, the interaction between genetic groups and contemporary groups, as follows:Yijk = m+ Gi + GGCj + eijk, where
Yijk= production trait,m= overall mean, Gi= fixed effect of theithgenotype (i= 1,.., 3), GGCj= fixed effect of thejth
genetic group and contemporary group combined (j= 1,..., 9), andeijk= random error. The criteria for the
contempo-rary groups included variations of sex, age at slaughter, feedlot and farm of origin. Animals with the same age, feedlot and farm of origin were slaughtered on the same day. In other words, the interaction between genetic and contemporary groups resulted in 9 subgroups, as follow: Canchim FE, Canchim MF, Nelore MA, Nelore MB, Ne-lore MD, Rubia Galega x NeNe-lore FC, Rubia Galega x Nelore MC, Brangus Three-way cross, and Braunvieh Three-way cross MF. In these subgroups, the first letter represents the sex of the animals (F = female, M = male) and the second letter designates the day of slaughter (A,..., F). The least square means for genotypes and genetic sub-groups were established and compared using the Tukey test. Genotypes with very low frequency (less than 0.10) in the total sample of individuals or genetic groups showing a single genotype were not included in the analysis, in order to prevent unreliable results. For the same reason, when most of the animals (over 80%) of one genotype belonged to the same genetic group, this genotype was entirely ex-cluded from the analyses. The sire effect was not inex-cluded in the linear model because the number of genotyped ani-mals which were progenies of the same sire was very small. So, the possibility of confounding the influence of the ge-notype effect and of the sire effect on production traits was low because of the large number of small half-sib families.
Results
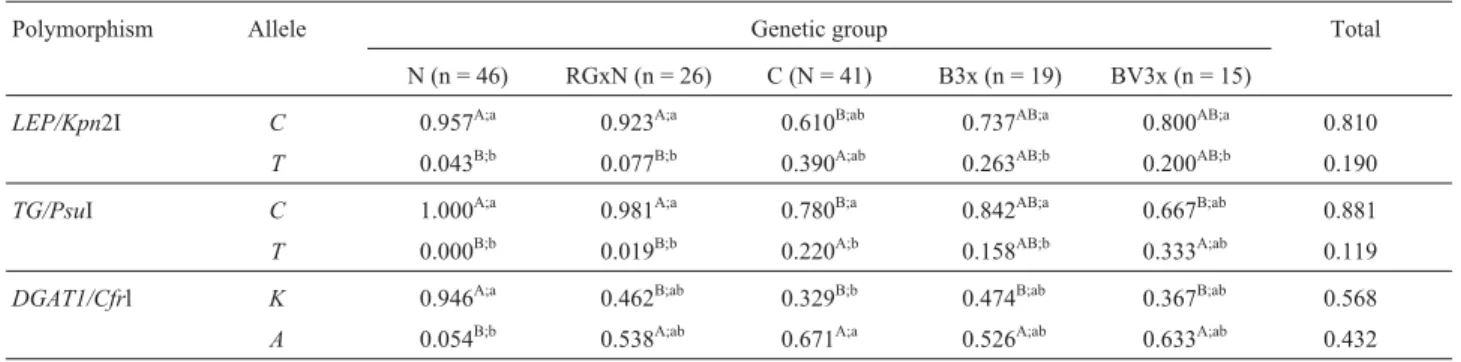
The allele and genotype frequencies of all three polymorphisms in each genetic group and in the sample as a whole are summarized in Tables 1 and 2, respectively.
The two allelic forms ofLEP(CandT) were observed in all five genetic groups. Two restriction fragments of 75 and 19 bp, respectively, were seen when theCCgenotype was present, and theTTgenotype was reported from the ob-servation of a 94 bp fragment. Heterozygotes presented all three fragment sizes: 94, 75 and 19 bp. The genetic groups with higherBos indicusinfluence (Nelore and Rubia Gal-lega X Nelore) presented a much lower frequency of allele
T(4.3 and 7.7%, respectively) and no animal with genotype
TT. The two Three-way crosses presented similar T fre-quencies (20 to 26.3%) and were different from the Can-chim breed (39%).
ForTG, two allelic variants were reported:C(295 and 178 bp restriction fragments) and T (intact PCR product 473 bp fragment).TGallelesCandTwere segregating in most genetic groups, but alleleCwas fixed in the Nelore animals, resulting in the occurrence of only theCC geno-type. Rubia Gallega X Nelore presented a very low
fre-quency of T (1.9%), with no statistically significant
TheDGAT1alleles (KandA) segregated in all ge-netic groups.When only alleleKwas present, the fragment identified was like the intact PCR product, with 411 pb in size. When only the alanine-bearing allele was present, two fragments were observed (208 and 203 pb, respectively). Heterozygous individuals were determined by the presence of fragments of three sizes: 411, 208 and 203 bp, respec-tively. In contrast, alleleAwas less frequent in the Nelore breed, with a presence of only 5.4%, compared to a range of 53 to 67% in the other four genetic groups.
The least square means and standard errors of quanti-tative meat traits for the different subgroups are shown in Table 3. A subgroup effect was found for all meat traits: backfat thickness (p = 0.0022), total lipids (p = 0.0002), ribeye area (p < 0.0001), and shear force (p < 0.0001).
The least square means and standard errors of quanti-tative meat traits for the different genotypes of polymor-phismsDGAT1/CfrlTG/PsuI andLEP/Kpn2I are shown in Table 4. GenotypesCCandCTwere analyzed for an asso-ciation withLEP/Kpn2I, but no significance was found for any of the traits: backfat thickness (p = 0.1038), total lipids (p = 0.6298), ribeye area (p = 0.3355) and shear force
(p = 0.9189). To characterize the effects ofTG/PsuI,
geno-types CC and CT were tested. No effect was found for
TG/PsuI on backfat thickness (p = 0.7101), total lipids (p = 0.2813), ribeye area (p = 0.8044) or shear force (p = 0.4361). For the analysis of polymorphism
DGAT1/Cfrl, only genotypesAAandAKwere considered, and no significant effect was found regarding an associa-tion with backfat thickness (p = 0.5244), total lipids (p = 0.6293), ribeye area (p = 0.8235) or shear force (p = 0.2124).
The visual assessment of marbling revealed to be in-effective for the Nelore orBos indicuscrosses subgroups studied because of its very low variability, shown by the fact that most animals scored 1 and only few individuals scored 2. So, no association tests were made for this trait.
Discussion
In 1997, Pompet al.(1997) found an RFLP marker in theLEPgene using the enzymeSau3AI that segregates in numerousBos taurusbreeds but was fixed in Brahman cat-tle (Bos indicus), which made segregation and association studies in this case impossible. Buchananet al.(2002) used Table 1- Allele frequencies ofLEP, TGandDGTA1polymorphisms in five bovine genetic groups and in the sample as a whole.
Polymorphism Allele Genetic group Total
N (n = 46) RGxN (n = 26) C (N = 41) B3x (n = 19) BV3x (n = 15)
LEP/Kpn2I C 0.957A;a 0.923A;a 0.610B;ab 0.737AB;a 0.800AB;a 0.810
T 0.043B;b 0.077B;b 0.390A;ab 0.263AB;b 0.200AB;b 0.190 TG/PsuI C 1.000A;a 0.981A;a 0.780B;a 0.842AB;a 0.667B;ab 0.881
T 0.000B;b 0.019B;b 0.220A;b 0.158AB;b 0.333A;ab 0.119
DGAT1/Cfrl K 0.946A;a 0.462B;ab 0.329B;b 0.474B;ab 0.367B;ab 0.568 A 0.054B;b 0.538A;ab 0.671A;a 0.526A;ab 0.633A;ab 0.432
N = Nelore; RGxN = Rubia Gallega X Nelore; C = Canchim; B3x = Brangus Three-way cross; BV3x = Braunvieh Three-way cross.
A, B
= Different allele frequencies between genetic groups (p < 0.05).
a, b =
Different allele frequencies within genetic groups (p < 0.05).
Table 2- Genotype frequencies of theLEP, TGandDGTA1gene polymorphisms obtained for five genetic groups and in the sample as a whole.
Polymorphism Genotype Genetic group Total N (n = 46) RGxN (n = 26) C (N = 41) B3x (n = 19) BV3x (N = 15)
LEP/Kpn2I CC 0.913 0.846 0.415 0.526 0.667 0.687
CT 0.087 0.154 0.390 0.421 0.267 0.245
TT 0.000 0.000 0.195 0.053 0.067 0.068
TG/PsuI CC 1.000 0.962 0.610 0.648 0.467 0.789
CT 0.000 0.038 0.341 0.316 0.400 0.184
TT 0.000 0.000 0.049 0.000 0.133 0.027
DGAT1/Cfrl KK 0.913 0.077 0.073 0.067 0.158 0.347
KA 0.065 0.769 0.512 0.632 0.600 0.442
AA 0.022 0.154 0.415 0.211 0.333 0.211
the enzymeKpn2I to assess a substitution of cytosine (C) for thymine (T) at exon 2 of theLEPgene (AF120500), as-sumed to cause an arginine to cysteine exchange, in Angus Hereford and Charolais breeds (Bos taurus). The overall al-lele frequency for theLEPgene polymorphism reported by these authors was 54% (C) and 46% (T), figures that seemed different from the 81% (C) and 19% (T) frequen-cies found in the present study. A difference betweenBos taurusanimals andBos indicusorBos indicuscrosses was actually expected. In fact, even withinBos tauruscattle the allele frequencies may be distinct in British (higherT fre-quency) and in continental breeds (higherC occurrence) (Buchananet al., 2002).
Leptin polymorphisms have been associated with many characteristics of economic importance for livestock, including feed intake, milk yield, and carcass traits (Van der Lende et al., 2005). A study on Bos taurus(Angus, Charolais, Limousin and Simmental) found an association between two leptin exon 2 polymorphisms and lean yield (Schenkelet al., 2005). InBos taurusanimals, average fat and grade fat were shown to be affected by the genotype, and animals homozygous for alleleTproduced more leptin
mRNA than those homozygous for alleleC(Buchananet
al., 2002), but no similar correlations with other fat deposi-tion traits (backfat thickness and total lipids) were found in
Bos indicusandBos indicuscrosses (present data). The re-sults presented here are consistent with the association study that genotyped 3129 individuals, including manyBos taurusbreeds and 317Bos indicus(Brahman) animals, con-ducted by Barendseet al.(2005), who found no association betweenLEP/Kpn2I and marbling, backfat thickness, intra-muscular fat and adjusted total fat. In the present study, no correlation was found for REA andLEP, although Gearyet
al. (2003) found a negative correlation between the
longissimus dorsiarea and serum leptin, and moreover the serum concentrations of leptin were significantly associ-ated with carcass composition (marbling, backfat thickness and kidney, pelvic and heart fat) and quality grade, in cross-bred Bos taurus (1/2 Angus + 1/4 Charolais + 1/4 Tarentaise).
Polymorphism at the 5’ untranslated region of the
thyroglobulinTGgene was patented by Barendse (1999)
and is evaluated usingPsuI to distinguish allelesCandT
(Thalleret al., 2003). The results obtained in the present Table 3- Least square means and standard errors of the meat traits for each genetic group and subgroup.
Meat traits
Genetic group Subgroup BT (mm) TL (%) REA (cm2) SF (kg)
C F E 3.75±1.96AB 0.02
±0.009AB 62.51
±6.58C 3.68
±0.64BC
M F 3.69±1.55AB 0.02±0.014AB 79.98±9.46A 3.68±0.65BC N M A 4.55±0.9B 0.01
±0.003AB 64.90
±4.99C 4.55
±1.28B
M B 4.60±1.42B 0.01±0.003AB 70.64±8.29BC 5.59±1.03A M D 3.66±1.50AB 0.02±0.011A 65.33±7.18C 3.77±0.62BC RGxN F C 2.69±1.31AB 0.01
±0.005B 61.69
±9.59C 3.57
±0.73BC
M C 2.25±0.63A 0.01±0.004AB 62.90±7.56C 3.83±1.27BC B3x M F 4.13±1.44B 0.02
±0.015AB 75.45
±7.29AB 2.98
±0.40C
BV3x M F 3.83±1.31AB 0.02±0.012AB 74.65±3.16AB 3.21±0.46C
BT = backfat thickness; TL = total lipids; REA = ribeye area, SF = shear force; N = Nelore; RGxN = Rubia Gallega X Nelore; C = Canchim; B3x = Bran-gus Three-way cross; BV3x = Braunvieh Three-way cross. The subgroups relate to contemporary criteria. F = female, M = male. A,..., F: slaughter days.
A, B ,C
= Differences among genetic subgroups within each meat trait (p < 0.05).
Table 4- Least square means and standard errors of the meat traits for genotypesLEP/Kpn2I,TG/PsuI andDGAT1/Cfrl
Meat traits
Locus Genotype BT (cm) TL REA (cm2) SF (kg) LEP/Kpn2I CC 3.42±1.50 0.016±0.012 67.61±9.72 3.68±0.87
CT 3.96±1.60 0.015±0.010 69.20±9.09 3.70±0.88
TG/PsuI CC 3.85±1.55 0.021±0.011 73.50±10.25 3.41±0.53
CT 4.00±1.63 0.017±0.013 73.05±8.25 3.30±0.79
DGAT1/Cfrl AA 3.19±1.76 0.017±0.012 69.76±10.39 3.64±0.75
AK 3.43±1.46 0.016±0.012 70.19±10.69 3.42±0.72
study show alleleTto be less frequent thanC. Similar fig-ures - 22 to 25%Tfrequency - have been reported before forBos taurusbreeds (Thalleret al., 2003; Mooreet al., 2003), and it is likely that the ranging for Canchim and both Three-way crosses is a little wider (15 to 33%), due to the genetic influence of Nelore. A lowT frequency was ex-pected forBos indicuscattle (Casaset al., 2005), but this is the first record in Nelore, in whichCis fixed. Many previ-ous studies have acknowledgedTG/PsuI effects on: mar-bling (Barendse, 1999), backfat thickness and ribeye area (Casaset al., 2005), intramuscular fat (Thalleret al., 2003), and percent of retail cuts and carcass weight EPDs (Rincker
et al., 2006). Moreover, Barendseet al.(2004) suggested thatTG/PsuI is a causative mutation within the marbling QTL and thatTis a favorable allele to intramuscular fat de-position. Yet, conflicting findings have been reported, and our results corroborate those which did not find any
associ-ation betweenTGpolymorphism and marbling or
tender-ness score in Bos indicus Brahman cattle (Casas et al., 2005) or marbling, intramuscular fat, ribeye area and fat thickness inBos taurusSimmental steers (Rinckeret al., 2006), or even backfat EBV inBos taurus(Mooreet al., 2003). ThyroglobulinCtoT variation is analyzed in the commercially available panel GeneSTAR Quality Grade (Genetic Solutions/Bovigen Pty. Ltd.), and the latest vali-dation study confirmed the presence of alleleTin an in-creasing number of carcasses graded Choice or Prime, although marbling was not associated with the marker (Van Eenennaamet al., 2007). In the present study, the low fre-quency of the favorable allele made it difficult to establish an association of the polymorphism with carcass traits be-cause of the small number of phenotypic data recorded for theTTgenotype (only 4 animals).
Winter et al. (2002) discovered the DGAT1/CfrI
polymorphism, which is a nonconservative substitution of
twoGCnucleotides byAAat positions 10433 and 10434
(AJ318490). This substitution imposes a protein substitu-tion of lysine by alanine (K232A), and these authors associ-ated the lysine allele with higher milk fat content, suggesting the polymorphism as a causative mutation of the QTL for milk fat content. This original study observed that theKvariant was more common in Jersey animals (about 80% frequency), Holstein-Friesian and Anatolian Black animals (about 35% frequency) than in otherBos taurus
beef breeds (less than 20% of the lysine form). Previous studies onBos indicusbeef breeds found them to have theK
allele fixed (Winteret al., 2002; Tantiaet al., 2006) or at very high frequency (Casas et al., 2005). Lacorte et al.
(2006) reported that allele K was fixed in Brazilian Bos indicusbreeds (Nelore and Guzerat). The novelty presented by our findings was the low frequency (5.4%) revealed for the occurrence of alleleAin pure Nelore animals. In this study, crossbreeds (Bos indicusXBos taurus) presented a 33 to 48% frequency of alleleK, a value that is intermediary between the figures found in the literature (Winteret al.,
2002; Mooreet al., 2003) forBos taurusbeef breeds and the results found in this study forBos indicus. The present findings, namely the lack of association between K and higher marbling or higher total lipids, are not consistent with literature statements that considerDGAT1/CfrI to be the causative polymorphism for fat deposition traits (Gri-sartet al., 2004). However, a discrepancy about the effects ofDGAT1in cattle with different genetic backgrounds is already known, once it is significant for intramuscular fat content in German Holstein but not in Charolais animals (Thaller et al., 2003). Our results are in agreement with those of Casaset al.(2005), who found no association be-tweenK232Aalleles and backfat thickness, marbling, ten-derness score or ribeye area in Brahman (Bos indicus) cattle. Kühnet al.(2004) reported a variable number of
tan-dem repeats (VNTR) located upstream ofDGAT1, which
has an effect on milk fat content even amongAA individu-als, further clarifying the BTA 14 QTL. It is possible that 5’ VNTRDGAT1contributes to fat deposition variability in
Bos indicusanimals.
According to Crouseet al.(1989), higher scores for tenderness are achieved in a sensory panel when intramus-cular fat content is over 5%. Previous reports showed asso-ciation of LEP with tenderness (Schenkel et al., 2005).
Thus, the effect of LEP, TG and DGAT1 gene
poly-morphisms on shear force (mechanical evaluation of ten-derness) was tested, but no association was found. Discrepancies among association studies may be related to different genetic backgrounds and variable epistatic effects and/or to environmental and management pressure on phenotypic data (Dekkers, 2004). The combined genetic-environmental component, here represented by the sub-groups, has an influence on all analyzed traits. Further-more, comparing the results obtained for the subgroups for each analyzed trait, it seems that subgroups within the same breed type tend to share similar results. In contrast, sub-groups from distinct breed types presented distinct results. Hence, while the genetic (or breed type) effect on meat traits continues to be of importance, the gene markers, which underpin this effect, are yet to be discovered forBos indicus-influenced cattle. In other words, the fixation (or very low frequency) of alleles inBos indicus(Nelore) and the lack of additive value shown by the present results for
these markers atLEP, TGandDGAT1encourage a search
for new markers. Adequate new marker panels should be developed specifically for Bos indicus cattle, to allow marker-assisted selection to be successful in Brazil.
Acknowledgments
References
Ailhaud G, Grimaldi P and Negrel R (1992) Cellular and molecu-lar aspects of adipose tissue development. Annu Rev Nutr 12:207-233.
meat Limited (2001) International Red Meat Manual. Aus-meat Limeted, Brisbane, 111 pp.
Barendse WJ (1999) Assessing lipid metabolism. Int Pat Appl WO99/23248. World International Property Organization, Geneva.
Barendse W, Vaiman D, Kemp SJ, Sugimoto Y, Armitage SM, Williams JL, Sun HS, Eggen A, Agaba M, Aleyasin SAet al.(1997) A medium-density genetic linkage map of the bo-vine genome. Mamm Genome 8:21-28.
Barendse WJ, Bunch R, Thomas M, Armitage S, Baud S and Donaldson N (2004) The TG5 thyroglobulin gene test for a marbling quantitative trait loci evaluated in feedlot cattle. Austr J Exp Agricult 44:669-674.
Barendse WJ, Bunch RJ and Harrison BE (2005) The leptin C73T missense mutation is not associated with marbling and fat-ness traits in a large gene mapping experiment in Australian cattle. Anim Genet 36:71-93.
Bligh EG and Dyer WJ (1959) A rapid method of total lipid ex-traction and purification. Can J Biochem Physiol 37:911-917.
Buchanan FC, Fitzsimmons CJ, Van Kessel AG, Thue TD, Win-kelman-Sim DC and Schmutz SM (2002) Association of a missense mutation in the bovine leptin gene with carcass fat content and leptin mRNA levels. Genet Sel Evol 34:105-116.
Casas E, White SN, Riley DG, Smith TPL, Brenneman RA, Olson TA, Johnson DD, Coleman SW, Bennett GL and Chase Jr CC (2005) Assessment of single nucleotide polymorphisms in genes residing on chromosomes 14 and 29 for association with carcass composition traits inBos indicuscattle. J Anim Sci 83:13-19.
Coleman R and Bell RM (1976) Triacylglycerol synthesis in iso-lated fat cells. Studies on the microsomal diacylglycerol acyltransferase. J Biol Chem 251:4537-4543.
Crouse JD, Cundiff LV, Koch RM, Koomaraie M and Seidman SC (1989) Comparisons ofBos indicusandBos taurus in-heritance for carcass beef characteristics and meat palatabil-ity. J Anim Sci 67:2661-2668.
Curi PR and Moraes RV (1981) Associação, homogeneidade e contrastes entre proporções em tabelas contendo distribui-ções multinomiais. Cienc Cult 33:712-722.
Curi RA, Oliveira HN, Gimenes MA, Silveira AC and Lopes CR (2005) Effects of CSN3 and LGB gene polymorphisms on production traits in beef cattle. Genet Mol Biol 28:262-266. Darimont C, Gaillard D, Ailhaud G and Negrel R (1993) Terminal
differentiation of mouse preadipocyte cells: Adipogenic and antimitogenic role of triiodothyronine. Mol Cell Endocrinol 98:67-73.
Dekkers JCM (2004) Commercial application of markers and gene-assisted selection in livestock: Strategies and lessons. J Anim Sci 82:313-328.
Fitzsimmons CJ, Schmutz SM, Bergen RD and McKinnon JJ (1998) A potential association between the BM 1500 micro-satellite and fat deposition in beef cattle. Mamm Genome 9:432-434.
Folley SJ and Malpress FH (1948) Hormonal control on mam-mary growth. In: Pincuss G and Thimamm KV (eds) The
Hormones. 1st edition. Academic Press, New York, pp 695-743.
Geary TW, McFadin EL, Macneil MD, Grings EE, Short RE, Funston RN and Keisler DH (2003) Leptin as a predictor of carcass composition in beef cattle. J Anim Sci 81:1-8. Grisart B, Farnir F, Karim L, Cambisano N, Kim J-J, Kvasz A,
Mni M, Simon P, Frère J-M, Coppieters W and Georges M (2004) Genetic and functional confirmation of the causality of theDGAT1 K232Aquantitative trait nucleotide in affect-ing milk yield and composition. Proc Natl Acad Sci USA 101:2398-2403.
Havel PJ (2001) Peripheral signals conveying metabolic informa-tion to the brain: Short-term and long-term regulainforma-tion of food intake and energy homeostasis. Exp Biol Med 226:963-977.
Houseknecht KL, Baile CA, Matteri RL and Spurlock ME (1998) The biology of leptin: A review. J Anim Sci 76:1405-1420. Killinger KM, Calkins CR, Umberger WJ, Feuz DM and Eskridge KM (2004) Consumer visual preference and value for beef steaks differing in marbling level and color. J Anim Sci 82:3288-3293.
Kühn C, Thaller G, Winter A, Bininda-Emonds ORP, Kaupe B, Erhardt G, Bennewitz J, Schwerin M and Fries R (2004) Ev-idence for multiple alleles at the DGAT1locus better ex-plains a quantitative trait locus with major effect on milk fat content in cattle. Genetics 167:1873-1881.
Lacorte GA, Machado MA, Martinez ML, Campos AL, Maciel RP, Verneque RS, Teodoro RL, Peixoto MGCD, Carvalho MRS and Fonseca CG (2006) DGAT1 K232A polymor-phism in Brazilian cattle breeds. Genet Mol Res 5:475-482. Moore SS, Li C, Basarab J, Snelling WM, Kneeland J, Murdoch
B, Hansen C and Benkel B (2003) Fine mapping of quantita-tive trait loci and assessment of positional candidate genes for backfat on bovine chromosome 14 in a commercial line ofBos taurus. J Anim Sci 81:1919-1925.
Pomp D, Zou T, Clutter AC and Barendse W (1997) Rapid com-munication: Mapping of leptin to bovine chromosome 4 by linkage analysis of a PCR-based polymorphism. J Anim Sci 75:1427.
Rincker CB, Pyatt NA, Berger LL and Faulkner DB (2006) Rela-tionship among GeneSTAR marbling marker, intramuscular fat deposition and expected progeny differences in early weaned Simmental steers. J Anim Sci 84:686-693. Sambrook J, Fritsch EF and Maniatis T (1989) Molecular
Clon-ing: A Laboratory Manual. Cold Spring Harbor Laboratory Press, New York, 540 pp.
SAS Institute Inc. (2004). SAS/STAT User’s Guide, v. 9.1. SAS Institute Inc, Cary.
Schenkel FS, Miller SP, Ye X, Moore SS, Nkrumah JD, Li C, Yu J, Mandell IB, Wilton JW and Williams JL (2005) Associa-tion of single nucleotide polymorphisms in the leptin gene with carcass and meat quality traits of beef cattle. J Anim Sci 83:2009-20.
Sillence MN (2004) Technologies for the control of fat and lean deposition in livestock. Vet J 167:242-257.
Stone RT, Kappes SM and Beattie CW (1996) The bovine homologue of the obese gene maps to chromosome 4. Mamm Genome 7:399-400.
beef cattle using ultrasound or carcass data. J Anim Sci 83:1353-1360.
Tantia MS, Vijh RK, Mishra BP, Mishra B, Bharani Kumar ST and Sodhi M (2006)DGAT1andABCG2polymorphism in Indian cattle (Bos indicus) and buffalo (Bubalus bubalis) breeds. Bio-Med Central Vet Res 2:e32.
Thaller G, Kuhn C, Winter A, Ewald G, Bellmann O, Wegner J, Zuhlke H and Fries R (2003)DGAT1, a new positional and functional candidate gene for intramuscular fat deposition in cattle. Anim Genet 34:354-357.
USDA (1989) United States Standards for Grades of Carcass Beef. Agric Marketing Service, Washington DC.
Van Der Lende T, Te Pas MF, Veerkamp RF and Leifers SC (2005) Leptin gene polymorphisms and their phenotypic as-sociations. Vitam Horm 71:373-404.
Van Eenennaam AL, Li J, Thallaman RM, Quaas RL, Dikeman ME, Gill CA, Franke DE and Thomas MG (2007)
Valida-tion of commercial DNA tests for quantitative beef quality traits. J Anim Sci 85:891-900.
Weir BS (1990) Genetic data analysis: Methods for discrete popu-lation genetic data. Sinauer Associates, Massachusetts, 377 pp.
Wheeler TL, Shakelford SD, Johnson LP, Miller MF, Miller RK and Koohmaraie M (1997) A comparison of Warner-Bratzler shear force assessment within and among institu-tions. J Anim Sci 75:2423-2432.
Winter A, Kramer W, Werner FA, Kollers S, Kata S, Durstewitz G, Buitkamp J, Womack JE, Thaller G and Fries R (2002) Association of a lysine-232/alanine polymorphism in a bo-vine gene encoding acyl-CoA: Diacylglycerol acyltrans-ferase (DGAT1) with variation at a quantitative trait locus for milk fat content. Proc Natl Acad Sci USA 99:9300-9305.
Associate Editor: Luiz Lehmann Coutinho