Vol.46, n. 4 : pp. 601-608, December 2003
ISSN 1516-8913 Printed in Brazil
BRAZILIAN ARCHIVES OF
BIOLOGY AND TECHNOLOGY
A N I N T E R N A T I O N A L J O U R N A L
Longissimus dorsi
Fatty Acids Composition of
Bos indicus
and
Bos indicus
x
Bos taurus
Crossbred Steers Finished in
Pasture
Ivanor Nunes do Prado
1*, Fernanda Barros Moreira, Makoto Matsushita and Nilson
Evelázio de Souza
Universidade Estadual de Maringá - UEM; [email protected]; Av. Colombo, 5790; Maringá - PR - Brazil
ABSTRACT
Studies were carried out to evaluate the fatty acids composition of Longissimus dorsi muscle, with or without fat thickness, of Bos indicus and Bos indicus x Bos taurus crossbred steers finished in millet (Pennisetum americanum L.) or star grass (Cynodon plectostachyus Pilger) pasture systems with mineral or mineral protein supplementation. Neither the treatment nor the genetic group had effect on meat fatty acids composition. The cut had effect on meat fatty acid composition. The meat without fat thickness had 11% of PUFA, 43% of MUFA and 45% of SFA. The meat with fat thickness had 5% of PUFA, 44% of MUFA and 50% of SFA. PUFA/SFA ratio was 0.10 and 0.25 and n-6/n-3 ratio was 0.80 and 1.27 for cuts with and without fat thickness.
Keywords:Bos indicus, Bos taurus, fatty acids, fat, meat, pasture
* Author for correspondence
INTRODUCTION
During the last decades, the number of people concerned on maintaining a healthy diet has increased. The consumption of fat has reduced as it has been related to human cardiovascular diseases, obesity and cancer (Jiménez-Colmenero et al., 2001). The result has been a search for products without fat or with low percentage, in order to guarantee a more healthy diet.
However, fat represents between 25 to 30% of the total body weight of an individual adult and develops important functions in the organism (Hegarty, 1995). So fat must be present in the diet, specially some polyunsaturated fatty acids, which, if not consumed in the necessary amount, may alter the perfect functioning of the organism, since they cannot be synthesised by it (Ewin, 1997).
The bovine meat fat presents approximately 48% of saturated fat and 52% of unsaturated fat. (Jiménez-Colmenero et al., 2001). Since saturated fatty acids are not essential and have been associated to health problems (Jiménez-Colmenero et al., 2001) bovine meat consumption may be prejudiced due to the search for healthier diets. According to this, many studies have been made in order to decrease the saturated fatty acids proportion and increase the polyunsaturated fatty acids of the meat.
French et al. (2000), in their work with steers of
was obtained in intramuscular fat of animals maintained only in pasture, without any concentrate supplementation. The PUFA increase due to the higher n-3 fatty acids concentration, as the n-6 derivatives were constant for the different treatments.
Once forage is rich in polyunsaturated fatty acids (French et al., 2000), steers fed only forages could result in a fat deposition with a higher amount of polyunsaturated fatty acids, which would led to a healthier aliment, with lower saturated fat contents. An increase in polyunsaturated fatty acids content can be obtained by the slaughter of animals with lower carcass fat deposition and fed with low energy levels (De Smet et al., 2000). The aim of this study was to evaluate bovine meat fatty acids composition of Bos indicus and Bos indicus x Bos taurus crossbred steers fed different
pastures, with mineral or protein mineral
supplementation.
MATERIALS AND METHODS
The experiment was carried out in a private farm located in Centenário do Sul, Paraná State, Brazil (22º51’south latitude, 51º33’longitude W-GR).
Seventeen steers were used, 7 Bos indicus (Nelore)
and 10 Bos indicus x Bos taurus crossbred
assigned to 3 finishing pasture systems: millet (Pennisetum americanum L.) + mineral salt
supplementation - MMS (1 ½ Nelore x ½ Limousin, 3 ½ Nelore x ½ Girolando and 2 Nelore); star grass (Cynodon plectostachyus
Pilger) + mineral salt supplementation - GMS (2 ½ Nelore x ½ Limousin, 1 ½ Nelore x ½ Girolando and 2 Nelore) and star grass + protein mineral salt supplementation - GPS (2 ½ Nelore x ½ Limousin, 1 ½ Nelore x ½ Girolando and 3 Nelore).
The animals were maintained for 70 days (1st
slaughter) or 83 days (2nd slaughter). The slaughter
occurred when the animals achieved approximately 450 kg (Nelore) or 470 kg (crossbred) of body weight. During grazing time, ten forage samples were collected from each pasture, each 28 days, and homogenised for each treatment for future analysis.
Before going to the slaugher house, the animals were submitted to 10-hour solids and liquids fasting. Shortly after the slaughter, the carcasses were identified and chilled for 24 h at 2oC. The
from the area between the 12th and 13th rib, and
then immediately taken to the laboratory and frozen for future analysis.
Two months later, these samples were thawed at ambient temperature and separated in two portions in order to analyse the fatty acids composition. All fat thickness was removed from one of the samples, and only the Longissimus dorsi muscle
had the amount of fatty acids analysed. The fat thickness of the other sample was maintained and analysed along with the muscle portion. These two cuts and the forage samples were ground and homogenised, the total fat matter was separated (Bligh and Dyer, 1959) and the lipids were transesterified to form fatty acids methyl esters (ISO, 1978).
The fatty acids were analysed on a Shimadzu 14A gas chromatograph equipped with flame ionisation detector and fused silica capillary column (25 cm x 0.25 mm and 0.20 µm of Carbowax 20M). The temperatures of the injector and detector were of 220 and 245ºC, respectively. The gas fluxes were
of: 1.2mL/minfor the carrier gas (H2), 30mL/min
for the make-up gas (N2); 300 mL/min and 30
mL/min for the flame gases, synthetic air and H2,
respectively. The split used was of 1/100. The peak areas were determined by the CG-300 Computing Integrator. The identification of the main peaks was made according to the patterns determined by Sigma (USA).
The statistical analysis was made using the Statistical and Genetic Analysis System (SAEG, 1983).
RESULTS AND DISCUSSION
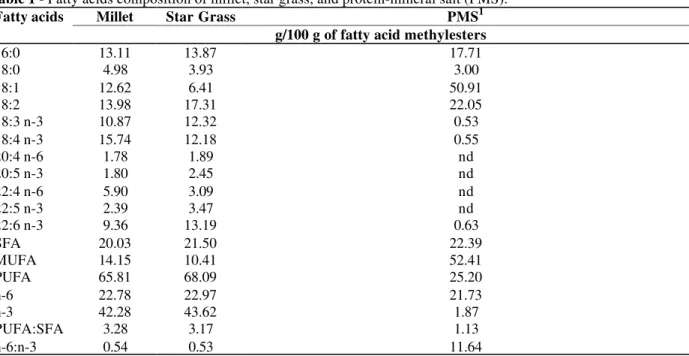
grass pasture) was higher than the values found for the protein mineral salt (25.20%).
The n-6:n-3 ratio was lower for forages (0.54) than for protein mineral salt (11.64). This occurred due to the high amount of forage fatty acids deposited in the n-3 form. French et al. (2000) also observed
a higher deposition of polyunsaturated fatty acids in forages, especially in the omega-3 form and a higher monounsaturated fatty acids deposition in concentrated aliments.
Diets with high PUFA levels could lead to an increase in these fatty acids in the meat. However, concerning ruminants, during the passage of fatty acids through the rumen, hydrogenation occurs, that is, hydrogen ions are added to the polyunsaturated fatty acids, mainly forming C18:0 and C18:1 acids (Tamminga and Doreau, 1991). In conclusion, the increase in PUFA in the diet will not have a direct relation to an increase in these fatty acids in the meat.
Table 1 - Fatty acids composition of millet, star grass, and protein-mineral salt (PMS). Millet Star Grass PMS1 Fatty acids
g/100 g of fatty acid methylesters
16:0 13.11 13.87 17.71
18:0 4.98 3.93 3.00
18:1 12.62 6.41 50.91
18:2 13.98 17.31 22.05
18:3 n-3 10.87 12.32 0.53
18:4 n-3 15.74 12.18 0.55
20:4 n-6 1.78 1.89 nd
20:5 n-3 1.80 2.45 nd
22:4 n-6 5.90 3.09 nd
22:5 n-3 2.39 3.47 nd
22:6 n-3 9.36 13.19 0.63
SFA 20.03 21.50 22.39
MUFA 14.15 10.41 52.41
PUFA 65.81 68.09 25.20
n-6 22.78 22.97 21.73
n-3 42.28 43.62 1.87
PUFA:SFA 3.28 3.17 1.13
n-6:n-3 0.54 0.53 11.64
1soybean meal, cracked corn, urea and mineral premix; nd - not detected
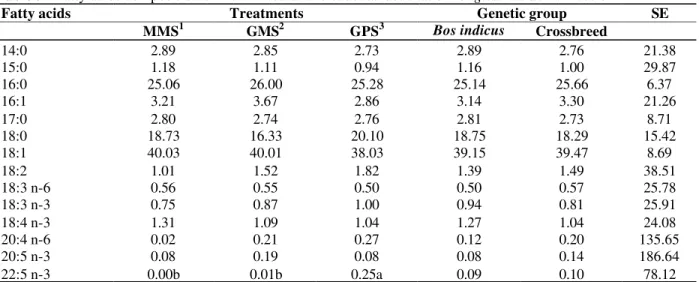
Differences on intramuscular fatty acids composition were not observed between treatments (MMS, GMS and GPS) neither between genetic groups (Bos indicus or Bos indicus x Bos taurus crossbred) (Table 2). The majority of the
fatty acids were in the C18:1 (oleic acid), C16:0 (palmitic acid) and C18:0 (stearic) form.
Despite the difference observed on fatty acids composition of protein mineral salt compared to forages (Table 1), a difference on meat fatty acids composition was not observed (Tables 2 and 3). This was a result of the low protein and mineral supplement consumption (200g/animal/day). So, the main component of the diet was the forage, and not the supplement.
French et al. (2000), analysing Bos taurus steers,
observed a similar proportion of C16:0 and C18:0
acids, with values of 23% and 15%, respectively. Similar results were observed by Silva (2001) in heifers (½ Bos indicus x ½ Bos taurus), finished in
confinement with diets made up of corn and yeast or cassava hull and cottonseed meal. Enser et al.
(1998) observed similar fatty acids proportion in steers finished in pasture, with values of 24% and 16% for the palmitic and stearic acids, respectively. Literature data are heterogeneous when mentioning the oleic acid (C18:1), inferior values are observed: 36% (Enser et al., 1998) and
Table 2 - Intramuscular fatty acids composition of Longissimus dorsi muscle
Fatty acids Treatments Genetic group SE MMS1 GMS2 GPS3 Bos indicus Crossbreed
14:0 2.01 2.15 2.06 2.12 2.03 20.41
15:0 0.57 0.67 0.50 0.63 0.52 39.98
16:0 23.24 24.28 24.24 23.15 24.57 8.45
16:1 2.93 2.90 2.59 2.91 2.70 20.19
17:0 2.38 2.42 2.31 2.59 2.17 21.38
18:0 15.76 15.77 17.31 16.44 16.19 12.52
18:1 39.59 40.03 38.10 38.55 39.76 6.19
18:2 3.99 3.57 4.05 3.74 4.02 29.14
18:3 n-6 0.51 0.55 0.47 0.59 0.44 37.10
18:3 n-3 1.94 1.33 1.52 1.74 1.50 24.81
18:4 n-3 0.96 0.85 1.08 1.19 0.78 59.50
20:4 n-6 1.31 1.17 1.32 1.25 1.29 48.63
20:5 n-3 0.72 0.51 0.62 0.62 0.62 36.48
22:5 n-3 1.05 0.84 0.83 0.96 0.87 65.81
22:6 n-3 0.07 0.00 0.06 0.07 0.02 210.99
1Millet with mineral supplementation; 2Star grass with mineral supplementation; 3Star grass with protein and mineral
supplementation.
Table 3 - Fatty acids composition of intramuscular and subcutaneous fat of Longissimus dorsi muscle
Fatty acids Treatments Genetic group SE MMS1 GMS2 GPS3 Bos indicus Crossbreed
14:0 2.89 2.85 2.73 2.89 2.76 21.38
15:0 1.18 1.11 0.94 1.16 1.00 29.87
16:0 25.06 26.00 25.28 25.14 25.66 6.37
16:1 3.21 3.67 2.86 3.14 3.30 21.26
17:0 2.80 2.74 2.76 2.81 2.73 8.71
18:0 18.73 16.33 20.10 18.75 18.29 15.42
18:1 40.03 40.01 38.03 39.15 39.47 8.69
18:2 1.01 1.52 1.82 1.39 1.49 38.51
18:3 n-6 0.56 0.55 0.50 0.50 0.57 25.78
18:3 n-3 0.75 0.87 1.00 0.94 0.81 25.91
18:4 n-3 1.31 1.09 1.04 1.27 1.04 24.08
20:4 n-6 0.02 0.21 0.27 0.12 0.20 135.65
20:5 n-3 0.08 0.19 0.08 0.08 0.14 186.64
22:5 n-3 0.00b 0.01b 0.25a 0.09 0.10 78.12
1Millet with mineral supplementation; 2Star grass with mineral supplementation; 3Star grass with protein and mineral
supplementation; 4Means in the same line followed by different letters are different by the Tukey test (P<0.05).
Once ruminant diet presents low fat concentration, the majority of the adipose tissue is formed by the synthesis of the fatty acids by the animal metabolism. Fatty acids were elongated until C18:0 and, by dessaturation, were converted into C18:1 (Rule et al., 1997). As the adipose tissue formed increased, a higher deposition of oleic acid will occur. This explain the differences observed in literature about the C18:1 proportion in meat fat. Carcasses with lower fat
acids proportion and lower oleic acid deposition (Rule et al., 1997).
Oleic acid increases the HDL-cholesterol concentration and decreases the LDL concentration (Katan et al., 1994). As only LDL is related to cardiovascular problems, higher oleic acid concentration will not have a negative effect on human health.
groups (Bos indicus or crossbreed), except for
C22:5 n-3, which was higher for animals offered protein mineral salt as a complement. The cuts with fat thickness presented a higher proportion of fatty acids in the C18:1, C16:0 and C18:0 forms (Table 3).
Mitchell et al. (1998) also observed a higher
proportion of these fatty acids in fat thickness of animals maintained in pasture, with values of 47, 23 and 12% for oleic, palmitic and stearic acids, respectively. Similar results were achieved by Silva (2001) for cuts with fat thickness of heifers finished in confinement, with values of 40, 27 and 16% for oleic, palmitic and stearic acids, respectively.
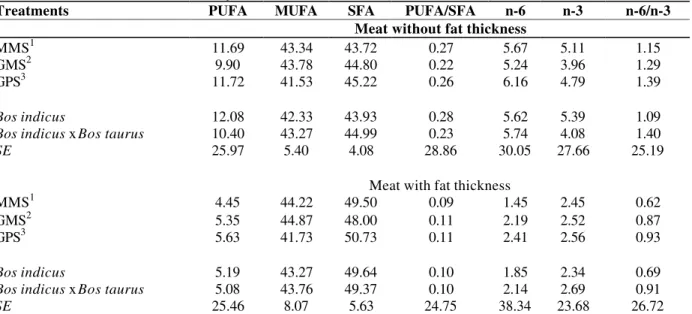
The PUFA, MUFA, SFA, n-6 and n-3 proportions of meat without fat thickness did not differ between treatment or genetic group (Table 4). The average PUFA content was of 11%. Inferior values were obtained by French et al. (2000) (5.35%) and
superior values were obtained by Mitchell et al.
(1991) (16.7%) of PUFA. These authors worked with castrated animals maintained exclusively in pasture. The average SFA proportion was of 45%; similar to the value obtained by Mitchell et al.
(1991). The average PUFA: SFA ratio was of 0.25. Mitchell et al. (1991) obtained a value of 0.40 and
French et al. (2000) obtained a value of 0.13.
These differences found in literature can be a result of the type of forage used, breed or finishing score of the animals. Significant differences on forage fatty acids composition of species used in this experiment were not found, however, only tropical species were tested and no data in literature was found comparing tropical and temperate species.
French et al. (2000) observed a higher PUFA:SFA
ratio for the animals maintained exclusively in pasture than for the animals concentrate-fed. However, Enser et al. (1998), observed a higher
PUFA/SFA ratio for animals that were grain-fed. These differences can be explained, once Enser et al. (1998) worked with animals of different
finishing scores, using non-castrated animals for the grain treatment and castrated animals for the forage treatment. Castrated animals presented higher intramuscular fat deposition than non-castrated animals (2.9 vs. 2.0%). It is known that as the amount of carcass fat increases, the triacylglycerols proportion increases in relation to the phospholipids and, the triacylglycerols are responsible for the high fat saturation of ruminants (De Smet et al., 2000).
Table 4 - Percentage of: polyunsaturated fatty acids (PUFA), monounsaturated fatty acids (MUFA), saturated fatty
acids (SFA), n-6 and n-3 fatty acids, PUFA/SFA and n-6/n-3 ratios in cuts evaluated
Treatments PUFA MUFA SFA PUFA/SFA n-6 n-3 n-6/n-3 Meat without fat thickness
MMS1 11.69 43.34 43.72 0.27 5.67 5.11 1.15
GMS2 9.90 43.78 44.80 0.22 5.24 3.96 1.29
GPS3 11.72 41.53 45.22 0.26 6.16 4.79 1.39
Bos indicus 12.08 42.33 43.93 0.28 5.62 5.39 1.09
Bos indicus x Bos taurus 10.40 43.27 44.99 0.23 5.74 4.08 1.40
SE 25.97 5.40 4.08 28.86 30.05 27.66 25.19
Meat with fat thickness
MMS1 4.45 44.22 49.50 0.09 1.45 2.45 0.62
GMS2 5.35 44.87 48.00 0.11 2.19 2.52 0.87
GPS3 5.63 41.73 50.73 0.11 2.41 2.56 0.93
Bos indicus 5.19 43.27 49.64 0.10 1.85 2.34 0.69
Bos indicus x Bos taurus 5.08 43.76 49.37 0.10 2.14 2.69 0.91
SE 25.46 8.07 5.63 24.75 38.34 23.68 26.72
1Millet with mineral supplementation; 2Star grass with mineral supplementation; 3Star grass with protein and mineral
Therefore, comparing to this experiment, the lower PUFA:SFA ratio found by French et al. (2000)
could be a result of the higher intramuscular fat proportion, since the values were 40 g/100 g of muscle and, in this experiment, the average intramuscular fat proportion was of 1.56 g/100 g of muscle (Table 6).
The omega-6 fatty acid deposition was close to the omega-3 deposition (Table 4). Therefore, the n-6:n-3 ratio was close to 1. Similar values were obtained by Enser et al. (1998) with values of 1.32
for animals maintained in pasture.
The linoleic (n-6) and the linolenic (n-3) acids develop vital functions in organism and, since the animal or human cannot synthesise them, they need to be supplemented by diet. These acids are converted in intermediate metabolites in order to develop their functions. However, for some metabolic passages of the n-6 and n-3 derivatives, some of the utilised enzymes are the same, so that the excess of n-6 derivative may lead to a
deficiency of n-3 derivatives (Ewin, 1997). In this context, it has been advised that the n-6:n-3 ratio must be around 4-10:1 (Krummel, 1998). In spite of the importance of these fatty acids for the human health, an exact relation has not been established yet (Hu, 2001).
When comparing fatty acids proportion of the cuts with or without fat thickness, it is possible to observe that intramuscular fat presents a higher polyunsaturated fatty acids proportion and a lower saturated fatty acids proportion, which results on a higher PUFA:SFA ratio for the cut without fat thickness (Table 5) The higher PUFA:SFA ratio for the intramuscular fat was also obtained by Webb et al. (1998). Intramuscular fat is formed by
marbling fat and lipids present in the cellular membrane. The cellular membrane is basically made up of phospholipids. Subcutaneous fat is made up of adipose tissue, and its main energy source is in the triacylglycerols form.
Table 5 - Percentage of polyunsaturated fatty acids (PUFA), monounsaturated fatty acids (MUFA), saturated fatty acids (SFA), n-6 and n-3 fatty acids, PUFA/SFA and n-6/n-3 ratios in cuts evaluated
Cuts PUFA MUFA SFA PUFA/SFA n-6 n-3 n-6/n-3
Meat without fat thickness 10.94a 42.83 44.83b 0.25a 5.60a 4.56a 1.27a Meat with fat thickness 5.13b 43.53 49.49a 0.10b 2.00b 2.51b 0.80b
SE 27.00 6.93 5.43 30.61 32.41 30.28 28.51
Means in the same column followed by different letters are different by the Tukey test (P<0.05).
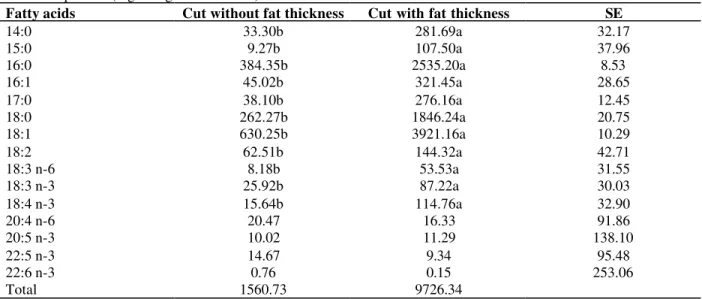
Table 6 - Fatty acids concentration of Longissimus dorsi muscle, with or without fat thickness, of steers finished in
pasture (mg/100 g of fresh meat)
Fatty acids Cut without fat thickness Cut with fat thickness SE
14:0 33.30b 281.69a 32.17
15:0 9.27b 107.50a 37.96
16:0 384.35b 2535.20a 8.53
16:1 45.02b 321.45a 28.65
17:0 38.10b 276.16a 12.45
18:0 262.27b 1846.24a 20.75
18:1 630.25b 3921.16a 10.29
18:2 62.51b 144.32a 42.71
18:3 n-6 8.18b 53.53a 31.55
18:3 n-3 25.92b 87.22a 30.03
18:4 n-3 15.64b 114.76a 32.90
20:4 n-6 20.47 16.33 91.86
20:5 n-3 10.02 11.29 138.10
22:5 n-3 14.67 9.34 95.48
22:6 n-3 0.76 0.15 253.06
Total 1560.73 9726.34
Once the saturation degree of triacylglycerols is higher than phospolipids (De Smet et al., 2000),
the adipose tissue will have the higher saturated fatty acids proportion, which explains the results that were obtained in this experiment.
By analysing the cuts with or without fat thickness, a higher proportion of n-6 and n-3 fatty acids can be observed for the cut without fat thickness. Since n-6 and n-3 are polyunsaturated fatty acids, the factor described above can be the reason of the higher n-6 and n-3 fatty acids proportion in intramuscular fat.
Table 6 shows fatty acids concentrations of cuts with or without fat thickness, in natural form, shortly after thawing. The cut with fat thickness presented a higher concentration of almost all fatty acids, which was a result of difference of fat proportion in the cut (1561 mg/g of meat and 9726 mg/g of meat for cuts without or with fat thickness) and also a result of difference of fatty acids proportion in the cut (Table 5)
Fatty acids composition can alter the flavour and the aroma of the meat. The flavour is positively related to the oleic acid, while the linolenic acid is negatively related to the flavour and aroma of the meat (Mandell et al., 1998). The oleic:linolenic
acid ratio was of 18.48 for the meat without fat thickness and 27.86 for the meat with fat thickness, which explained why most of consumers have a preference for meat with fat thickness.
The recommended daily fat ingestion value is a maximum of 30% of the diet calories, of which 10% can be saturated, 10% monounsaturated and 10% polyunsaturated (Krummel, 1998).
Analysing a diet of 2500 calories per day, the calorie consumption from 100 g of Longissimus dorsi muscle in natura without fat thickness,
would be of 6.3; 6.08; and 1.42, in its saturated, monounsaturated and polyunsaturated forms, respectively, since one gram of fat is equivalent to nine calories. The consumption of calories from 100 g of Longissimus dorsi muscle in natura, with
fat thickness would be of 45.42; 38.19 and 3.93 in the saturated, monounsaturated and polyunsaturated form, respectively. These values were inferior to the maximum values recommended for a person of normal weight and physically active, especially for the meat without fat thickness, which allows us to affirm that moderate consumption of bovine meat was not responsible for obesity problems.
There is not an established nutritional recommendation of omega-6 and omega-3 acids; however, the daily need of linolenic acid has been estimated between 2 to 7 g/day and the daily need of omega-3 acids has been estimated between 1.1 to 1.5 g/day. An ingestion of 100 g of fresh meat will result in a consumption of 91 mg of n-6 and 67 mg of n-3, that is, values that are inferior to the daily needs of these fatty acids. Scheeder et al.
(2001) observed a higher deposition of n-3 fatty acids in the fat of animals fed with linseed oil, with values of 194 mg/100 g of fresh meat. However, these values still do not attend the daily needs, which leads us to the conclusion that other oils may be needed to supply these fatty acids, as vegetable or fish oils, for example.
ACKNOWLEDGEMENTS
The authors are grateful to MINERPHÓS Ltda. for providing the mineral and protein supplements to carry out this experiment. We also thank the owner of the animals, Armando Vieira Moreira, for the concession of the animals and farm used in the field experiments.
RESUMO
O objetivo deste trabalho foi avaliar a composição em ácidos graxos do músculo Longissimus dorsi,
com ou sem gordura de cobertura, de novilhos Bos indicus e mestiços Bos indicus x Bos taurus,
terminados em pastagem de milheto (Pennisetum americanum L.) ou grama estrela (Cynodon plectostachyus Pilger), com suplementação
mineral ou protéica e mineral. A composição em ácidos graxos da gordura intramuscular e da gordura de cobertura do músculo Longissimus dorsi foram analisadas por cromatografia gasosa.
REFERENCES
Bligh, E. G. and Dyer, W. J. (1959), A rapid method of total lipid extraction and purification. Canadian Journal of Biochemistry and Physiology, 37, 911-917. De Smet, S.; Webb, E. C. and Claeys, E. et al. (2000),
Effect of dietary energy and protein levels on fatty acid composition of intramuscular fat in double-muscled Belgian Blue bulls. Meat science, 56, 73-79.
Enser, M.; Hallett, K. G. and Hewett, B. et al. (1998),
Fatty acid content and composition of UK beef and lamb muscle in relation to production system and implication for human nutrition. Meat science,
49, 329-341.
Ewin, J. (1997), O lado sadio das gorduras. Rio de
Janeiro : Campus.
French, P.; Stanton, C. and Lawless, F. et al. (2000),
Fatty acid composition, including conjugated linoleic acid, of intramuscular fat from steers offered grazes grass, grass silage, or concentrate-based diets.
J. Anim. Sci., 78, 2849-2855.
Hegarty, V. (1995), Lipids-Fats, oils, and fat substitutes In: Hegarty, V. (ed.). Nutrition, Food and the environment. Minnesota : Eagan Press. pp. 171-195.
Hu, F. B. (2001), The balance between ω-6 and ω-3 fatty acids and the risk of coronary heart disease.
Nutrition, 17, 741-742.
ISO - International Organization for Standardization (1978). Animal and vegetable fats and oils -Preparation of methyl esters of fatty acids. Method
ISO 5509.
Jiménez-Colmenero, F.; Carballo, J. and Cofrades, S. (2001), Healthier meat and meat products: their role as functional foods. Meat Science, 59, 5-13.
Katan, M. B.; Zock, P. L. and Mensink, R. P. (1994), Effects of fats and fatty acid on blood lipids in humans: an overview. Am. J. Clin. Nutrition, 60 :
(Sup1), 1017-1022.
Krummel, D. (1998), Lipídeos In: Mahan, L. K. and Scott-Stump, S. (ed.). Krause: alimentos, nutrição e dietoterapia. 9. ed. São Paulo : Roca. pp.49-62.
Mandell, I. B.; Buchanansmith, J. G. and Campbell, C. P. (1998), Effects of forage vs. grain feeding on carcass characteristics, fatty acid composition, and beef quality in Limousin-cross steers when time on feed is controlled. J. Anim. Sci., 76, 2619-2630.
Mitchell, G. E.; Reed, A. W. and Rogers, S. A. (1991), Influence of feeding regimen on the sensory qualities and fatty acid contents of beef steaks. J. Food Science, 56, 1102-1103.
Rule, D. C.; Macneil, M. D. and Short, R. E. (1997), Influence of sire growth potential, time on feed, and growing-finishing strategy on cholesterol and fatty acids of ground carcass and Longissimus muscle of beef steers. J. Anim. Sci., 75, 1525-1533.
Scheeder, M. R. L.; Casutt, M. M. and Roulin, M. et al.
(2001), Fatty acid composition, cooking loss and texture of beef patties from meat of bulls fed different fats. Meat Science, 58, 321-328.
Silva, R. C. (2001), Composição muscular e perfil de ácidos graxos do músculo Longissimus dorsi de
novilhos em confinamento com substituição gradual do milho pela polpa de citrus peletizada. Msc Thesis, Universidade Estadual de Maringá, Maringá/PR, Brazil.
SAEG - Sistema para Análise Estatística e Genética (1983), Central de Processamento de Dados. Viçosa : UFV.
Tamminga, S. and Doreau, M. (1991), Lipids and rumen digestion. In: Jouany, J. P. (ed.). Rumen microbial metabolism and ruminant digestion. Paris :
INRA. pp. 151-164.
Webb, E. C.; De Smet, S. and Van Nevel, C. et al.
(1998), Effect of anatomical location on the composition of fatty acids in double-muscled Belgian Blue cows. Meat science, 50, 45-53.