Original scientiic paper UDC: 336.748.12
338.53 330.567.2
Measuring the distributional effects of inlation
in Croatia by using the LES approach
*Saša Drezgić
1,2Abstract
This paper deals with distributional effects of price changes in period from 2000 to 2007. Even though in this period we can observe relatively low inlation rates, the goal of the research is to determine whether there are possible negative effects of price changes on income inequality in Croatia. The approach bases on the appli-cation of linear expenditure system (LES) on the aggregate data, i.e. deciles of household income groups. The results show that overall inlation rate does not de-termine distributional effects in Croatia. In some years, changes in prices present higher burden for lower income groups, while in other years, higher income groups are worse off. It seems that redistributive effect primarily depends on the structure of price changes. Therefore we need further research on this issue.
Key words: Inequality, inlation, linear expenditure system, Croatia JEL classiication: D12 D31 H31 H23
1. Introduction
The paper deals with redistributive effects of inlation in Croatia in period from 2000 to 2007. Even though rise of prices is very sensitive political issue, there is relatively little empirical research that can be found in literature such as Muellbauer (1974), Shorrocks and Marlin (1982), Slottje (1987), Slesnick (1994), Bulir and Gulde (1995), Creedy and Van de Ven (1997), Bulir (2001), Easterly and Fisher (2001). In addition,
* Received: 22-10-2008; accepted: 15-12-2008
1 PhD in Economics, Faculty of Economics, University of Rijeka, Ivana Filipovića 4, 51000 Rijeka, Croatia. Scientiic afiliation: public inance. Phone: +385 51 355 129; Fax: +385 51 675 750. E-mail: [email protected]
there are not many new papers on this topic. It is not likely that such state comes from the lack of interest in such topic. One of the reasons for such case is similar like in majority socio-economic issues – lack of data. Another could be in fact that developed and emerging economies for a longer period did not have problems with high inlation. Therefore, one might conclude that welfare effects are negligible. The results of previously mentioned studies go in line with this conclusion.
The approach to measurement of welfare effects of inlation in this paper relies on application of linear expenditure system. The LES utility function is estimated using data for the year 2007. Therefore, the results enable us to observe effects of alternative sets of proportionate price changes on household welfare based on year 2007. This methodology focuses on rise of prices of particular commodity groups and determines the most important one for redistributive policy goals. Inlation effects come from the fact that prices of all goods do not vary by the same dynamics. Therefore, the inal effect will depend on the level of rise of prices of particular goods and capability of households to shift away from the goods that are relatively more expensive.
In the second part of the paper, after introduction, we present the estimation framework. Third part gives a brief description of data derivation. This study uses aggregate data from Results of Households Budget Survey and detailed Consumer price index (CPI) data provided by Croatian Central Bureau of Statistics (CBS). The results and discussion in the forth part do not show clear-cut positive or negative effect of inlation in Croatia. This effect depends on the extent of differential inlation of prices of “necessities” and “luxuries”. However, the overall level of prices was low in the period observed. In case of higher inlation, effects might substantially differ. Conclusion offers some proposals for future research.
2. Estimation framework
1997)3. The approach for determining the effects of inlation on consumption
inequality in this paper relies on utilization of the linear expenditure system (LES). Even though Stone (1954) describes the linear expenditure system methodology half of century ago, there are not many empirical studies on the topic of redistribution effects of inlation that uses that approach. Majority of the studies cover welfare effects of inlation in Australia, United States, Canada and United Kingdom. Therefore, the empirical framework used in this research comes from several studies such as Muellbauer (1974), King (1981), Frisch (1959), Creedy and van de Ven (1997), Creedy (1998).
The linear expenditure system (LES) is in form of the following additive utility function
(1)
where xi denotes the consumption of the i th good and γ
i committed consumption,
with constraints xi > γi, 0≤ βi ≤ 1 and Σi βi = 1. From the maximization of utility
subject to the budget constraint y = Σipixi we can obtain linear expenditure function
for each good, i of the form4
(2)
Committed consumption refers to a certain amount of the total income of consumers that is used for acquiring basic goods. The remaining income distributes over the set of available commodities according to respective values of marginal propensities to consume.
By differentiation of each expenditure function from equation (2), the own price elasticity of demand for the i th good, e
ii, is given by
(3)
3 Another issue that seriously jeopardizes the results of cross-section empirical framework is problem of different statistical basis of national accounts and statistical bureaus (Atkinson and Brandolini, 2001).
4 The expression y – j
which can be simpliied as
(4)
If we utilize the deinition of wi , we can write
(5)
From the household budget data, the expenditure weights or budget shares,wi, can be calculated for each commodity group. This can be done from either using the aggregate data of by grouping the individual households by income. When using individual household data authors usually have to employ labor-intensive methods of smoothing the budget data in order to avoid occurrence of negative elasticities. These weights can be used to ind, for each total expenditure group, the set of total expenditure elasticities, e
i. After calculating the ei s, the corresponding values of βi
can be determined by using (5).
Another variable important for the application of the model are own-price elasticities. They are necessary for calculation of committed expenditure, piγi, for each commodity
group and total expenditure or income group. Matrix of own-price elasticities, e
ii,
can be obtained by using a “Frisch parameter”, ξ, determined by Frisch (1959). This parameter denotes the elasticity of marginal utility of total expenditure with respect to total expenditure. If δij denotes the Kroneker delta, such that δij = 0 when i≠j, and
δij = 1 when i = j, then Frisch showed that the elasticities can be written as
(6)
so that own-price elasticities are
(7)
the sum of the total expenditure (or income) elasticity and all the price elasticities equals zero (Stone, 1954, p.513).
In order to obtain committed expenditures we can rearrange equation (4) by using
, so that
(8)
Expressions derived so far in the paper present necessary tool for obtaining the welfare effects of inlation, assuming that all consumers face same prices. We will determine these effects by calculating “equivalent” variations, and “equivalent incomes”. For the understanding of their signiicance for the welfare measurement, we expose details on their calculation further in the text.
Derivation of the expenditure function begins from indirect utility function, V(p,y)5,
which expresses utility as a function of prices and income:
(9)
if we use the term A as
(10) and term B as
(11)
expression (9) can be presented as
(12)
By using the terms A and B we can further proceed to derivation of “equivalent” variations, and “equivalent incomes”.
The expenditure function presents the minimum expenditure required to achieve utility Uat prices p, written as E(p,U). It is given by using equation (9) so that
(13)
The term presents Laspreyes type of price index and equals , using the committed consumption of each good as the weight. Due to the fact that this expression gives higher weights to goods with low expenditure elasticities (see Muellbauer, 1974, p.39), in the literature it is called as a price index of “necessities”.
Furthermore, since data on actual prices are not available we have to use proportional
changes in prices denoted by and from we have
(14)
where
(15)
The term
0 1
B B
simpliies to
(16)
which is interpreted as a weighted geometric mean of price relatives. It is sometimes referred to as relecting the price of “luxuries” because of the fact that marginal propensity to consume out of total expenditure is used as weights (see Muellbauer, 1974, p.39). For wealthier individuals this value is higher and such commodities have higher expenditure elasticities.
(17)
King (1981) brings additional measure of welfare changes of inlation, equivalent income. Equivalent income is value of income, yi, that at certain referent set of prices,
pi gives the same utility as the actual income level.
The equivalent income is minimum expenditure necessary to achieve the actual utility level, at referent set of prices:
(18)
where subscript r denotes referent prices. By expanding the expression for A and B we have
(19)
After derivation of measures of redistributive effects of price changes, the next section elaborates derivation of the dataset.
3. Data
All data for the period from 2000 to 2007 that were necessary for obtaining the results come from the Croatian Central Bureau of Statistics (CBS). Data come from two sources. First source are data on Consumer price index and price changes on particular commodity groups presented in table 1. This data come from the online database of the CBS on Consumer Price Indices (First releases). We use CPI data as average annual changes in prices. It can be observed that price changes of commodity groups show signiicant variability through the period. In some years, prices of some commodity groups had double digits.
bases on household expenditure by deciles of household sample. Data organized in that way are more convenient for the welfare analysis from the arbitrary set of income (expenditure) groups that mentioned studies pursue. In addition, problem when aggregating the data on individual households is in much higher variability of the consumption structure. This results in occurrences of large number of negative elasticities. Authors usually correct this problem by smoothing the household budget shares. By using the aggregate data this problem is less likely to occur.
Table 1: Percentage price changes by commodity groups
- annual average of rate
Year
Commodity groups 2000 2001 2002 2003 2004 2005 2006 2007
Food and nonalcoholic
beverages 5.3 3.9 0.6 1 1.4 4.6 2.5 3.3
Alcoholic beverages and
tobacco
16.2 5 1.4 1.2 5.2 6.2 1.7 3.1
Clothing and footwear 6.3 3.3 2.8 0.6 -0.5 0.5 2.3 5.2
Housing, water supply,
electricity and other fuels
19.5 9.2 1.5 1.7 3.9 4.4 7.8 2.6
Furniture, furnishings,
household, maintenance 4.1 0.8 -2.6 -1.1 -0.4 2.4 2.4 2.1
Health -6.6 8.5 8.3 9.5 3.5 3.2 7 1.9
Transport 8.9 9.5 8 3.4 3 2.1 2.6 2.6
Communications 6.3 23.2 9.8 2.3 -0.3 -0.3 0 -0.2
Recreation and culture 1.7 5.2 1.9 0.7 3.4 2.7 0.8 2.1
Education -1.1 13.6 1.7 3 -3.6 3.9 3.1 1
Catering and
accommodation services 1 2.8 4.7 2.1 3.7 2.2 3.2 2.2
Miscellaneous goods and
services 3 3.1 5.6 1.05 2 1.9 2.6 3.7
CPI 6.2 4.9 2.2 1.5 2.1 3.3 3.2 2.9
Source: Central Bureau of Statistics of Republic of Croatia, First releases
Important element for application of the LES model is the “Frisch parameter”. This parameter cannot be derived from the household expenditure data. The term refers to the elasticity of marginal utility with respect to total expenditure and Frisch (1959) brings it in empirical literature. Usually, empirical studies use different values of Frisch parameter for each expenditure group. The empirical problem is that there is still no deinitive agreement about the values of that parameter. Several studies conirm negative Frisch values (Lluch and Williams, 1975, Creedy and Van de Ven, 1997). Usual approach for determining the Frisch values is to specify a certain pattern using the a priori assumptions (see Creedy and Van de Ven, 1997, p. 136). These assumptions base on previous work. Such approach is present in this study as well. We base Frisch values of Croatian economy on the lexible speciication used by Lluch and Williams (1975), Creedy and Van de Ven (1997), Creedy and Cornwell (1998):
log(–ξ) = a – α log(y + θ) (20)
Estimates of the Frisch values start with certain values and than by experimentation with range of alternatives (Creedy and Van de Ven, 1997, p.136). For the estimation of the Frisch parameter, we apply maximum likelihood estimation on a hypothetical set of data and initial values for parameters a, α, θ. These values are 25, 1.3 and
10000 respectively. Even though the choice of the parameter values relies on previous research, the fact is that these values are arbitrary (in other studies as well). The choice of initial parameter values in optimization problem might have signiicant effects on optimization outcomes; however, this is one of the limitations of this approach. Figure 1 presents Frisch values by expenditure deciles.
Figure 1: Frisch values applied in the LES model
The next section exposes the results of estimation of welfare changes due to inlation for Croatian economy.
4. Results and discussion
Although the second part of the paper describes the LES methodology, it is useful to go briely through the process of calculation of equivalent variations and equivalent income that are necessary for determination of the welfare effects.
As a irst stage, we had to derive values of budget shares (wi), income elasticities (e
i) and marginal propensity to consume (βi) for all income groups. Elasticities and
budget shares (for the year 2007) derive from the household data. Income elasticities are derived exactly by the procedure thoroughly described by Creedy (1998, p. 146). For the derivation of elasticities raw budget shares were used. Due to higher level of aggregation, there was no problem with occurrence of negative elasticities. Income elasticities are presented in table A2.
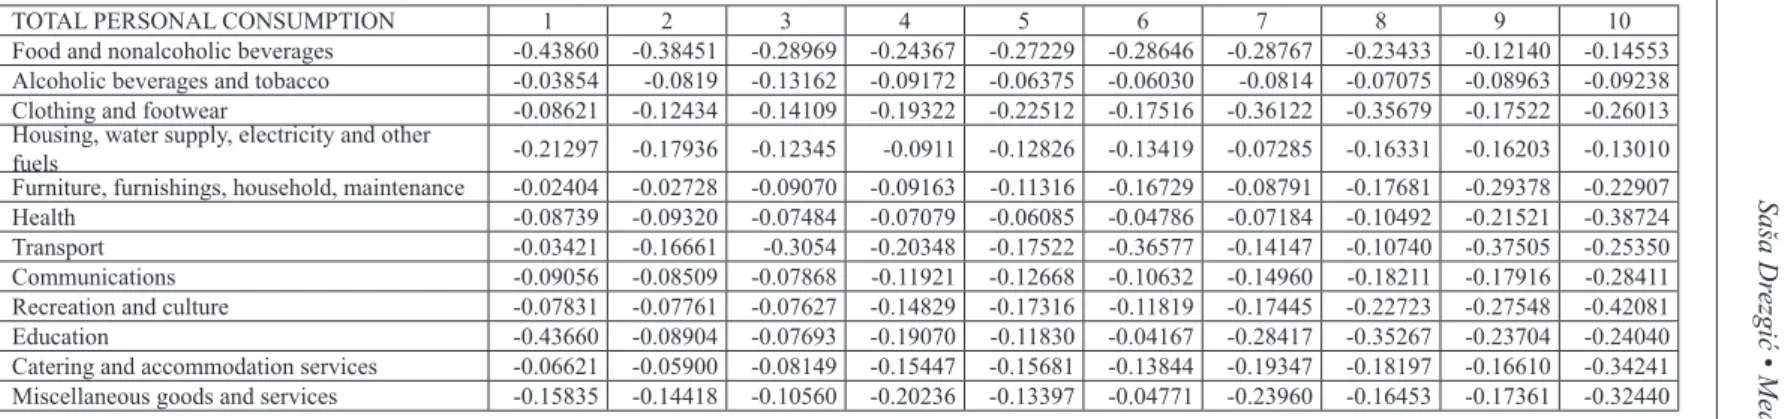
After obtaining budget shares and income elasticities, we estimate βi (table A3) by
using relation (5). Finally, by using Frisch values (igure 1) we calculate the own-price elasticities (table A4). After that, we use equation (12) to calculate committed consumption (table A5) necessary for the estimation of measures of welfare effects of inlation. By taking into account values of income elasticities and commited consumption presented in tables A2 and A5 as in Muelbauer (1974) it can be concluded that food and housing turn out to be a “strategic” commodity.
Table 2: Equivalent variations (by income deciles)
Year
Number
of deciles
2000 2001 2002 2003 2004 2005 2006 2007
1 0.0746 0.0604 0.0213 0.0148 0.0208 0.0368 0.0349 0.0287
2 0.0724 0.0612 0.0231 0.0154 0.0208 0.0361 0.0345 0.0289
3 0.0721 0.0615 0.0251 0.0161 0.0212 0.0353 0.0336 0.0289
4 0.0718 0.0628 0.0282 0.0164 0.0209 0.0334 0.0323 0.0287
5 0.0696 0.0619 0.0279 0.0151 0.0200 0.0327 0.0307 0.0290
6 0.0699 0.0630 0.0288 0.0156 0.0202 0.0323 0.0309 0.0287
7 0.0692 0.0625 0.0308 0.0156 0.0192 0.0308 0.0295 0.0295
8 0.0668 0.0619 0.0298 0.0150 0.0184 0.0303 0.0295 0.0295
9 0.0666 0.0621 0.0306 0.0156 0.0191 0.0299 0.0296 0.0287
10 0.0644 0.0656 0.0313 0.0159 0.0192 0.0293 0.0294 0.0285
Source: Author’s calculations
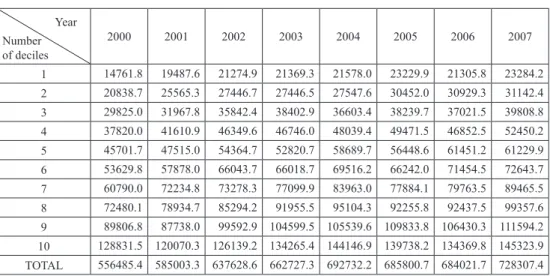
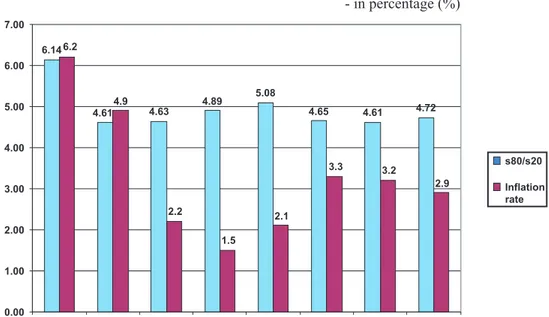
Equivalent income values presented in table 3 were calculated by using (19) with help of the fact that y1e = y1 – EV. However, it is dificult to read welfare effects from
the table. Therefore, igure 2 presents comparison of quintile shares and inlation rates in the period analyzed. Equivalent income provides dataset for calculation of quintile shares.
Table 3: Equivalent income (by income deciles)
Year
Number
of deciles
2000 2001 2002 2003 2004 2005 2006 2007
1 14761.8 19487.6 21274.9 21369.3 21578.0 23229.9 21305.8 23284.2
2 20838.7 25565.3 27446.7 27446.5 27547.6 30452.0 30929.3 31142.4
3 29825.0 31967.8 35842.4 38402.9 36603.4 38239.7 37021.5 39808.8
4 37820.0 41610.9 46349.6 46746.0 48039.4 49471.5 46852.5 52450.2
5 45701.7 47515.0 54364.7 52820.7 58689.7 56448.6 61451.2 61229.9
6 53629.8 57878.0 66043.7 66018.7 69516.2 66242.0 71454.5 72643.7
7 60790.0 72234.8 73278.3 77099.9 83963.0 77884.1 79763.5 89465.5
8 72480.1 78934.7 85294.2 91955.5 95104.3 92255.8 92437.5 99357.6
9 89806.8 87738.0 99592.9 104599.5 105539.6 109833.8 106430.3 111594.2
10 128831.5 120070.3 126139.2 134265.4 144146.9 139738.2 134369.8 145323.9
TOTAL 556485.4 585003.3 637628.6 662727.3 692732.2 685800.7 684021.7 728307.4
Comparison of the quintile shares and inlation rate through the period from 2000 to 2007 show no substantial changes in terms of wealth redistribution in the country. Values of the quintile shares roughly match data from the World Development Indicators - 4.2 for the year 2005 (the World Bank, 2008) and CBS - 4.8 for the year 2006.
One of the reasons for insigniicant redistributive effect could be in fact that inlation was relatively stable and on low level in this period. However, it is hard to determine if such stable level of inequality results from progressive taxation, government transfers and increase in employment and wages that counteracted the rise of prices6.
Figure 2: Comparison of quintile shares and inlation rates in the period 2000 – 2007
- in percentage (%)
Source: Author's calculation, CBS
The estimated measures show that redistributive effects of inlation in Croatia do not depend on the level of overall inlation rate. The key factor is in structure of price changes. If rise of prices affects more “necessities” then the redistributive effect is regressive. The nonlinear effect of inlation determined in some research
might be explained by the possibility that higher inlation leads to decrease of elasticities of necessities and shifts the value of marginal propensity to consume towards necessities. This results from decline in real wages, higher unemployment7
and state of uncertainty where consumption of luxuries is postponed. It is likely that higher overall inlation rate puts more pressure in higher prices of commodities with inelastic demand – this is the source of nonlinearity. However, that is the topic for future research.
5. Conclusion
The results of this research show that there are no signiicant negative effects of inlation on welfare in the period analyzed. Such indings conirm the results of other studies that there are no signiicant redistributive effects in case of low level inlation.
In some years inlation more heavily burdens low incomes and in other higher ones. Therefore, the reasons of progressive or regressive effect can be found in the raises of prices within the particular groups of commodities. In addition, it can be concluded that food and housing turn out to be crucial commodities in terms of welfare effects of inlation. Rise in prices of these groups of commodities would substantially increase inequality. Also, it would be worthwhile to compare these results obtained by aggregate data with similar analysis that uses detailed data on households from the CBS. This could lead to further reinement of the results by enabling exclusion of durable goods, exploiting variability of budget shares and calculation of within-group inequality. In addition, there is obvious non-linear pattern present in income and price elasticities, therefore, development of non-linear expenditure system methodology would be beneicial in terms of improvements of the results.
References
Atkinson, B.A., Brandolini, A. (2001) “Promise and Pitfalls in the Use of “Secondary” Data-Sets: Income Inequality in OECD Countries as a Case Study”, Journal of Economic Literature, Vol. 39, pp. 771-799.
Bulir, A. (2001) “Income Inequality: Does Inlation Matter”, IMF Staff Paper, IMF, Vol. 48, No. 1, pp. 139-159.
Bulir, A., Gulde, A.M. (1995) “Inlation and Income Distribution: Further Evidence on Empirical Links”, IMF Working Paper, IMF, pp. 1-30.
Central Bureau of Statistics of Republic of Croatia, Results of Households Budget Survey, different years
Cornwell, A., Creedy, J. (1997) “Measuring the Welfare Effects of Tax Changes Using the LES: An Application to a Carbon Tax”, Empirical Economics, 22, pp. 589-613.
Creedy, J. (1998) “Measuring the Welfare Effects of Price Changes: A Convenient Parametric Approach”, Australian Economic Papers, pp.137-151.
Creedy, J., Van de Ven, J., (1997) “The Distributional Effects of Inlation in Australia 1980-1995”, The Australian Economic Review, vol. 30. no. 2, pp. 125-143. Cysne, P. R. et al. (2005) “Inlation and Income Inequality: A shopping-time
approach”, Journal of Development Economics, 78, pp. 516-528.
Easterly, W., Fisher, S. (2001) “Inlation and the Poor”, Journal of Money, Credit and Banking, Vol. 33, No. 2, pp. 160-178.
Frisch, R. (1959), “A Complete Scheme for Computing All Direct and Cross Demand Elasticities in a Model with Many Sectors”, Econometrica, Vol. 27, No. 2, pp. 177-196.
King, M.A. (1981) “Welfare Analysis of Tax Reforms Using Household Data”,
NBER Technical Paper Series, NBER, No. 16, pp. 1-56.
Lluch, C., Williams R. (1975) “International Patterns in the Elasticity of the Marginal Utility of Income and Expenditure”, International Bank for Reconstruction and Development, Discussion Papers, No. 11, pp. 1-20.
Muellbauer, J. (1974) “Prices and Inequality: The United Kingdom Experience”,
The Economic Journal, Vol. 84., No. 333, pp. 32-55.
Sarel, M. (1997) “How Macroeconomic Factors Affect Income Distribution: The Cross-Country Evidence”, IMF Working Paper, IMF, pp. 1-25.
Shorrocks, A., Marlin, E. (1982) “Inlation and Low Incomes”, Canadian Public Policy, Vol 8, No. 3, pp. 334-346.
Slesnick, T.D. (1994) “Consumption, Needs and Inequality”, International Economic Review, Vol. 35, No. 3, pp. 677-703.
Slottje, D.J. (1987) “Relative Price Changes and Inequality in the Size Distribution of Various Components of Income: A Multidimensional Approach”, Journal of Business & Economic Statistics, Vol. 5, No. 1, pp. 19-26.
Stone, R. (1954) “Linear Expenditure Systems and Demand Analysis: An Application to the Pattern of British Demand”, The Economic Journal, Vol. 64, No. 255, pp. 511-527.
Mjerenje redistribucijskih učinaka inlacije u Hrvatskoj
primjenom LES modela
Saša Drezgić1,2
Sažetak
Rad se bavi distribucijskim učincima promjena cijena u razdoblju od 2000. do 2007. godine. Iako se u ovom razdoblju mogu primijetiti relativno niske stope in-lacije, cilj istraživanja je utvrditi moguće negativne učinke promjena cijena na dohodovnu nejednakost u Hrvatskoj. Pristup se zasniva na primjeni linearnog sus-tava potrošnje na agregirane podatke, dohodovne skupine kućanssus-tava po decilima. Rezultati pokazuju da opća stopa inlacije nema utjecaja na distribucijske učinke u Hrvatskoj. U pojedinim godinama promjene u cijenama predstavljaju veći teret za niže dohodovne skupine dok je u drugim godinama opterećenje veće za gornje do-hodovne skupine. Čini se da redistributivni učinak u prvom redu ovisi o strukturi promjena cijena. Zato su potrebna daljnja istraživanja problema.
Ključne riječi: Nejednakost, inlacija, linearni sustav potrošnje, Hrvatska JEL klasiikacija: D12, D31, H31, H23
1 Doktor ekonomskih znanosti, Sveučilište u Rijeci, Ekonomski fakultet, Ivana Filipovića 4, 51000 Rijeka, Hrvatska. Znanstveni interes: javne inancije. Tel: +385 51 355 129. Fax: +385 51 675 750. E-mail: [email protected]
Appendices
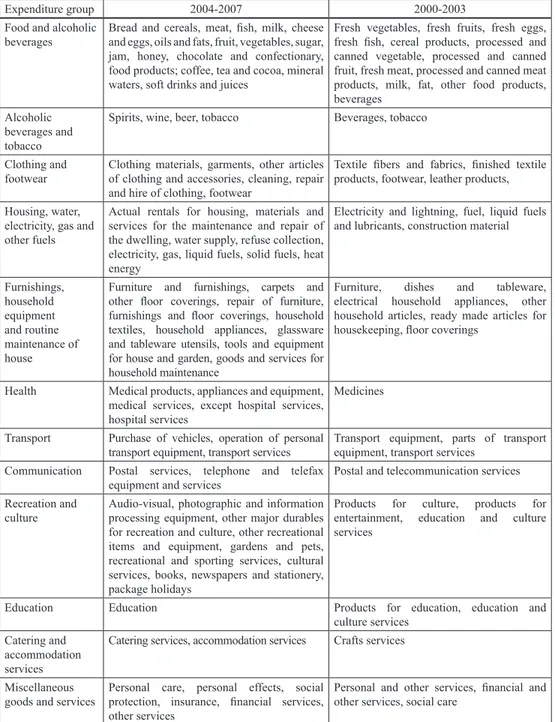
Table A1: Structure of Consumer price index according to COICOP8
Expenditure group 2004-2007 2000-2003
Food and alcoholic
beverages Bread and cereals, meat, ish, milk, cheese and eggs, oils and fats, fruit, vegetables, sugar, jam, honey, chocolate and confectionary, food products; coffee, tea and cocoa, mineral waters, soft drinks and juices
Fresh vegetables, fresh fruits, fresh eggs, fresh ish, cereal products, processed and canned vegetable, processed and canned fruit, fresh meat, processed and canned meat products, milk, fat, other food products, beverages
Alcoholic beverages and
tobacco
Spirits, wine, beer, tobacco Beverages, tobacco
Clothing and
footwear Clothing materials, garments, other articles of clothing and accessories, cleaning, repair and hire of clothing, footwear
Textile ibers and fabrics, inished textile products, footwear, leather products,
Housing, water,
electricity, gas and other fuels
Actual rentals for housing, materials and services for the maintenance and repair of the dwelling, water supply, refuse collection, electricity, gas, liquid fuels, solid fuels, heat
energy
Electricity and lightning, fuel, liquid fuels and lubricants, construction material
Furnishings, household equipment and routine maintenance of house
Furniture and furnishings, carpets and other loor coverings, repair of furniture, furnishings and loor coverings, house hold textiles, household appliances, glassware and tableware utensils, tools and equipment for house and garden, goods and services for household maintenance
Furniture, dishes and tableware, electrical household appliances, other household articles, ready made articles for housekeeping, loor coverings
Health Medical products, appliances and equipment, medical services, except hospital services, hospital services
Medicines
Transport Purchase of vehicles, operation of personal
transport equipment, transport services Transport equipment, parts of transport equipment, transport services Communication Postal services, telephone and telefax
equipment and services Postal and telecommunication services
Recreation and culture
Audio-visual, photographic and information processing equipment, other major durables
for recreation and culture, other recreational
items and equipment, gardens and pets, recreational and sporting services, cultural services, books, newspapers and stationery, package holidays
Products for culture, products for entertainment, education and culture services
Education Education Products for education, education and
culture services
Catering and
accommodation services
Catering services, accommodation services Crafts services
Miscellaneous
goods and services Personal care, personal effects, social protection, insurance, inancial services, other services
Personal and other services, inancial and other services, social care
8 Classiication of Individual Consumption by Purpose
ezgić • Measuring the distributional effects of inlation in Cr
oatia...
. 2 • 239-256
255
Food and nonalcoholic beverages 0.967101 0.848788 0.675164 0.608873 0.70681 0.748708 0.776175 0.611675 0.321874 0.375062
Alcoholic beverages and tobacco 0.555055 1.224818 1.616392 0.994701 0.645678 0.58148 0.687483 0.554656 0.637906 0.491829
Clothing and footwear 1.450802 1.845489 1.698668 2.063533 1.963498 1.348944 2.552064 2.06345 0.899949 1.083018
Housing, water supply, electricity and other fuels 0.939631 0.789867 0.574545 0.449549 0.661237 0.66008 0.367329 0.811778 0.758185 0.512156
Furniture, furnishings, household, maintenance 0.268336 0.34568 1.099444 0.978446 1.157749 1.505274 0.660446 1.310226 1.895787 1.09561
Health 1.425697 1.334104 0.972535 0.861636 0.778669 0.558389 0.714878 0.951176 1.739744 2.190308
Transport 0.529062 2.728158 3.201716 1.412276 1.249845 2.228114 0.64431 0.527961 1.697145 0.921735
Communications 1.246916 1.058115 0.947232 1.289974 1.237336 0.942923 1.192192 1.317849 1.17095 1.397192
Recreation and culture 1.024791 0.959293 0.903588 1.64275 1.622555 1.00391 1.323934 1.576755 1.725478 1.952187 Education 14.33753 2.40036 1.836292 3.691447 1.930201 0.592021 3.32192 3.585305 2.037767 1.426667
Catering and accommodation services 1.536583 1.18672 1.522059 2.305585 1.996226 1.508216 1.786341 1.472526 1.206971 1.810419
Miscellaneous goods and services 1.875971 1.368321 0.979964 1.731439 0.942621 0.361457 1.567645 0.971776 0.966075 1.423499
Source: Author’s calculations
Table A3: Marginal propensity to consume (by income deciles and expenditure groups)
TOTAL PERSONAL CONSUMPTION 1 2 3 4 5 6 7 8 9 10
Food and nonalcoholic beverages 0.4217 0.3660 0.2703 0.2210 0.2431 0.2505 0.2402 0.1889 0.0902 0.0918
Alcoholic beverages and tobacco 0.0222 0.0416 0.0725 0.0463 0.0296 0.0239 0.0276 0.0210 0.0232 0.0160
Clothing and footwear 0.0444 0.0651 0.0794 0.1047 0.1322 0.0971 0.1959 0.2070 0.0877 0.1077
Housing, water supply, electricity and other fuels 0.1900 0.1565 0.1031 0.0711 0.0957 0.0959 0.0446 0.0961 0.0884 0.0536
Furniture, furnishings, household, maintenance 0.0161 0.0156 0.0495 0.0470 0.0534 0.0784 0.0367 0.0646 0.1150 0.0680
Health 0.0464 0.0497 0.0379 0.0308 0.0192 0.0125 0.0151 0.0196 0.0366 0.0637
Transport 0.0186 0.0805 0.2050 0.1457 0.1149 0.2601 0.0945 0.0621 0.2371 0.1265
Communications 0.0550 0.0506 0.0429 0.0612 0.0635 0.0488 0.0593 0.0699 0.0622 0.0817
Recreation and culture 0.0489 0.0462 0.0421 0.0756 0.0929 0.0575 0.0759 0.0969 0.1123 0.1630 Education 0.0078 0.0072 0.0048 0.0169 0.0146 0.0039 0.0227 0.0364 0.0254 0.0198
Catering and accommodation services 0.0209 0.0190 0.0228 0.0495 0.0538 0.0462 0.0579 0.0545 0.0430 0.0795
Miscellaneous goods and services 0.1079 0.1020 0.0696 0.1302 0.0871 0.0251 0.1297 0.0830 0.0788 0.1287
Saša Dr
ezgić • Measuring the distributional effects of inlation in Cr
oatia...
Zb. rad. Ekon. fak. Rij. • 2008 • vol. 26 • sv
. 2 • 239-256
Food and nonalcoholic beverages -0.43860 -0.38451 -0.28969 -0.24367 -0.27229 -0.28646 -0.28767 -0.23433 -0.12140 -0.14553 Alcoholic beverages and tobacco -0.03854 -0.0819 -0.13162 -0.09172 -0.06375 -0.06030 -0.0814 -0.07075 -0.08963 -0.09238 Clothing and footwear -0.08621 -0.12434 -0.14109 -0.19322 -0.22512 -0.17516 -0.36122 -0.35679 -0.17522 -0.26013 Housing, water supply, electricity and other
fuels -0.21297 -0.17936 -0.12345 -0.0911 -0.12826 -0.13419 -0.07285 -0.16331 -0.16203 -0.13010
Furniture, furnishings, household, maintenance -0.02404 -0.02728 -0.09070 -0.09163 -0.11316 -0.16729 -0.08791 -0.17681 -0.29378 -0.22907
Health -0.08739 -0.09320 -0.07484 -0.07079 -0.06085 -0.04786 -0.07184 -0.10492 -0.21521 -0.38724
Transport -0.03421 -0.16661 -0.3054 -0.20348 -0.17522 -0.36577 -0.14147 -0.10740 -0.37505 -0.25350
Communications -0.09056 -0.08509 -0.07868 -0.11921 -0.12668 -0.10632 -0.14960 -0.18211 -0.17916 -0.28411
Recreation and culture -0.07831 -0.07761 -0.07627 -0.14829 -0.17316 -0.11819 -0.17445 -0.22723 -0.27548 -0.42081 Education -0.43660 -0.08904 -0.07693 -0.19070 -0.11830 -0.04167 -0.28417 -0.35267 -0.23704 -0.24040
Catering and accommodation services -0.06621 -0.05900 -0.08149 -0.15447 -0.15681 -0.13844 -0.19347 -0.18197 -0.16610 -0.34241 Miscellaneous goods and services -0.15835 -0.14418 -0.10560 -0.20236 -0.13397 -0.04771 -0.23960 -0.16453 -0.17361 -0.32440 Source: Author’s calculations
Table A5: Committed consumption (by income deciles and expenditure groups)
1 2 3 4 5 6 7 8 9 10
Food and nonalcoholic beverages 10141.14 13415.21 15959.13 19009.39 20838.27 23801.02 26717.55 29821.71 31066.31 34417.33
Alcoholic beverages and tobacco 941.4023 1042.533 1719.438 2391.125 2785.839 2959.644 3487.298 3682.889 3899.181 4494.521
Clothing and footwear 701.3004 1058.755 1786.307 2468.218 3788.58 4913.369 5617.858 8322.833 10119.69 12320.43
Housing, water supply, electricity and other
fuels 4706.975 6175.795 7185.138 8350.815 8786.327 10401.96 10846.72 11214.6 12301.45 14388.07
Furniture, furnishings, household, maintenance 1423.642 1428.393 1763.471 2468.835 2723.407 3514.804 4840.509 4439.425 5557.894 7670.759
Health 746.2519 1138.392 1536.118 1849.208 1488.341 1614.362 1836.655 1919.482 1968.841 2844.773
Transport 826.8017 856.6539 2291.316 5190.248 5398.1 7477.489 12804.7 11444.84 13137.92 17526.79
Communications 1017.611 1476.689 1786.659 2402.353 3015.304 3636.297 4139.166 4771.24 5333.257 6812.525
Recreation and culture 1108.46 1492.043 1841.476 2286.751 3288.771 4007.88 4717.703 5377.012 6096.664 8638.303 Education 7.433132 88.43681 100.2603 203.3168 426.452 469.5387 460.3144 697.8957 1122.199 1605.098
Catering and accommodation services 310.0908 492.8362 577.0878 1030.964 1514.056 2069.277 2556.963 3276.92 3567.066 4688.816
Miscellaneous goods and services 1299.837 2276.001 2797.951 3722.176 5519.721 5072.769 6658.449 7954.741 8398.637 10481.8
TOTAL PERSONAL CONSUMPTION 23230.95 30941.74 39344.35 51373.4 59573.17 69938.41 84683.88 92923.58 102569.1 125889.2