Rainbow Trout Lines Fed with Vegetable Oil: Effect of
Carbohydrates
Biju Sam Kamalam, Franc¸oise Me´dale, Laurence Larroquet, Genevie`ve Corraze, Stephane Panserat*
UR1067 Nutrition Metabolism Aquaculture, Institut National de la Recherche Agronomique, Saint-Pe´e-sur-Nivelle, France
Abstract
The present study investigated the effect of dietary carbohydrates on metabolism, with special focus on fatty acid bioconversion and flesh lipid composition in two rainbow trout lines divergently selected for muscle lipid content and fed with vegetable oils. These lines were chosen based on previously demonstrated potential differences in LC-PUFA synthesis and carbohydrate utilization. Applying a factorial study design, juvenile trout from the lean (L) and the fat (F) line were fed vegetable oil based diets with or without gelatinised starch (17.1%) for 12 weeks. Blood, liver, muscle, intestine and adipose tissue were sampled after the last meal. Feed intake and growth was higher in the L line than the F line, irrespective of the diet. Moderate postprandial hyperglycemia, strong induction of hepatic glucokinase and repressed glucose-6-phosphatase transcripts confirmed the metabolic response of both lines to carbohydrate intake. Further at the transcriptional level, dietary carbohydrate in the presence of n-3 LC-PUFA deficient vegetable oils enhanced intestinal chylomicron assembly, disturbed hepatic lipid metabolism and importantly elicited a higher response of key desaturase and elongase enzymes in the liver and intestine that endorsed our hypothesis. PPARcwas identified as the factor mediating this dietary regulation of fatty acid bioconversion enzymes in the liver. However, these molecular changes were not sufficient to modify the fatty acid composition of muscle or liver. Concerning the genotype effect, there was no evidence of substantial genotypic difference in lipid metabolism, LC-PUFA synthesis and flesh fatty acid profile when fed with vegetable oils. The minor reduction in plasma glucose and triglyceride levels in the F line was linked to potentially higher glucose and lipid uptake in the muscle. Overall, these data emphasize the importance of dietary macro-nutrient interface in evolving fish nutrition strategies.
Citation:Kamalam BS, Me´dale F, Larroquet L, Corraze G, Panserat S (2013) Metabolism and Fatty Acid Profile in Fat and Lean Rainbow Trout Lines Fed with Vegetable Oil: Effect of Carbohydrates. PLoS ONE 8(10): e76570. doi:10.1371/journal.pone.0076570
Editor:Patrick Prunet, Institut National de la Recherche Agronomique (INRA), France ReceivedApril 25, 2013;AcceptedAugust 25, 2013;PublishedOctober 4, 2013
Copyright:ß2013 Kamalam et al. This is an open-access article distributed under the terms of the Creative Commons Attribution License, which permits unrestricted use, distribution, and reproduction in any medium, provided the original author and source are credited.
Funding:BS Kamalam was a recipient of the International doctoral fellowship provided by the Indian Council of Agricultural Research (ICAR). This study was supported by internal grants of the Nutrition, Metabolism and Aquaculture unit of the Institut National de la Recherche Agronomique (INRA), France. The funders had no role in study design, data collection and analysis, decision to publish, or preparation of the manuscript.
Competing Interests:The authors have declared that no competing interests exist. * E-mail: [email protected]
Introduction
Long chain polyunsaturated fatty acids (LC-PUFA) are indis-pensable in human nutrition due to their vital role in health, development and functionality of several organs. Compared to other food products, fish is the most salubrious source of n-3 LC-PUFA besides providing high quality protein and essential micronutrients [1,2]. Nevertheless, the fatty acid content of the fish varies depending on the species, genotype, dietary and environmental factors [3–5].
At present, an increasing proportion of fish for human consumption comes from aquaculture, where formulation of feeds with fish meal and fish oil ensures n-3 LC-PUFA rich meat production. Parallel to the expansion of aquaculture the demand for these marine ingredients also increases, but global supply has stagnated and the reduction fishery that provides it is perceived as unsustainable and over-exploitative of natural resources [6]. When addressing the imminent shortage, replacement of fish oil by vegetable oils challenges the maintenance of the recognized health benefits due to n-3 LC-PUFA content. Several studies have shown that complete or partial replacement of fish oil with single vegetable oil such as rapeseed oil, linseed oil, palm oil or with a
vegetable oil blend has limited effect on growth but marked consequences on lipid metabolism, tissue lipid composition and associated factors such as digestibility, fatty acid catabolism, lipid transport and uptake, lipogenesis, fatty acid desaturation and elongation, and eicosanoid synthesis [4,7,8]. Mostly, dietary fatty acid composition is reflected in the flesh and lipid stores of the fish. However, the magnitude of the change is dependent on the species, fatness and tissues [4].
and increased fatty acid synthesis through the supply of reducing equivalents and substrates [17] may extend also to fatty acid bioconversion. Thus we hypothesized that in a low n-3 LC-PUFA (vegetable oil) dietary environment; carbohydrate intake may enhance the stimulation of fatty acid bioconversion pathway leading to beneficial flesh lipid composition.
We tested this hypothesis in two genotypes of rainbow trout because genetic makeup was found to influence the lipid deposition and metabolism in fish through a highly heritable genetic component governing the capacity to synthesize and/or deposit LC-PUFA, particularly when fed diets low in these fatty acids [5,18,19]. The two experimental rainbow trout lines, namely fat line (F) and lean line (L), were developed through divergent selection for muscle fat content using a non-invasive technique [20]. Previous studies revealed that the two lines consistently differed in growth and hepatic intermediary metabolism, albeit under different dietary regimes [21–23]. Compared to the L line, the F line was found to have lower plasma glucose levels 24 h after the last meal [22]; reduced hepatic fatty acid oxidation and enhanced glycolysis in liver and muscle [21]; higher lipogenic potential coupled with higher liver glycogen content with an increase in dietary carbohydrate intake [23], all of which suggest a better ability of the F line to metabolise and store glucose. Importantly, the F line also exhibited a prospective genetic pre-disposition for higher LC-PUFA synthesis, both in the liver and intestine [23,24]. These features make the two lines unique models to study genotypic response to dietary manipulations focusing on sustainable feeds.
The aim of the present study was therefore to investigate the impact of dietary carbohydrate on the metabolism and tissue lipid composition of these two trout lines, when fed vegetable oil based diets containing low levels of n-3 LC-PUFA. At the phenotypic level, we measured postprandial plasma metabolite levels and the fatty acid composition of the muscle and liver. At the molecular level, we analysed the gene expression of intestinal markers of glucose and lipid absorption; markers of carbohydrate (glycolysis and gluconeogenesis) and lipid (lipogenesis and b-oxidation) metabolism in the liver, muscle and adipose tissue; transcriptional factors of fatty acid metabolism; key enzymes of the fatty acid bioconversion pathway in the liver and intestine; and markers of glucose and fatty acid uptake in the muscle.
Materials and Methods
Ethics statement
The experiment was carried out in strict accordance with EU legal frameworks relating to the protection of animals used for scientific purposes (Directive 2010/63/EU) and guidelines of the French legislation governing the ethical treatment of animals (Decree no. 2001-464, May 29th, 2001). It was approved by the ethics committee of INRA (INRA 2002-36, April 14, 2002). The INRA experimental station is certified for animal services under the permit number A64.495.1 by the French veterinary services, which is the competent authority.
Experimental fish and diets
The study was conducted with juvenile rainbow trout ( Onco-rhynchus mykiss, Walbaum) from two experimental lines, namely fat line (F) and lean line (L), obtained after four generations of divergent selection for high or low muscle fat content using a non-invasive method (Distell Fish Fatmeter, Fauldhouse, West Lothian, UK), as detailed by Quillet et al. [20]. Fish were reared in the INRA flow-through experimental facilities at Donzacq (Landes, France) at a constant water temperature of 17uC, under natural
photoperiod during the months of April-July. They were fed a standard commercial trout diet during the acclimatisation period (T-3P classic, Skretting, France). Two experimental diets, namely VOC- (vegetable oil based diet without carbohydrate) and VOC+
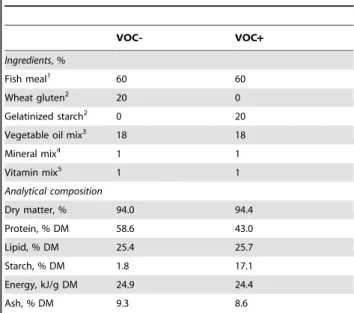
(vegetable oil based diet with carbohydrate) were prepared in our own facilities (INRA, Donzacq, Landes, France) as extruded pellets. The vegetable oil mix used in the diet formulation comprised of linseed oil, palm oil and rapeseed oil in the ratio 50:30:20, respectively. Gelatinized starch was included as the carbohydrate source. The VOC- diet contained 1.8% starch, whereas the VOC+diet contained 17.1% starch (Table 1). The increase in dietary carbohydrate content was accompanied by a decrease in the proportion of protein in the VOC+diet.
Feeding trial and sampling procedure
Fish of each line were distributed into six tanks of 30 animals (mean weight 12061.5 g). Triplicate groups of each genotype were fed either the VOC- or the VOC+ diet, twice a day ad-libitum for a period of 12 weeks. The fish were bulk weighed every 3 wks and counted to calculate the mean body weight. Feed intake was recorded. At the end of the trial, nine fish per group (3/tank) were randomly sampled at 2 and 8 h after the last meal. Trout were anaesthetised in diluted 2-phenoxyethanol (0.05%), individ-ually weighed and sacrificed after collecting blood, by severing the spinal cord behind the head. Blood was removed from the caudal vein into heparinised syringes and centrifuged (3,000g, 5 min), the recovered plasma was immediately frozen and kept at220uC until analysis. Gut content of each fish was systematically checked to
Table 1.Composition of diets.
VOC- VOC+
Ingredients, %
Fish meal1 60 60
Wheat gluten2 20 0
Gelatinized starch2 0 20
Vegetable oil mix3 18 18
Mineral mix4 1 1
Vitamin mix5 1 1
Analytical composition
Dry matter, % 94.0 94.4
Protein, % DM 58.6 43.0
Lipid, % DM 25.4 25.7
Starch, % DM 1.8 17.1
Energy, kJ/g DM 24.9 24.4
Ash, % DM 9.3 8.6
VOC-, diet without carbohydrate; VOC+, diet with carbohydrate; DM, dry matter. 1Sopropeche, Boulogne-sur-Mer, France
2Roquette, Lestrem, France
3Linseed/Palm/Rapeseed oil in the ratio 50:30:20 (Daudruy, Dunkerque, France) 4Supplied the following (kg21diet): calcium carbonate (40% Ca) 2.15 g, magnesium oxide (60% Mg) 1.24 g, ferric citrate 0.2 g, potassium iodide (75% I) 0.4 mg, zinc sulphate (36% Zn) 0.4 g, copper sulphate (25% Cu) 0.3 g, manganese sulphate (33% Mn) 0.3 g, dibasic calcium phosphate (20% Ca, 18% P) 5 g, cobalt sulphate 2 mg, sodium selenite (30% Se) 3 mg, potassium chloride 0.9 g, Sodium chloride 0.4 g.
5Supplied the following (kg21diet): DL-a tocopherol acetate 60 IU, sodium menadione bisulphate 5 mg, retinyl acetate 15000 IU, DLcholecalciferol 3000 IU, thiamin 15 mg, riboflavin 30 mg, pyridoxine 15 mg, vit. B120.05 mg, nicotinic acid 175 mg, folic acid 500 mg, inositol 1000 mg, biotin 2.5 mg, calcium panthotenate 50 mg, choline chloride 2000 mg.
confirm that the fish sampled had effectively consumed the diet. Liver, dorso-ventral white muscle, intestine (midgut - region after the last pyloric caecum to the start of the distal segment of the intestine) and perivisceral adipose tissue were dissected, weighed, immediately frozen in liquid nitrogen and kept at 280uC until analysis. The weight of liver and viscera was used to calculate the hepato/viscero-somatic index [in (%) = 1006 (X weight/body weight), where X is liver or viscera]. Each tank with 30 fish represented one experimental unit to calculate feed intake and body weight. Daily feed intake (in dry weight basis) was calculated as the total amount of feed supplied and ingested (kg) divided by the mean biomass over the trial [(initial biomass+final biomass)/ 2, expressed in kg wet weight (WW)] and the number of days. Final body weight was calculated as the final biomass divided by the number of fish in each tank at the end of the feeding trial.
Analytical methods
The chemical composition of the diets was analyzed using the following procedures: dry matter after drying at 105uC for 24 h, lipid content by petroleum ether extraction (Soxtherm), protein content (N66.25) by the Kjeldahl method after acid digestion, gross energy in an adiabatic bomb calorimeter (IKA, Heitersheim Gribheimer, Germany), ash content by incinerating the samples in a muffle furnace at 600uC for 6 h and starch content by enzymatic method (InVivo labs, France). Plasma glucose (Glucose RTU, bioMe´rieux, Marcy l9Etoile, France), triglycerides (Triglycerides PAP 150, bioMe´rieux) and cholesterol (Cholesterol RTU, bioMe´rieux) levels were determined using commercial kits adapted to a microplate format, according to the recommendations of the manufacturer. Total plasma free amino acid levels were determined by ninhydrin reaction according to the method of Moore [25] with glycine as a standard.
mRNA levels analysis: quantitative RT-PCR
Analyses of mRNA levels were performed on samples from the liver, white muscle, intestine and perivisceral adipose tissue of fish sampled 8 h after the last meal. This time point corresponds to the post-prandial peak of nutrient absorption in juvenile rainbow trout reared at 17uC. Tissue samples from six individual fish per experimental condition (chosen based on homogeneity of plasma glucose levels) were used as biological replicates. Total RNA was extracted using TRIzol (Invitrogen, Carlsbad, CA) according to the manufacturer’s recommendations, quantified by spectropho-tometry (absorbance at 260 nm) and integrity was controlled by agarose gel electrophoresis. One microgram of the resulting total RNA was reverse transcribed into cDNA using the SuperScript III RNaseH- reverse transcriptase kit (Invitrogen) and random primers (Promega, Charbonnie´res, France), according to the instructions of each manufacturer. Quantification of target gene expression levels were carried out in an iCycler iQ real-time PCR detection system (Bio-Rad) using iQ SYBR green supermix and specific primers (Table 2). PCR was performed using 5ml of the diluted cDNA (1:50) mixed with 200 nM of each primer in a final volume of 15ml. The PCR protocol was initiated at 95uC for 90 s for initial denaturation of the cDNA and activation of the hot-start iTaq TM DNA polymerase, followed by a two-step amplification program (20 s at 95uC and 30 s at specific primer hybridization temperature) repeated 40 times. At the end of the last amplifica-tion cycle, melting curves (temperature gradient at 0.5uC/10 s from 55 to 94uC) were systematically monitored to confirm the specificity of the amplification reaction. Each PCR run included replicate samples (duplicate of reverse transcription and PCR amplification, respectively) and negative controls (reverse tran-scriptase and RNA free samples, respectively). The qPCR assay
was optimized with a linear standard curve (R2.0.985) and checked for consistency across replicates. PCR reaction efficiency for each run was estimated based on the slope of the 5 points standard curve obtained with serial dilution of pooled sample cDNAs. E values ranging from 1.85 to 2.05 were considered to be acceptable. The transcripts analyzed were sodium dependent glucose co-transporter type 1 (SGLT1), glucose facilitative transporter type 2 and 4 (GLUT2, GLUT4) for glucose transport/uptake; microsomal triglyceride transfer protein (MTP), apolipoproteins B, A1 and A4 (ApoB, ApoA1, ApoA4) for chylomicron synthesis; lipoprotein lipase (LPL; EC 3.1.1.34), very low density lipoprotein receptor (VLDLR) and fatty acid translocase (CD36) for lipid uptake; glucokinase (GK; EC 2.7.1.2) and hexokinase (HK; EC 2.7.1.1) for glycolysis; glucose 6-phosphatase (G6Pase; EC 3.1.3.9) for gluconeogenesis; glucose 6-phosphate dehydrogenase (G6PD; EC 1.1.1.49), adenosine triphosphate citrate lyase (ACLY; EC 2.3.3.8), acetyl coA carboxylase (ACC; EC 6.4.1.2), fatty acid synthase (FAS; EC 2.3.1.85) and D9 fatty acyl desaturase (D9D; EC 1.14.19.1) for lipogenesis; D6 fatty acyl desaturase (D6D; EC 1.14.19.3), elongation of very long chain fatty acids like 5 and 2 (Elovl5, Elovl2; EC 2.3.1.199) for fatty acid bioconversion; carnitine palmitoyl transferase (CPT1; EC 2.3.1.21) for fatty acid oxidation; sterol regulatory element binding protein 1c (SREBP1c) and peroxisome proliferator-activated receptor (PPAR) for transcrip-tional regulatory factors. When different isoforms of a gene were known in rainbow trout (as for G6Pase, CPT1 and PPAR), gene expression analysis was performed on each isoform. 18 S ribosomal RNA (18 S) was employed as a non-regulated reference gene and it was found to be stably expressed in this study. Relative quantification of target gene expression was performed using the mathematical model described by Pfaffl [26], after correcting for reaction efficiency (efficiency-calibrated model).
Total lipids and fatty acids analyses
Total lipids of the muscle and liver samples were extracted according to Folch et al. [27], using dichloromethane instead of chloroform as the solvent and quantified gravimetrically. Fatty acid composition was determined on the total lipid extract. Fatty acid methyl esters were prepared by acid-catalysed transmethyl-ation of total lipids using boron trifluoride (BF3) in methanol (14%) according to Shantha and Ackman [28]. They were analysed in a Varian 3800 gas chromatograph (Varian, Les Ulis, France). The chromatograph was equipped with a DB Wax fused silica capillary column (30 m60.25 mm internal diameter, film thickness 0.25mm; J & W Scientific, Folsom, CA, USA). Injection was made in a split mode (ratio 1:40) with 1mL injected. Injector and flame ionization detector temperatures were 260 and 250uC, respectively. Helium was used as carrier gas (1 ml/min) and the thermal gradient during separation was 100 to 180uC at 8uC/min, 180 to 220uC at 4uC/min and a constant temperature of 220uC during 20 min. Fatty acid methyl esters were identified by comparison with known standard mixtures (Sigma189-19, St Louis, MO, USA) and quantified using the STAR computer package (Varian).
Statistical analysis
When diet x line interaction was significant, means were compared using one way ANOVA.
Results
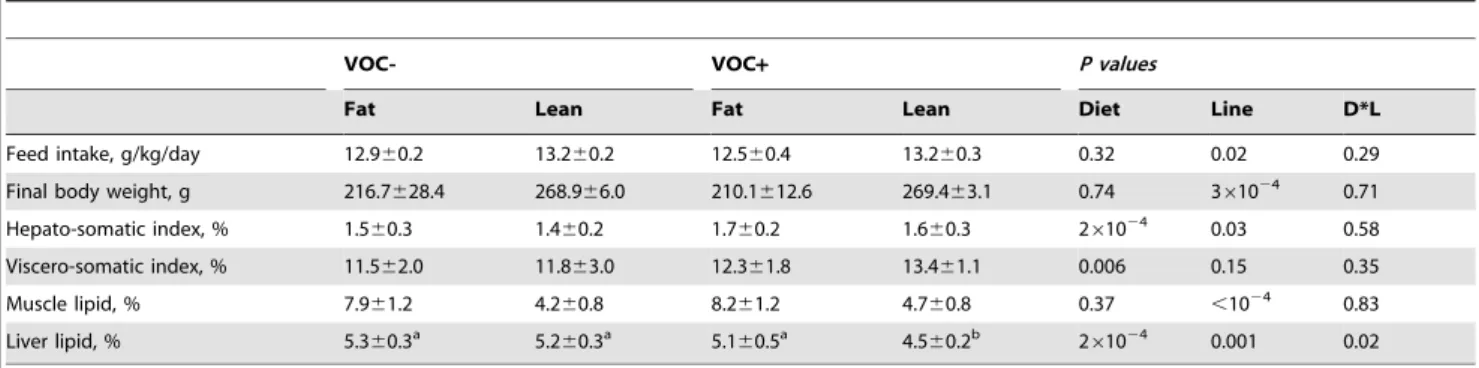
Feed intake was slightly higher in the L line than the F line, irrespective of the diet (Table 3). Correspondingly, the L line fish were heavier at the end of the feeding trial, than those of the F line. The VOC+diet was associated with an increase in the weight of liver and viscera in both lines. Hepato-somatic index was higher in the F line, regardless of the diet.
Plasma metabolite levels
Plasma metabolite levels at 2 and 8 h after the meal are summarized in table 4. The intake of VOC+ diet caused a moderate but significant hyperglycemia in both lines, as compared to the VOC- diet. Temporal differences were not observed in any
group. Nevertheless, the F line fish seemed to have a slightly better control of glycemia at 8 h after the carbohydrate rich meal. Triglyceride levels were found to be elevated in the plasma at 8 h in all the groups, particularly more in the L line than the F line, regardless of the diet. Dietary carbohydrate intake (VOC+) was linked to an increase in plasma cholesterol levels at 2 h after the meal.
mRNA levels of target genes
We analyzed the expression of several marker genes encoding the proteins involved in absorption, metabolism and uptake of glucose and fatty acids, to elucidate the effect of dietary carbohydrate on the molecular regulation of intermediary metabolism in the two trout lines fed a vegetable oil based diet lacking n-3 LC-PUFA. Representing intestinal nutrient absorp-tion, the results of glucose transporters and chylomicron assembly associated proteins are shown in figure 1. Among the two glucose Table 2.Primer sequences.
Gene Foward primer (59- 39) Reverse primer (59- 39) Database and Accession No.
Annealing Temperature,
oC Ampliconsize, bp
18 S CGGAGGTTCGAAGACGATCA TCGCTAGTTGGCATCGTTTAT GenBank AF308735 56 62
SGLT1 TCTGGGGCTGAACATCTACC GAAGGCATAACCCATGAGGA GenBank AY210436 59 154
GLUT2 GTGGAGAAGGAGGCGCAAGT GCCACCGACACCATGGTAAA GenBank AF321816 59 227
MTP CTCACTGACCACTCCCAGGT ATGGCTCCCTTGTTGTTGAC GenBank BX860503 55 152
ApoB CCCTGTCTTCAAAGCCACAC GTGGCGGGAGACACTCATAG GenBank CA383905 55 196
ApoA1 CGCAGGTACCCAGGCTTTTC AATGGACCTCTGTGCGGTCA GenBank AF042218 59 115
ApoA4 AGCTGGGACAGGATGTCAAT AGACGCTCTCTCAGCACCTC GenBank CA363690 55 148
GK TGAAGGATCAGAGGTGGGTGATT GAAGGTGAAACCCAGAGGAAGC GenBank AF135403 59 253
HK1 CTGGGACGCTGAAGACCAGA CGGTGCTGCATACCTCCTTG GenBank AY864082 59 159
G6Pase1 CTCAGTGGCGACAGAAAGG TACACAGCAGCATCCAGAGC Sigenae tcay0019b.d.18_3.1.s.om.8 55 77
G6Pase2 TAGCCATCATGCTGACCAAG CAGAAGAACGCCCACAGAGT GenBank AF120150 55 82
G6PD CTCATGGTCCTCAGGTTTG AGAGAGCATCTGGAGCAAGT GenBank CA351434 59 176
ACLY CTGAAGCCCAGACAAGGAAG CAGATTGGAGGCCAAGATGT GenBank CA349411.1 60 149
ACC TGGAGCTCTACGCAGACAGA CTCCGGTGTACCAAGCTGTT Sigenae tcbk0010c.b.21_5.1.om.4 55 152
FAS TGATCTGAAGGCCCGTGTCA GGGTGACGTTGCCGTGGTAT Sigenae tcab0001c.e.06_5.1.s.om.8 60 161
D9D GCCGTCCGAGGGTTCTTCTT CTCTCCCCACAGGCACCAAG GenBank FP323026 60 204
SREBP1c GACAAGGTGGTCCAGTTGCT CACACGTTAGTCCGCATCAC GenBank CA048941.1 60 59
D6D AGGGTGCCTCTGCTAACTGG TGGTGTTGGTGATGGTAGGG Genbank AF301910 59 175
Elovl2 TGTGGTTTCCCCGTTGGATGCC ACAGAGTGGCCATTTGGGCG Sigenae FYV3OTN01A4WMI.s.om.10 59 146
Elovl5 GAACAGCTTCATCCATGTCC TGACTGCACATATCGTCTGG Genbank AY605100 59 149
CPT1a TCGATTTTCAAGGGTCTTCG CACAACGATCAGCAAACTGG GenBank AF327058 55 166
CPT1b CCCTAAGCAAAAAGGGTCTTCA CATGATGTCACTCCCGACAG GenBank AJ606076 55 149
CPT1c CGCTTCAAGAATGGGGTGAT CAACCACCTGCTGTTTCTCA GenBank AJ619768 59 187
CPT1d CCGTTCCTAACAGAGGTGCT ACACTCCGTAGCCATCGTCT GenBank AJ620356 59 154
PPARa* CTGGAGCTGGATGACAGTGA GGCAAGTTTTTGCAGCAGAT GenBank AY494835 54 195
PPARb* CTGGAGCTGGATGACAGTGA GTCAGCCATCTTGTTGAGCA GenBank AY356399 60 195
PPARc* GACGGCGGGTCAGTACTTTA ATGCTCTTGGCGAACTCTGT Genbank CA345564 60 171
GLUT4 GGCGATCGTCACAGGGATTC AGCCTCCCAAGCCGCTCTT GenBank AF247395 60 207
LPL TAATTGGCTGCAGAAAACAC CGTCAGCAAACTCAAAGGT GenBank AJ224693 59 164
VLDLR GTTTTGGACAGATGGGAGA AGCCTTCTCATTGCACCAGT GenBank BX077158 60 160
CD36 CCACTGAAGTTGAGCCATGA TGCTAGACTCATGCCGTGTC GenBank BX300637 60 121
transporters studied, GLUT2 transcripts were significantly en-hanced by dietary starch intake, but such an induction was not statistically significant for SGLT1 (P= 0.09). The mRNA levels of key proteins involved in intestinal chylomicron synthesis such as MTP, ApoA1 and ApoA4 were higher in the VOC+ dietary group. There was no difference between the two lines for these markers of nutrient absorption.
The impact of dietary starch intake on glucose metabolism is illustrated in figure 2. The glycolytic enzyme GK exhibited a strong transcriptional induction of several hundred fold in the liver of fish from both lines, when fed the VOC+ diet. However, no such response to dietary starch intake was noticed in the HK transcripts of muscle, adipose tissue and intestine. Isoforms of the gluconeogenic enzyme G6Pase showed differential dietary regu-lation in the liver, VOC+ diet down-regulated G6Pase1 mRNA levels, but up-regulated G6Pase2. The only genotypic variation observed in glucose metabolism, was in the liver transcript levels of the pentose pathway enzyme G6PD, which was higher in the F line than the L line (Fig. 3).
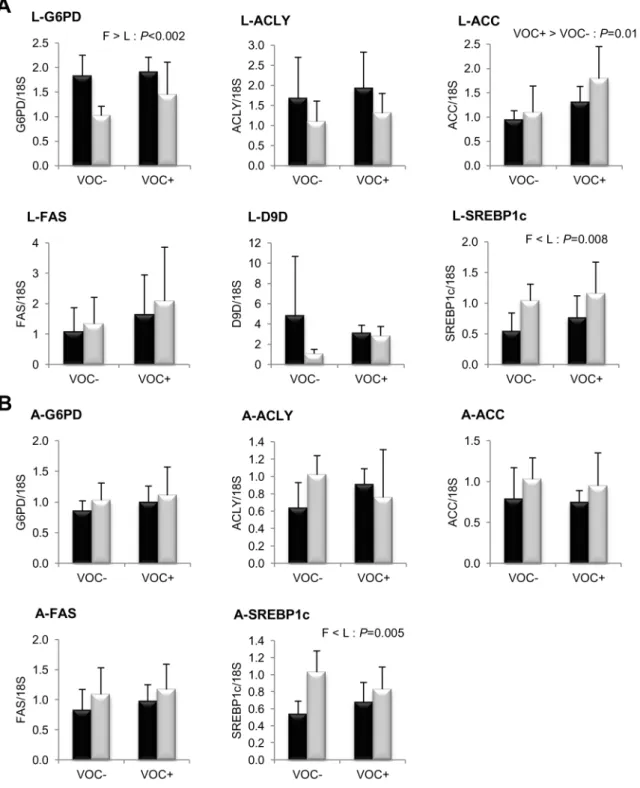
Concerning lipogenesis (Fig. 3), the mRNA levels of the key transcription factor SREBP1c was found to be significantly elevated in the liver (P= 0.008) and adipose tissue (P= 0.005) of the L line fish, irrespective of the diets. But this genotypic difference was not reflected in the transcript levels of FAS or the other lipogenic enzymes ACLY, ACC and D9D. In both lines, the
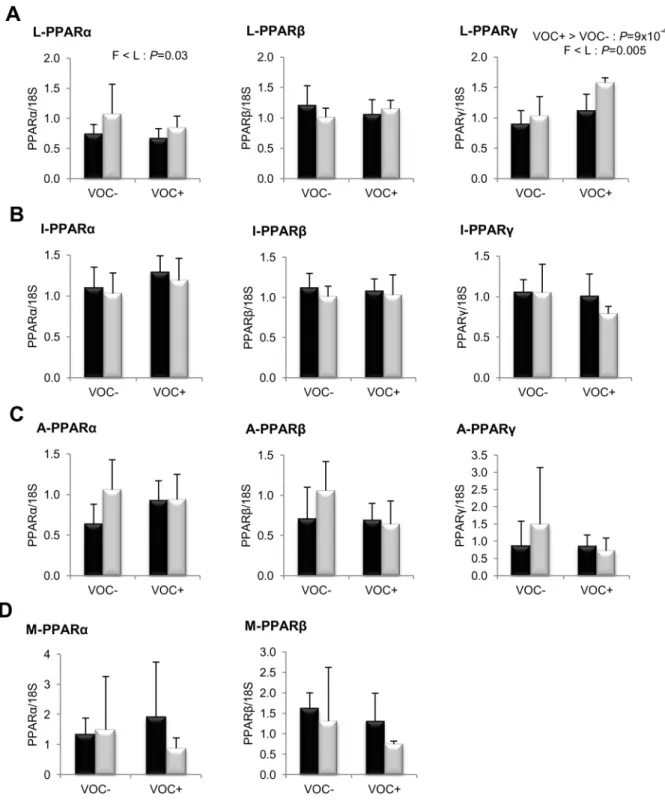
intake of VOC+ diet was found to enhance the expression of hepatic ACC, but not the other lipogenic enzymes. Regarding fatty acid bioconversion (Fig. 4), fish fed VOC+diet displayed a distinctly higher hepatic (P= 0.0002) and intestinal (P= 0.001) expression of the D6D enzyme than those fed the VOC- diet, regardless of the genotype. Likewise, mRNA levels of hepatic Elovl2 and intestinal Elovl5 were also found to be raised in the VOC+ dietary group. The expression of D6D was higher in the intestine of the L line than the F line fish, but this was not the case for the liver D6D and for the elongases. Results pertaining to fatty acid oxidation are presented in figure 5. The two lines experienced a contrasting dietary influence on their hepatic CPT1a transcript levels leading to a disordinal interaction, where VOC+diet up-regulates CPT1a levels in the L line and vice versa. The expression of the other hepatic isoform CPT1b was generally enhanced by the VOC+diet, but more pronounced in the L line. The mRNA levels of the transcription factor PPAR closely corresponded to the CPT1 expression (Fig. 6). Hepatic transcripts of both PPARaand PPARcwere more abundant in the L line and the VOC+diet was found to enhance the PPARc levels in both lines. In the other peripheral tissues, no significant differences related to either diet or genotype were observed in the CPT1 and PPAR transcripts tested. Moreover, the expression of PPARc was not detectable in the muscle.
Table 3.Feed intake, morphological indices and tissue lipid content.
VOC- VOC+ P values
Fat Lean Fat Lean Diet Line D*L
Feed intake, g/kg/day 12.960.2 13.260.2 12.560.4 13.260.3 0.32 0.02 0.29
Final body weight, g 216.7628.4 268.966.0 210.1612.6 269.463.1 0.74 361024 0.71
Hepato-somatic index, % 1.560.3 1.460.2 1.760.2 1.660.3 261024 0.03 0.58
Viscero-somatic index, % 11.562.0 11.863.0 12.361.8 13.461.1 0.006 0.15 0.35
Muscle lipid, % 7.961.2 4.260.8 8.261.2 4.760.8 0.37 ,1024 0.83
Liver lipid, % 5.360.3a 5.2
60.3a 5.1
60.5a 4.5
60.2b 2
61024 0.001 0.02
The data are represented as means6s.d. (N= 3 tanks for feed intake and body weight estimation;N= 9 individuals for morphological indices estimation;N= 6 individuals for tissue lipid analysis) and were analysed by two-way ANOVA (P,0.05) followed by Student–Newman–Keuls multiple comparison test.
doi:10.1371/journal.pone.0076570.t003
Table 4.Postprandial plasma metabolites.
Plasma metabolites VOC- VOC+ P values
Fat Lean Fat Lean Diet Line D*L
Glucose (mmol/L) 2 h 4.460.7 4.760.6 5.960.9 5.761.1 ,1024 0.95 0.41
8 h 5.160.8 5.360.8 5.761.0 7.562.4 0.006 0.05 0.09
Triglycerides (mmol/L) 2 h 1.260.7a 1.0
60.5a 1.6
60.9 1.560.9a 0.12 0.54 0.82
8 h 2.261.2b 3.2
61.7b 2.0
61.3 3.661.5b 0.83 0.01 0.61
Cholesterol (mmol/L) 2 h 4.261.1 4.560.5 5.061.1 5.761.3 0.005 0.13 0.47
8 h 4.461.2 4.961.6 5.061.5 5.261.3 0.33 0.43 0.81
Free amino acids (mg Eq. Glycine/ml)
2 h 0.560.1 0.560.06 0.560.08b 0.44
60.06b 0.08 0.24 0.74
8 h 0.560.1 0.560.07 0.460.04a 0.36
60.08a 0.003 0.19 0.70
Data are presented as means6s.d. (N= 9 individuals). At each postprandial time, the effect of diet, line and interaction were analysed by two-way ANOVA (P,0.05) followed by Student–Newman–Keuls multiple comparison test. Within each dietary treatment (column wise), significant differences in postprandial kinetics (2 h, 8 h after the last meal) are represented with different superscriptsa,b(one-way ANOVA,
Figure 1. Gene expression of intestinal membrane glucose transporters and proteins involved in chylomicron assembly.mRNA levels of sodium-dependent glucose co-transporter type 1 (SGLT1), glucose facilitative transporter type 2 (GLUT2), microsomal triglyceride transfer protein (MTP), apolipoprotein B (ApoB), apolipoprotein A1 (ApoA1) and apolipoprotein A4 (ApoA4) were measured using real-time quantitative RT-PCR in the intestine of rainbow trout from a fat line (F; black bar) and a lean line (L; grey bar) fed a diet without (VOC-) or with (VOC+) carbohydrate, 8 h after the last meal. Expression values are normalized by 18 S ribosomal RNA (18 S) expressed transcripts. Relative fold difference between treatments are presented as means +s.d. (N= 6 individuals) and were analyzed using two-way ANOVA followed by Student–Newman–Keuls test for multiple comparison. Differences were considered significant atP,0.05
doi:10.1371/journal.pone.0076570.g001
Figure 2. Gene expression of selected glycolytic and gluconeogenic enzymes.mRNA levels of glucokinase (GK), glucose-6-phosphatase isoform 1 (G6Pase1), isoform 2 (G6Pase2) and hexokinase (HK) were measured using real-time quantitative RT-PCR in the liver (row A); muscle (B), adipose tissue (C) and intestine (D) of rainbow trout from a fat line (F; black bar) and a lean line (L; grey bar) fed a diet without (VOC2) or with (VOC+) carbohydrate, 8 h after the last meal. Expression values are normalized by 18 S ribosomal RNA (18 S) expressed transcripts. Relative fold difference between treatments are presented as means+s.d. (N= 6 individuals) and were analyzed using two-way ANOVA followed by Student–Newman–Keuls test for multiple comparison. Differences were considered significant atP,0.05
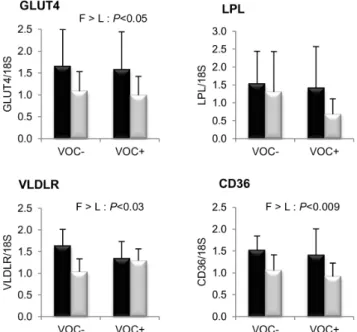
Finally, mRNA levels of proteins involved in glucose and fatty acid uptake in the muscle are presented in figure 7. Transcript levels of GLUT4, VLDLR and CD36 were found to be significantly higher in the F line than the L line. However, the
LPL expression was not different between the two lines. Dietary manipulation exerted no noticeable influence on the transcript abundance of these markers.
Figure 3. Gene expression of selected enzymes and transcription factor involved in NADPH generation and lipogenesis.mRNA levels of glucose 6-phosphate dehydrogenase (G6PD), ATP citrate lyase (ACLY), acetyl coA carboxylase (ACC), fatty acid synthase (FAS),D9 fatty acyl desaturase (D9D) and sterol regulatory element binding protein 1like (SREBP1c) were measured using realtime quantitative RTPCR in the liver (A -two rows) and adipose tissue (B - -two rows) of rainbow trout from a fat line (F; black bar) and a lean line (L; grey bar) fed a diet without (VOC2) or with (VOC+) carbohydrate, 8 h after the last meal. Expression values are normalized by 18 S ribosomal RNA (18 S) expressed transcripts. Relative fold difference between treatments are presented as means+s.d. (N= 6 individuals) and were analyzed using two-way ANOVA followed by Student– Newman–Keuls test for multiple comparison. Differences were considered significant atP,0.05
Figure 4. Gene expression of selected enzymes involved in fatty acid bioconversion.mRNA levels ofD6 fatty acyl desaturase (D6D), elongation of very long chain fatty acids like-2 (Elovl2) and elongation of very long chain fatty acids like-5 (Elovl5) were measured using real-time quantitative RT-PCR in the liver (row A) and intestine (row B) of rainbow trout from a fat line (F; black bar) and a lean line (L; grey bar) fed a diet without (VOC2) or with (VOC+) carbohydrate, 8 h after the last meal. Expression values are normalized by 18 S ribosomal RNA (18 S) expressed transcripts. Relative fold difference between treatments are presented as means+s.d. (N= 6 individuals) and were analyzed using two-way ANOVA followed by Student–Newman–Keuls test for multiple comparison. Differences were considered significant atP,0.05
doi:10.1371/journal.pone.0076570.g004
Figure 5. Gene expression of carnitine palmitoyl transferase (CPT1) isoforms involved in fatty acid oxidation.mRNA levels of CPT1a, CPT1b, CPT1c and CPT1d were measured using real-time quantitative RT-PCR in the liver (column A), muscle (column B) and adipose tissue (column C) of rainbow trout from a fat line (F; black bar) and a lean line (L; grey bar) fed a diet without (VOC2) or with (VOC+) carbohydrate, 8 h after the last meal. Expression values are normalized by 18 S ribosomal RNA (18 S) expressed transcripts. Relative fold difference between treatments are presented as means+s.d. (N= 6 individuals) and were analyzed using two-way ANOVA (P,0.05) followed by Student–Newman–Keuls test for multiple comparison. When interactions were significant, means were compared using one way ANOVA (P,0.05).
Lipid content and fatty acid composition
Muscle lipid content was invariably higher in the F line, with no diet induced modification (Table 3). The liver lipid content witnessed an interaction between the dietary treatment and genotype, with a marked decrease in the L line fish fed the
VOC+diet. The fatty acid profiles of the two isolipidic diets are presented in table 5. The proportional content of the saturated and unsaturated fatty acids did not vary considerably between the two diets. However, there were minor differences such as slightly lower linoleic acid and higher linolenic acid in the VOC+ diet. Figure 6. Gene expression of peroxisome proliferator activated receptor isoforms.mRNA levels of PPARa, PPARband PPARc were measured using real-time quantitative RT-PCR in the liver (row A), intestine (row B), adipose tissue (row C) and muscle (row D) of rainbow trout from a fat line (F; black bar) and a lean line (L; grey bar) fed a diet without (VOC2) or with (VOC+) carbohydrate, 8 h after the last meal. Expression values are
normalized by 18 S ribosomal RNA (18 S) expressed transcripts. Relative fold difference between treatments are presented as means+s.d. (N= 6 individuals) and were analyzed using two-way ANOVA followed by Student–Newman–Keuls test for multiple comparison. Differences were considered significant atP,0.05
The muscle fatty acid composition in both lines closely reflected the profile of the respective diet consumed (Table 6). There was no evidence for a positive influence of the VOC+diet on the muscle PUFA content of the two trout lines. In terms of genotypic difference, the L line had a slightly higher proportion of PUFA (DHA) than the F line, but exactly the opposite was observed for the MUFA proportion. Considering the divergent selection criterion applied, the F line possessed a substantially larger quantity of unsaturated and saturated fatty acids per gram of muscle (Table 7). Similar to the muscle, the fatty acid profile of the liver resembled the respective dietary profile (Table 8). Further-more, the n-3 PUFA (DHA) content of the liver exhibited a significant diet x genotype interaction, where it was typically lower in the F line fish fed the VOC- diet. Apart from this, no other differences were significant.
Discussion
In the present study, we investigated the molecular and phenotypic response of two rainbow trout lines (fat and lean) to a vegetable oil based diet either with or without gelatinized starch.
Effect of dietary carbohydrates in fish fed with vegetable oils
The absolute difference in carbohydrate intake (1.8%vs.17.1%) between the two dietary groups as compared to protein intake (always above the requirement) enables us to consider that majority of the effects are linked to carbohydrate intake. When
included at an acceptable level (20%) in the diet, carbohydrate (gelatinised starch) had no adverse impact on feed intake and growth. However, feeding of dietary carbohydrate caused a relatively moderate postprandial hyperglycemia that lacked temporal induction following a single meal, probably due to long term adaptation. These findings corroborate our previous observations in the two trout lines [23]. Likewise, the intake of dietary carbohydrate resulted in a proportionately heavier liver and viscera, which can be attributed to increased glycogen and fat deposition, respectively [29]. The phenotypic observations thus suggest the influence of dietary carbohydrate on the metabolism of the fish. Endorsing this, molecular analysis revealed a well-known mammalian response in hepatic glucose metabolism that includes strong induction of glycolytic GK transcripts and reciprocal reduction of gluconeogenic G6Pase1 transcripts, the latter being unusual in trout [30–32]. Specifically in these lines, the first isoform of G6Pase is known to respond to nutritional (refeeding) regulation [22]. There were also a few ambiguities related to dietary starch intake such as the contrasting response of intestinal glucose transporters (inert SGLT1 and enhanced GLUT2) that Figure 7. Gene expression of selected proteins involved in
glucose and lipid uptake in the white muscle. mRNA levels of glucose facilitative transporter type 4 (GLUT4), lipoprotein lipase (LPL), very low density lipoprotein receptor (VLDLR) and fatty acid translocase (CD36) were measured using real-time quantitative RT-PCR in the muscle of rainbow trout from a fat line (F; black bar) and a lean line (L; grey bar) fed a diet without (VOC2) or with (VOC+) carbohydrate, 8 h
after the last meal. Expression values are normalized by 18 S ribosomal RNA (18 S) expressed transcripts. Relative fold difference between treatments are presented as means+s.d. (N= 6 individuals) and were analyzed using two-way ANOVA followed by Student–Newman–Keuls test for multiple comparison. Differences were considered significant at P,0.05
doi:10.1371/journal.pone.0076570.g007
Table 5.Fatty acid profile of diets expressed as % of total fatty acids.
Fatty acids VOC2 VOC+
SFA
14:0 1.4 0.8
16:0 15.5 14.8
17:0 0.1 0.1
18:0 3.0 3.3
20:0 0.3 0.3
gSFA 20.4 19.5 MUFA
16:1 1.1 0.6
18:1 28.1 31.7
20:1 2.5 1.8
22:1 3.2 2.2
gMUFA 34.9 36.4 n-6 PUFA
18:2 n-6 13.9 13.0
20:2 n-6 0.1 0.1
20:4 n-6 0.1 0.1
gn-6 PUFA 14.1 13.1
n-3 PUFA
18:3 n-3 23.4 25.8
18:4 n-3 0.4 0.3
20:3 n-3 0.1 0.05
20:4 n-3 0.1 0.1
20:5 n-3 1.4 0.9
22:5 n-3 0.1 0.1
22:6 n-3 2.9 1.9
gn-3 PUFA 28.5 29.1
Ratios
SFA/PUFA 0.5 0.5
n3/n6 2.0 2.2
cannot validate an improvement in glucose uptake [33]. More-over, the unaltered HK and GLUT4 expression in the muscle and adipose tissue reiterates the recognized poor ability of the peripheral tissues to adapt to high influx of glucose through the diet [34–36]. Therefore in brief, this study confirms the significant influence of dietary carbohydrate intake on glucose metabolism in the liver but not in the peripheral tissues, as evidenced before [23]. Consumption of a diet rich in carbohydrates is known to stimulate the lipogenic pathway through transcriptional mecha-nisms linked to enhanced glucose metabolism. This flux depends also on the availability of cofactors such as NADPH produced by the pentose phosphate pathway and lipogenic substrates [17,37]. Our previous study in these two lines clearly demonstrated the existence of the above phenomenon through an increase in the hepatic transcript abundance of GK followed by enhanced mRNA levels and activity of G6PD (involved in the production of
NADPH), ACLY transcripts (involved in the transition of glycolytic carbon to lipogenic substrates) and FAS activity (key enzyme ofde novolipogenesis) [23]. However in the present study, despite the huge induction of GK, dietary influence was conspicuously absent in all of the above mentioned lipogenic enzyme transcripts. The main causal differences can be dietary changes related to fish oil replacement [8] or physiological changes related to the larger size of the fish [38]. The only notable exception was carbohydrate intake enhanced ACC expression, which might have prevailed due to the presence of glucose response element in their promoter region as seen in mammals [37]. The unaltered plasma triglyceride levels of the carbohydrate fed group seemed to be related to the lipogenic profile rather than the potentially elevated intestinal lipid uptake, which is indicated by the transcript abundance of key chylomicron assembly proteins (MTP, ApoA1 and ApoA4). On the contrary, we found a Table 6.Fatty acid profile of muscle expressed as % of total fatty acids.
Fatty acids VOC2 VOC+ Pvalue
Fat Lean Fat Lean Diet Line Diet*Line
SFA
14:0 1.7260.38 1.3760.26 1.6760.27 1.3960.20 0.92 0.01 0.80
16:0 12.3261.37 12.6961.33 11.9160.74 12.3260.46 0.37 0.37 0.97
17:0 0.1360.01 0.1160.01 0.1160.01 0.1160.01 0.01 0.02 0.16
18:0 2.9760.30 3.2360.13 2.9060.22 3.1160.22 0.33 0.02 0.77
20:0 0.1760.02 0.1760.02 0.1960.03 0.1760.01 0.10 0.18 0.28
gSFA 17.4961.61 17.7461.59 16.9660.82 17.2660.53 0.33 0.59 0.96
MUFA
16:1 2.2960.43 1.6560.35 2.2560.27 1.7060.24 0.97 361024 0.73
18:1 29.9960.7b 27.50
60.9a 30.45
60.9b 29.44
61.1b 0.003 ,1024 0.05
20:1 2.7560.17 2.6460.32 2.7360.33 2.5560.08 0.58 0.18 0.72
22:1 2.3160.36 2.4060.39 2.5660.43 2.3260.21 0.56 0.64 0.27
gMUFA 37.3360.65 34.1961.41 37.9960.62 36.0161.35 0.01 ,1024 0.20
n-6 PUFA
18:2 n-6 12.4960.61 12.0160.39 11.1960.60 11.0560.52 ,1024 0.17 0.45
18:3 n-6 0.2360.04 0.2360.03 0.1960.03 0.1960.03 0.01 0.91 0.99
20:2 n-6 0.6360.05 0.6460.11 0.5360.09 0.5160.05 0.003 0.96 0.67
20:3 n-6 0.3060.02a 0.36
60.06b 0.28
60.04a 0.27
60.02a 9
61024 0.06 0.03
20:4 n-6 0.3560.03 0.4060.02 0.3360.04 0.3760.04 0.04 0.002 0.72
gn-6 PUFA 14.0460.62 13.7260.33 12.6160.53 12.3960.51 ,1024 0.21 0.81
n-3 PUFA
18:3 n-3 13.0760.47 14.0760.32 14.0261.02 15.2260.56 861024 5
61024 0.72
18:4 n-3 1.4060.13 1.4560.11 1.4460.24 1.4560.22 0.81 0.67 0.80
20:3 n-3 0.7960.11 0.8960.17 0.8560.16 0.8260.11 0.91 0.51 0.29
20:4 n-3 1.0060.16 1.1560.27 1.1360.18 0.9260.08 0.49 0.75 0.03
20:5 n-3 2.4360.32 2.3460.18 2.3060.41 2.3960.15 0.73 0.97 0.45
22:5 n-3 1.0560.25 0.8960.07 1.1260.24 0.9760.06 0.31 0.04 0.99
22:6 n-3 8.4760.92 10.9461.33 8.7561.13 9.9461.47 0.48 0.002 0.22
gn-3 PUFA 28.4861.25 32.0061.64 29.8960.80 31.8061.16 0.25 ,1024 0.13
Ratios
SFA/PUFA 0.4160.05 0.3960.04 0.3960.02 0.3960.01 0.72 0.33 0.63
n3/n6 2.0360.11 2.3360.14 2.3860.15 2.5760.19 1024 5
61024 0.39
The data are presented as means6s.d. (N= 6 individuals) and were analysed by two-way ANOVA (P,0.05) followed by Student–Newman–Keuls multiple comparison test.a,bMean values not sharing a common letter are significantly different from each other (one way ANOVA,
paradoxical increase in the plasma cholesterol levels after carbohydrate intake. Considering the isolipidic nature of the two diets and neutral triglyceride levels, it is difficult to interpret this atypical link between carbohydrate intake, chylomicron synthesis and cholesterol metabolism [39]. Another contradiction related to fatty acid oxidation is the enhanced expression of hepatic CPT1b following carbohydrate intake. Normally in higher vertebrates, fatty acid oxidation and glucose oxidation/lipogenesis are known to be reciprocally regulated, because the provision of glucose inhibits fatty acid oxidation [40]. Further, the parallel higher expression of ACC and CPT1b are unusual even if at the transcriptional level, considering the fact that malonyl-CoA (product of ACC) is an inhibitor of CPT1. But, such paradoxical imbalance in the regulation of lipogenesis and lipid oxidation pathway has been previously reported in trout after insulin infusion [41]. Overall our results in hepatic lipid metabolism disagree with well known effects of carbohydrate intake, suggesting a disturbance characterized by unexplained shift from fatty acid storage to oxidation. In the peripheral tissues, dietary manipula-tion yet again had no influence on lipid metabolism, reasserting their unresponsiveness to carbohydrate intake [23].
Fatty acid desaturases and elongases are key enzymes of the fatty acid bioconversion pathway, which can influence whole body lipid composition. Dietary carbohydrate intake enhanced the transcription of key desaturase (D6D) and elongase (Elovl5 and Elovl2) enzymes involved in LC-PUFA synthesis, in both these lines, in agreement with few other mammalian and fish studies [10,42–44]. The influence of carbohydrates on these enzymes can be effected through certain critical nodes such as an increased production of essential reducing power in the form of NADPH related to G6PD [45,46]; availability of substrate for elongase in the form of malonyl-CoA related to ACC [47]; insulin action mediating the effect of glucose through transcriptional factors and presence of glucose response elements in the promoter regions of the encoding genes [42,48,49]. Out of which, we observed an increase in the hepatic expression of ACC and PPARcassociated to carbohydrate intake. PPARs are a family of nuclear receptors that regulates lipid and glucose metabolism, allowing adaptation to the prevailing nutritional environment. Especially, PPAR activa-tion is known to promote glucose utilizaactiva-tion and D6D gene is known to contain a PPAR response element [50]. In mice, the activation of PPARc reportedly increases glycolysis, fat storage, fatty acid desaturation, elongation and restore insulin sensitivity [51]. For the first time, we provide evidence that piscine PPARc acts similar to their mammalian counterpart, thereby ruling out
previous speculations of functional divergence [52]. Other transcriptional factors such as SREBP-1 and PPARathat play a major role in the regulation of LC-PUFA synthesis [53,54] were not influenced by carbohydrate intake. As we observed, nutritional regulation of fatty acid bioconversion enzymes independent of changes in SREBP-1 and PPARahave been previously reported in rats [55]. Based on our results, PPARc seems to be the key transcription factor that mediates the carbohydrate induced response of desaturase and elongase enzymes in the liver, but not in the intestine, suggesting tissue specific regulation [56]. On the other hand, it is important to note that previously when the two lines were fed carbohydrates as part of fish oil based diet, transcriptional stimulation of D6D, Elovl5 and Elovl2 were absent probably as a result of higher LC-PUFA content and associated feedback inhibition [23,24]. Therefore, the induction that we find now is in fact an amplified response due to the presence of carbohydrate in conjunction with the reduced content of n-3 LC-PUFA in the diet, which indeed validates our hypothesis at the transcriptional level. Though the exact mechanisms are unknown, changes in dietary fatty acid composition (chain length and desaturation) and subsequently altered cellular metabolism as a result of energy substrate crosstalk is the most likely explanation.
Concerning fatty acid phenotype, we found no increase in the n-3 LC-PUFA content of the flesh corresponding to the molecular augmentation of desaturase/elongase expression in the liver and intestine. Instead, they closely resembled the fatty acid profile of the respective diet consumed, as commonly observed [4]. It is well known that the fatty acid composition of an animal depends not only on desaturation/elongation, but also on other interacting aspects of lipid metabolism such as b-oxidation, substrate availability, tissue uptake and hormonal status [4,42,57]. High levels of oxidation of C18PUFA, which subsequently allows only small proportions for bioconversion, can be one possible explanation [58]. The elevated CPT1b expression in the carbohydrate fed group coincides with this hypothesis. The uptake and selective incorporation of fatty acids in the cellular fractions of the muscle can also have significance in the final lipid composition [59,60]. The expression of muscle lipid uptake markers, namely LPL, VLDLR and CD36 suggests no diet induced differences in fatty acid uptake. Besides, the impact of post-transcriptional modifications and related changes in enzyme activity on the final fatty acid profile is not known, as most of our data represent only the transcriptional changes. Eventually, the hypothesized additive influence of dietary carbohydrate and low n-3 LC-PUFA content Table 7.Fatty acid content of muscle expressed as mg/g of muscle (wet weight).
Fatty acids VOC2 VOC+ Pvalue
Fat Lean Fat Lean Diet Line Diet*Line
SFA 14.063.3 7.461.1 13.861.5 8.061.3 0.77 ,1024 0.64
MUFA 29.664.9 14.362.8 31.164.9 16.863.6 0.24 ,1024 0.77
n-6 PUFA 11.161.5 5.761.1 10.361.2 5.861.2 0.49 ,1024 0.41
20:5 n-3 1.960.2 1.060.2 1.960.5 1.160.2 0.60 ,1024 0.62
22:6 n-3 6.660.7 4.661.1 7.261.9 4.560.4 0.56 ,1024 0.50
n-3 PUFA 22.462.5 13.462.7 24.564.2 14.762.1 0.17 ,1024 0.76
n3/n6 2.0360.11 2.3360.14 2.3860.15 2.5760.19 1024 5
61024 0.39
The data are presented as means6s.d. (N= 6 individuals) and were analysed by two-way ANOVA followed by Student–Newman–Keuls multiple comparison test. Differences were considered statistically significant atP,0.05
(vegetable oil) on PUFA biosynthesis was evident at the molecular level, but did not elaborate into a beneficial fatty acid phenotype.
Effect of fat and lean genotypes in fish fed with vegetable oils
The superior growth performance of the L line as compared to the F line was known to be an outcome of improved feed efficiency and protein utilization, whereas the voluntary feed intake used to be the same under a fish oil based dietary regime [21,23,61]. But with the switch to vegetable oil based diet in the present study, the L line consumed slightly more feed than the F line irrespective of the carbohydrate content and thereby exhibited more pronounced increase in body weight. Such genotype specific preferential acceptance of vegetable oil diet adds to the basic understanding
that trout can discriminate between feeds with different oil sources [62].
Concerning glucose metabolism, the F line showed a marginal but significantly lower postprandial plasma glucose levels (8 h) than the L line, following a high carbohydrate meal. There are two possible reasons, one is enhanced storage of excess glucose as glycogen as suggested by the higher hepato-somatic index of the F line fish and the other is increased glucose uptake in the white muscle of F line as evidenced by GLUT4 transcript abundance. These observations corroborate the better glycemic control and improved muscle glycolysis in the F line, reported under standard (10%) carbohydrate regime [21,22]. However in our preceding study with high level of carbohydrates given as part of fish oil based diet, contradictorily, the F line did not exhibit an improved Table 8.Fatty acid profile of liver expressed as % of total fatty acids.
Fatty acids VOC2 VOC+ Pvalue
Fat Lean Fat Lean Diet Line Diet*Line
SFA
14:0 0.6260.16 0.4160.10 0.6160.08 0.5660.08 0.14 0.01 0.08
16:0 16.3961.54 14.3162.22 14.8361.89 15.1561.70 0.64 0.25 0.12
17:0 0.1360.02 0.1360.01 0.1160.02 0.1260.01 0.21 0.44 0.35
18:0 6.6760.92 6.6360.31 6.5460.84 6.5260.47 0.67 0.91 0.96
20:0 0.1560.01 0.1960.03 0.1660.04 0.1760.02 0.51 0.04 0.17
gSFA 24.0761.22 21.7662.27 22.3361.54 22.6361.51 0.52 0.15 0.07
MUFA
16:1 0.8260.17 0.6060.15 0.8060.28 0.7460.13 0.47 0.08 0.31
18:1 14.3661.50 13.1760.66 14.2562.10 14.1961.18 0.45 0.31 0.36
20:1 1.7860.80 1.6860.45 1.7960.66 1.7460.35 0.89 0.76 0.91
22:1 0.5660.32 0.6060.18 0.7060.18 0.7760.63 0.31 0.73 0.93
gMUFA 17.5262.15 16.0460.78 17.5462.23 17.4361.27 0.32 0.27 0.34
n-6 PUFA
18:2 n-6 5.5360.84 5.5760.27 4.9060.74 5.0460.55 0.03 0.74 0.87
18:3 n-6 0.2160.09 0.2360.04 0.1360.03 0.1660.04 0.003 0.19 0.81
20:2 n-6 1.0360.54 0.9760.32 0.8760.29 0.8960.21 0.41 0.88 0.76
20:3 n-6 1.1760.24 1.3160.30 1.2860.36 1.0060.16 0.39 0.55 0.08
20:4 n-6 2.2560.19 2.5860.54 1.8560.16 2.4960.29 0.08 0.001 0.26
22:2 n-6 0.0860.05 0.0960.03 0.1060.03 0.1060.02 0.20 0.86 0.52
gn-6 PUFA 10.2660.46 10.7460.26 9.1460.77 9.6760.27 ,1024 0.02 0.89
n-3 PUFA
18:3 n-3 4.0060.61 3.8560.53 4.5660.87 4.4760.85 0.06 0.68 0.93
18:4 n-3 0.9360.69 0.7860.24 0.7460.31 0.8060.33 0.61 0.78 0.56
20:3 n-3 0.8860.41 0.8260.26 0.9260.23 0.8560.22 0.74 0.58 0.93
20:4 n-3 0.8960.35ab 1.0
60.46ab 1.41
60.47a 0.72
60.15b 0.45 0.08 0.02
20:5 n-3 4.7861.11 4.9560.81 3.8360.53 4.8660.75 0.13 0.08 0.20
22:5 n-3 0.8760.46 1.1460.19 1.3160.36 1.4660.38 0.02 0.16 0.68
22:6 n-3 28.8861.68 33.6563.35 32.5264.11 32.0762.71 0.42 0.10 0.05
gn-3 PUFA 41.262.4b 46.2
63.36a 45.3
63.3ab 45.2
62.5a 0.20 ,0.05 0.04
Ratios
SFA/PUFA 0.4760.04a 0.38
60.06b 0.4
60.04ab 0.4
60.04ab 0.48
,0.05 0.04
n3/n6 4.0260.26 4.3060.30 5.0160.78 4.6860.33 0.002 0.89 0.13
The data are presented as means6s.d. (N= 6 individuals) and were analysed by two-way ANOVA (P,0.05) followed by Student–Newman–Keuls multiple comparison test.a,bMean values not sharing a common letter are significantly different from each other (one way ANOVA,P,0.05).
glycemic regulation despite having a higher ability to store excess glucose in the liver as glycogen or fat. Weaker control over hepatic endogenous glucose production in the F line was suggested to outdo its higher glycolytic ability [23]. This genotypic difference in glycolysis and gluconeogenesis disappeared under the vegetable oil based dietary regime in the present study, but it is hard to give substantial explanation for cause or consequence.
In previous studies, transcriptional analysis (after feeding fish oil based diets with or without carbohydrates to the two trout lines) demonstrated the higher potential of the F line in intestinal lipid uptake, hepaticde novofatty acid synthesis (further enhanced by dietary carbohydrates) and fatty acid bioconversion in both liver and intestine [23,24]. We hypothesized that replacing fish oil with vegetable oil may augment this genetic potential of the F line because vegetable oil lacks n-3 LC-PUFA, the critical component in fish oil responsible for down regulating the genes encoding enzymes involved in lipogenesis and fatty acid bioconversion [54,57,63]. But contrary to our expectation, changing the dietary lipid source eliminated the genetic advantage of the F line in chylomicron synthesis, lipogenesis as well as fatty acid desaturation and elongation. The only exception was the consistently higher hepatic expression of the pentose pathway enzyme G6PD in the F line, irrespective of changes in dietary composition across studies [22,23,64]. So this enzyme connecting glucose and lipid metab-olism may be a key marker of the fat muscle genotype.
On the other hand, we noticed few reversals in genotypic differences in the presence of dietary vegetable oil, the most prominent being the circulating triacylglycerol (TAG) phenotype. The previously reported higher plasma TAG linked to enhanced lipogenic ability in the F line [23] was inversely lowered in the F line, together with the annulation of genotypic difference in lipogenesis. A study in Atlantic salmon suggested that the differences between families in plasma TAG levels were influenced by peripheral tissue uptake rather than hepatic lipid metabolism, relating it to their lipid storage phenotype [65]. Correspondingly in the present study, the lower plasma TAG of the F line could be associated to the higher uptake of lipids in the muscle (adipocytes) as indicated by the transcript abundance of VLDLR, a receptor mediating internalisation and clearance of lipoproteins and CD36, a fatty acid translocase that determines long chain fatty acid uptake and lipid metabolism. The increased level of transcripts encoding the VLDLR and CD36 in the F line has already been reported, identifying them (and not LPL) as relevant molecular markers for fat deposition and circulating lipid uptake in the white muscle of rainbow trout [66]. A second reversal was evident in the transcriptional factor SREBP1c, which was higher in the liver and adipose tissue of the L line after fish oil replacement [23]. But, this activation was not accompanied by downstream changes in the lipogenic enzymes. Key factors regulating multiple facets of hepatic lipid metabolism such as SREBP1c, PPARaand PPARc was uniformly up-regulated in the L line. But in target response, except for a higher expression of hepatic CPT1b in the L line related to PPARaactivation, no other correlation was noticeable. Recent data suggest that n-3 LC-PUFA content of the flesh is a highly heritable trait in salmonids [18]. Fatty acid deposition and
the activity of the bioconversion pathway are also known to be dependent on the genetic background of the fish [5,67,68]. However, changes in dietary lipid source (i.e., vegetable oil) can alter the genetic potential; the magnitude and direction of response varies between family groups [19,56]. In accordance, we found that the inherently higher fatty acid bioconversion ability of the F line was eliminated or reversed (intestinal D6D) after replacing fish oil with vegetable oil [23,24,64]. But the key enzymes (desaturase and elongases) and transcriptional factors (PPARs and SREBP1c) were not coordinately regulated in both lines to portray a defined pattern of expression with biological significance. At the pheno-typic level, dietary vegetable oil did not affect the higher muscle lipid content (selection criterion) of the F line and thus it retained greater quantity of saturated and unsaturated fatty acids in absolute terms, unlike in salmon where differences in muscle lipid content between the fat and lean genotype reportedly diminished in 100% vegetable oil fed group [5]. Nevertheless in relative terms, the n-3 LC-PUFA content of the F line flesh was slightly lower than the L line. This suggests that the L line may have higher responsiveness to low dietary n-3 LC-PUFA, up-regulating the biosynthetic pathway when fed diets with vegetable oil. Overall, our results emphasize that the vegetable oil based dietary regime alters lipid metabolism depending on the genetic background and the LC-PUFA biosynthesis pathway showed no pertinent geno-typic difference when assessed by gene expression and fatty acid composition.
Conclusion
This study demonstrates that carbohydrate intake when coupled with lower dietary content of n-3 LC-PUFA (vegetable oil) promotes the inherent LC-PUFA biosynthetic pathway, regardless of the genetic background of the fish. At the molecular level, this was confirmed by the enhanced transcriptional response of key desaturase and elongase enzymes, mediated through the PPARc regulatory factor in the liver of both lines; however, the final fatty acid profile of the flesh did not evidence a correlative augmen-tation of LC-PUFA content. Moreover, the documented genetic pre-disposition of higher fatty acid bioconversion in the fat genotype disappeared under the vegetable oil based diet regime. Dietary macro-nutrient interface is thus a critical aspect to be deliberated during the progressive shift towards plant based feeds and while analyzing nutrient6genotype interactions.
Acknowledgments
We thank V. Assele Koghe, M. J. Borthaire, E. Plagnes-Juan and A. Surget for technical assistance in the laboratory. We also acknowledge Y. Hontang, F. Sandres, and F. Terrier for conducting the feeding trial and P. Maunas for conserving the trout lines.
Author Contributions
Conceived and designed the experiments: SP FM GC. Performed the experiments: BSK LL. Analyzed the data: BSK SP FM GC. Wrote the paper: BSK SP.
References
1. Simopoulos AP (1999) Essential fatty acids in health and chronic disease. Am J Clin Nutr 70: 560S–569S.
2. Calder PC, Yaqoob P (2009) Omega-3 polyunsaturated fatty acids and human health outcomes. Biofactors 35: 266–272.
3. Sargent JR, Tocher DR, Bell JG (2002) The lipids. In: Halver JE, Hardy RW, editors. Fish Nutrition. San Diego: Academic press, Elsevier. pp. 181–257. 4. Turchini GM, Torstensen BE, Ng WK (2009) Fish oil replacement in finfish
nutrition. Rev Aquacult 1: 10–57.
5. Bell JG, Pratoomyot J, Strachan F, Henderson RJ, Fontanillas R, et al. (2010) Growth, flesh adiposity and fatty acid composition of Atlantic salmon (Salmo salar) families with contrasting flesh adiposity: Effects of replacement of dietary fish oil with vegetable oils. Aquaculture 306: 225–232.
6. Naylor RL, Goldburg RJ, Primavera JH, Kautsky N, Beveridge MC, et al. (2000) Effect of aquaculture on world fish supplies. Nature 405: 1017–1024. 7. Leaver MJ, Villeneuve LA, Obach A, Jensen L, Bron JE, et al. (2008) Functional
unsaturated fatty acid biosynthesis after dietary substitution of fish oil with vegetable oils in Atlantic salmon (Salmo salar). BMC Genomics 9: 299. 8. Panserat S, Kolditz C, Richard N, Plagnes-Juan E, Piumi F, et al. (2008) Hepatic
gene expression profiles in juvenile rainbow trout (Oncorhynchus mykiss) fed fishmeal or fish oil-free diets. Br J Nutr 100: 953–967.
9. Tocher DR, Agaba MK, Hastings N, Teale AJ (2003) Biochemical and molecular studies of the polyunsaturated fatty acid desaturation pathway in fish. In: Browman HI, Skiftesvik AB, editors. The Big Fish Bang, Proceedings of the 26th Annual Larval Fish Conference. Bergen: Institute of Marine Research. pp. 211–227.
10. Seiliez I, Panserat S, Kaushik S, Bergot P (2001) Cloning, tissue distribution and nutritional regulation of a [Delta] 6-desaturase-like enzyme in rainbow trout. Comp Biochem Physiol Part B: Biochem Mol Biol 130: 83–93.
11. Meyer A, Kirsch H, Domergue F, Abbadi A, Sperling P, et al. (2004) Novel fatty acid elongases and their use for the reconstitution of docosahexaenoic acid biosynthesis. J Lipid Res 45: 1899–1909.
12. Hastings N, Agaba MK, Tocher DR, Zheng X, Dickson CA, et al. (2004) Molecular cloning and functional characterization of fatty acyl desaturase and elongase cDNAs involved in the production of eicosapentaenoic and docosahexaenoic acids froma-linolenic acid in Atlantic salmon (Salmo salar). Mar Biotechnol 6: 463–474.
13. Zheng X, Seiliez I, Hastings N, Tocher DR, Panserat S, et al. (2004) Characterization and comparison of fatty acyl D6 desaturase cDNAs from freshwater and marine teleost fish species. Comp Biochem Physiol Part B: Biochem Mol Biol 139: 269–279.
14. Zheng X, Tocher DR, Dickson CA, Bell JG, Teale AJ (2005) Highly unsaturated fatty acid synthesis in vertebrates: new insights with the cloning and characterization of aD6 desaturase of Atlantic salmon. Lipids 40: 13–24. 15. Morais S, Monroig O, Zheng X, Leaver MJ, Tocher DR (2009) Highly
unsaturated fatty acid synthesis in Atlantic salmon: characterization of ELOVL5-and ELOVL2-like elongases. Mar Biotechnol 11: 627–639. 16. Vagner M, Santigosa E (2011) Characterization and modulation of gene
expression and enzymatic activity of delta-6 desaturase in teleosts: a review. Aquaculture 315: 131–143.
17. Towle HC, Kaytor EN, Shih HM (1997) Regulation of the expression of lipogenic enzyme genes by carbohydrate. Annu Rev Nutr 17: 405–433. 18. Leaver MJ, Taggart JB, Villeneuve L, Bron JE, Guy DR, et al. (2011)
Heritability and mechanisms ofn-3 long chain polyunsaturated fatty acid deposition in the flesh of Atlantic salmon. Comp Biochem Physiol Part D: Genomics Proteomics 6: 62–69.
19. Morais S, Pratoomyot J, Taggart J, Bron J, Guy D, et al. (2011) Genotype-specific responses in Atlantic salmon (Salmo salar) subject to dietary fish oil replacement by vegetable oil: a liver transcriptomic analysis. BMC Genomics 12: 255.
20. Quillet E, Le Guillou S, Aubin J, Fauconneau B (2005) Two-way selection for muscle lipid content in pan-size rainbow trout (Oncorhynchus mykiss). Aquaculture 245: 49–61.
21. Kolditz C, Borthaire M, Richard N, Corraze G, Panserat S, et al. (2008) Liver and muscle metabolic changes induced by dietary energy content and genetic selection in rainbow trout (Oncorhynchus mykiss). Am J Physiol Regul Integr Comp Physiol 294: R1154–1164.
22. Skiba-Cassy S, Lansard M, Panserat S, Me´dale F (2009) Rainbow trout genetically selected for greater muscle fat content display increased activation of liver TOR signaling and lipogenic gene expression. Am J Physiol Regul Integr Comp Physiol 297: R1421–1429.
23. Kamalam BS, Medale F, Kaushik S, Polakof S, Skiba-Cassy S, et al. (2012) Regulation of metabolism by dietary carbohydrates in two lines of rainbow trout divergently selected for muscle fat content. J Exp Biol 215: 2567–2578. 24. Kamalam BS, Panserat S, Aguirre P, Geurden I, Fontagne´-Dicharry S, et al.
(2013) Selection for high muscle fat in rainbow trout induces potentially higher chylomicron synthesis and PUFA biosynthesis in the intestine. Comp Biochem Physiol Part A: Mol Integr Physiol 164: 417–427.
25. Moore S (1968) Amino acid analysis: aqueous dimethyl sulfoxide as solvent for the ninhydrin reaction. J Biol Chem 243: 6281.
26. Pfaffl MW (2001) A new mathematical model for relative quantification in real-time RT-PCR. Nucleic Acids Res 29: e45.
27. Folch J, Lees M, Sloane-Stanley G (1957) A simple method for the isolation and purification of total lipids from animal tissues. J Biol Chem 226: 497–509. 28. Shantha N, Ackman R (1990) Nervonic acidversustricosanoic acid as internal
standards in quantitative gas chromatographic analyses of fish oil longer-chainn -3 polyunsaturated fatty acid methyl esters. J Chromatogr B: Biomed Sci Appl 533: 1–10.
29. Bergot F (1979) Carbohydrate in rainbow trout diets: effects of the level and source of carbohydrate and the number of meals on growth and body composition. Aquaculture 18: 157–167.
30. Pilkis S, Granner D (1992) Molecular physiology of the regulation of hepatic gluconeogenesis and glycolysis. Annu Rev Physiol 54: 885–909.
31. Panserat S, Me´dale F, Blin C, Bre`que J, Vachot C, et al. (2000) Hepatic glucokinase is induced by dietary carbohydrates in rainbow trout, gilthead seabream, and common carp. Am J Physiol Regul Integr Comp Physiol 278: R1164–1170.
32. Panserat S, Me´dale F, Bre`que J, Plagnes-Juan E, Kaushik S (2000) Lack of significant long-term effect of dietary carbohydrates on hepatic
glucose-6-phosphatase expression in rainbow trout (Oncorhynchus mykiss). J Nutr Biochem 11: 22–29.
33. Kirchner S, Panserat S, Lim P, Kaushik S, Ferraris R (2008) The role of hepatic, renal and intestinal gluconeogenic enzymes in glucose homeostasis of juvenile rainbow trout. J Comp Physiol B 178: 429–438.
34. Moon TW (2001) Glucose intolerance in teleost fish: fact or fiction. Comp Biochem Physiol Part B: Biochem Mol Biol 129: 243–249.
35. Hemre GI, Mommsen TP, Krogdahl A (2002) Carbohydrates in fish nutrition: effects on growth, glucose metabolism and hepatic enzymes. Aquacult Nutr 8: 175–194.
36. Panserat S, Skiba-Cassy S, Seiliez I, Lansard M, Plagnes-Juan E, et al. (2009) Metformin improves postprandial glucose homeostasis in rainbow trout fed dietary carbohydrates: a link with the induction of hepatic lipogenic capacities. Am J Physiol Regul Integr Comp Physiol 297: R707–715.
37. Girard J, Ferre´ P, Foufelle F (1997) Mechanisms by which carbohydrates regulate expression of genes for glycolytic and lipogenic enzymes. Annu Rev Nutr 17: 325–352.
38. Sullivan AC, Miller ON, Wittman JS, Hamilton JG (1971) Factors influencing thein vivoandin vitrorates of lipogenesis in rat liver. J Nutr 101: 265–272. 39. Parks EJ, Hellerstein MK (2000) Carbohydrate-induced
hypertriacylglycerole-mia: historical perspective and review of biological mechanisms. Am J Clin Nutr 71: 412–433.
40. Randle PJ (1998) Regulatory interactions between lipids and carbohydrates: the glucose fatty acid cycle after 35 years. Diabetes Metab Rev 14: 263–283. 41. Polakof S, Me´dale F, Larroquet L, Vachot C, Corraze G, et al. (2011)
Regulation ofde novohepatic lipogenesis by insulin infusion in rainbow trout fed a high-carbohydrate diet. J Anim Sci 89: 3079–3088.
42. Poisson JPG, Cunnane SC (1991) Long-chain fatty acid metabolism in fasting and diabetes: relation between altered desaturase activity and fatty acid composition. J Nutr Biochem 2: 60–70.
43. Cook HW, McMaster CR (2002) Fatty acid desaturation and chain elongation in eukaryotes. New Compr Biochem 36: 181–204.
44. Shankar K, Harrell A, Kang P, Singhal R, Ronis MJ, et al. (2010) Carbohydrate-responsive gene expression in the adipose tissue of rats. Endocrinology 151: 153–164.
45. Tocher D, Leaver M, Hodgson P (1998) Recent advances in the biochemistry and molecular biology of fatty acyl desaturases. Prog Lipid Res 37: 73. 46. Menoyo D, Lopez-Bote C, Obach A, Bautista J (2005) Effect of dietary fish oil
substitution with linseed oil on the performance, tissue fatty acid profile, metabolism, and oxidative stability of Atlantic salmon. J Anim Sci 83: 2853– 2862.
47. Jakobsson A, Westerberg R, Jacobsson A (2006) Fatty acid elongases in mammals: their regulation and roles in metabolism. Prog Lipid Res 45: 237– 249.
48. Nakamura MT, Nara TY (2004) Structure, function, and dietary regulation of
D6,D5, andD9 desaturases. Annu Rev Nutr 24: 345–376.
49. Wang Y, Botolin D, Xu J, Christian B, Mitchell E, et al. (2006) Regulation of hepatic fatty acid elongase and desaturase expression in diabetes and obesity. J Lipid Res 47: 2028–2041.
50. Ferre´ P (2004) The biology of peroxisome proliferator-activated receptors relationship with lipid metabolism and insulin sensitivity. Diabetes 53: S43–S50. 51. Roberts LD, Murray AJ, Menassa D, Ashmore T, Nicholls AW, et al. (2011) The contrasting roles of PPARdand PPARcin regulating the metabolic switch between oxidation and storage of fats in white adipose tissue. Genome Biol 12: R75.
52. Leaver MJ, Bautista JM, Bjo¨rnsson BT, Jo¨nsson E, Krey G, et al. (2008) Towards fish lipid nutrigenomics: current state and prospects for fin-fish aquaculture. Rev Fish Sci 16: 73–94.
53. Matsuzaka T, Shimano H, Yahagi N, Amemiya-Kudo M, Yoshikawa T, et al. (2002) Dual regulation of mouse D5-and D6-desaturase gene expression by SREBP-1 and PPARa. J Lipid Res 43: 107–114.
54. Nakamura MT, Cheon Y, Li Y, Nara TY (2004) Mechanisms of regulation of gene expression by fatty acids. Lipids 39: 1077–1083.
55. Igarashi M, Ma K, Chang L, Bell JM, Rapoport SI (2007) Dietary n-3 PUFA deprivation for 15 weeks upregulates elongase and desaturase expression in rat liver but not brain. J Lipid Res 48: 2463–2470.
56. Morais S, Silva T, Cordeiro O, Rodrigues P, Guy DR, et al. (2012) Effects of genotype and dietary fish oil replacement with vegetable oil on the intestinal transcriptome and proteome of Atlantic salmon (Salmo salar). BMC Genomics 13: 448.
57. Torstensen BE, Tocher DR (2010) The effects of fish oil replacement on lipid metabolism of fish. In: Turchini GM, Ng WK, Tocher DR, editors. Fish oil replacement and alternative lipid sources in aquaculture feeds. Boca Raton: CRC press, Taylor and Francis. pp. 405–437.
58. Turchini GM, Francis DS (2009) Fatty acid metabolism (desaturation, elongation and b-oxidation) in rainbow trout fed fish oil or linseed oil based diets. Br J Nutr 102: 69–81.
59. Bell JG, McEvoy J, Tocher DR, McGhee F, Campbell PJ, et al. (2001) Replacement of fish oil with rapeseed oil in diets of Atlantic salmon (Salmo salar) affects tissue lipid compositions and hepatocyte fatty acid metabolism. J Nutr 131: 1535–1543.
61. Quillet E, Le Guillou S, Aubin J, Labbe´ L, Fauconneau B, et al. (2007) Response of a lean muscle and a fat muscle rainbow trout (Oncorhynchus mykiss) line on growth, nutrient utilization, body composition and carcass traits when fed two different diets. Aquaculture 269: 220–231.
62. Geurden I, Cuvier A, Gondouin E, Olsen R, Ruohonen K, et al. (2005) Rainbow trout can discriminate between feeds with different oil sources. Physiol Behav 85: 107–114.
63. Jump DB (2002) Dietary polyunsaturated fatty acid regulation of hepatic gene transcription. Scand J Nutr 46(2): 59–67.
64. Kolditz CI, Paboeuf G, Borthaire M, Esquerre´ D, SanCristobal M, et al. (2008) Changes induced by dietary energy intake and divergent selection for muscle fat content in rainbow trout (Oncorhynchus mykiss), assessed by transcriptome and proteome analysis of the liver. BMC Genomics 9: 506.
65. Morais S, Pratoomyot J, Torstensen BE, Taggart JB, Guy DR, et al. (2011) Diet6genotype interactions in hepatic cholesterol and lipoprotein metabolism
in Atlantic salmon (Salmo salar) in response to replacement of dietary fish oil with vegetable oil. Br J Nutr 1: 1–13.
66. Kolditz C, Plagnes-Juan E, Quillet E, Lefe`vre F, Me´dale F (2010) Changes in white muscle transcriptome induced by dietary energy levels in two lines of rainbow trout (Oncorhynchus mykiss) selected for muscle fat content. Br J Nutr 103: 629–642.
67. Rollin X, Peng J, Pham D, Ackman RG, Larondelle Y (2003) The effects of dietary lipid and strain difference on polyunsaturated fatty acid composition and conversion in anadromous and landlocked salmon (Salmo salarL.) parr. Comp Biochem Physiol Part B: Biochem Mol Biol 134: 349–366.
68. Goetz F, Rosauer D, Sitar S, Goetz G, Simchick C, et al. (2010) A genetic basis for the phenotypic differentiation between siscowet and lean lake trout (Salvelinus namaycush). Mol Ecol 19: 176–196.