Volume 2013, Article ID 594958,10pages http://dx.doi.org/10.1155/2013/594958
Research Article
Effects of a Diet Enriched with Polyunsaturated, Saturated,
or Trans Fatty Acids on Cytokine Content in the Liver, White
Adipose Tissue, and Skeletal Muscle of Adult Mice
Bruno dos Santos, Debora Estadella, Ana Cláudia Losinskas Hachul,
Marcos Hiromu Okuda, Mayara Franzoi Moreno, Lila Missae Oyama,
Eliane Beraldi Ribeiro, and Claudia Maria da Penha Oller do Nascimento
Universidade Federal de S˜ao Paulo, Escola Paulista de Medicina (UNIFESP-EPM), 04020-050 S˜ao Paulo, SP, Brazil
Correspondence should be addressed to Claudia Maria da Penha Oller do Nascimento; [email protected]
Received 9 April 2013; Revised 18 June 2013; Accepted 11 July 2013
Academic Editor: Eric F. Morand
Copyright © 2013 Bruno dos Santos et al. his is an open access article distributed under the Creative Commons Attribution License, which permits unrestricted use, distribution, and reproduction in any medium, provided the original work is properly cited.
his study analyzed the efect of diet enriched with 30% lipids on cytokines content in diferent tissues. Swiss male mice were distributed into four groups treated for 8 weeks with control (C, normolipidic diet); soybean oil (S); lard (L); and hydrogenated vegetable fat (H). We observed an increase in carcass fat in groups S and L, and the total amount of fatty deposits was only higher in group L compared with C group. he serum levels of free fatty acids were lower in the L group, and insulin, adiponectin, lipid proile, and glucose levels were similar among the groups. IL-10 was lower in group L in mesenteric and retroperitoneal adipose tissues. H reduced IL-10 only in retroperitoneal adipose tissue. here was an increase in IL-6 in the gastrocnemius muscle of the L group, and a positive correlation between TNF-�and IL-10 was observed in the livers of groups C, L, and H and in the muscles of all groups studied. he results suggested relationships between the quantity and quality of lipids ingested with adiposity, the concentration of free fatty acids, and cytokine production in white adipose tissue, gastrocnemius muscle, and liver.
1. Introduction
Epidemiological studies reveal that approximately 2.3 billion adults will be overweight and 700 million will be obese in 2015 [1]. Obesity is a chronic subclinical inlammatory disease of multifactorial etiology, involving the ingestion of a high-calorie diet, a sedentary lifestyle, and genetic predisposition [2]. he establishment of the disease can lead to the develop-ment of correlated morbidities such as diabetes mellitus type 2, cardiovascular disease, and metabolic syndrome, among others, as a consequence of the imbalance of a complex system of energy balance [3,4].
he enlargement of adipocytes and the expansion of adi-pose tissue lead to local hypoxia and macrophage iniltration, causing an inlammatory response. In turn, the response changes the patterns of protein and gene expression of various bioactive molecules, called adipokines, produced by adipose tissue [5].
Adipokines are a group of proteins synthesized by white adipose tissue that act on the immune, cardiovascular, meta-bolic, and endocrine systems. Examples include TNF-�, leptin, adiponectin, resistin, IL-6, and IL-10 [6,7]. In obese individuals, the expression of proinlammatory adipokines by adipose tissues is normally increased [8].
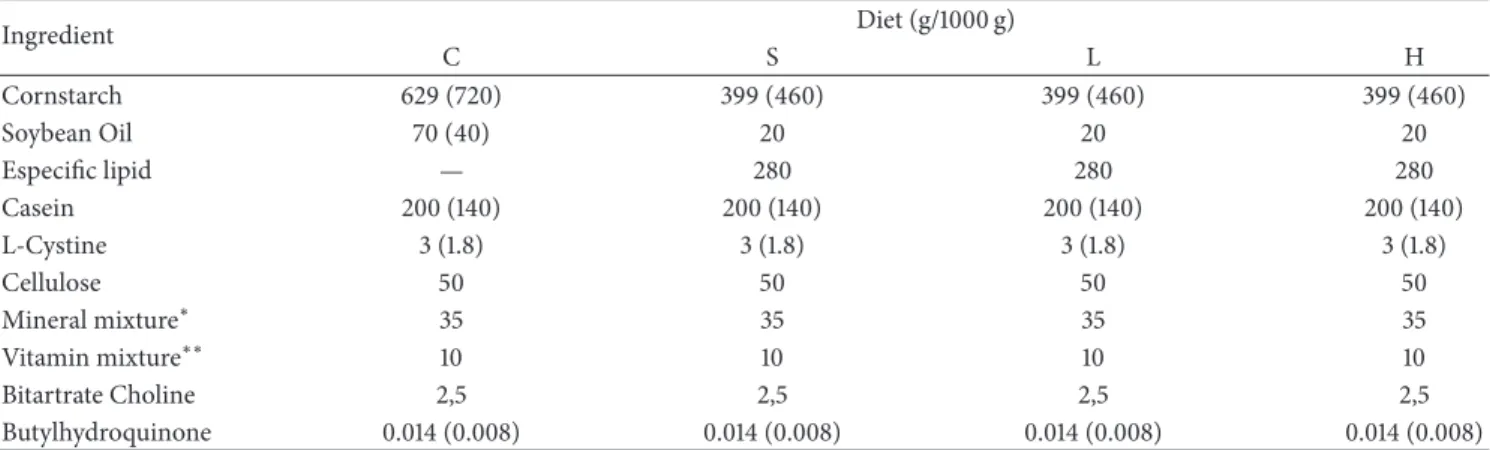
Table 1: Composition of the control (C), soybean (S), lard (L), and hydrogenated vegetable oil (H) diets prepared according to AIN-93.
Ingredient Diet (g/1000 g)
C S L H
Cornstarch 629 (720) 399 (460) 399 (460) 399 (460)
Soybean Oil 70 (40) 20 20 20
Especiic lipid — 280 280 280
Casein 200 (140) 200 (140) 200 (140) 200 (140)
L-Cystine 3 (1.8) 3 (1.8) 3 (1.8) 3 (1.8)
Cellulose 50 50 50 50
Mineral mixture∗ 35 35 35 35
Vitamin mixture∗∗ 10 10 10 10
Bitartrate Choline 2,5 2,5 2,5 2,5
Butylhydroquinone 0.014 (0.008) 0.014 (0.008) 0.014 (0.008) 0.014 (0.008)
he irst number refers to the growth diet (AIN-93G), and the number in parentheses refers to the maintenance diet (AIN-93M) when its composition difered from that of the growth diet.
∗Mineral mix provided (mg/kg) calcium 5000, phosphorus 1561, potassium 3600, sodium 1019, chloride 1571, sulfur 300, magnesium 507, iron 35, copper 6.0, manganese 10.0, zinc 30.0, chromium 1.0, iodine 0.2, selenium 0.15, luoride 1.00, boron 0.50, molybdenum 0.15, silicon 5.0, nickel 0.5, lithium 0.1, and vanadium 0.1
∗∗Vitamin mix (mg/kg diet) provided thiamin HCL 6.0, ribolavin 6.0, pyridoxine HCL 7.0, niacin 30.0, calcium pantothenate 16.0, folic acid 2.0, biotin 0.2, vitamin B12 25.0, vitamin A palmitate 4000 IU, vitamin E acetate 75, vitamin D3 1000 IU, and vitamin KI 0.75.
he lipid composition of the diet has a strong relationship with the development and persistence of obesity [15]. Acute (2 days) or chronic (16 weeks) treatment with a high-fat diet reduces the synthesis of adiponectin, suggesting that the serum lipid proile and lipid components of the diet are more related to the decrease of adiponectin than to obesity itself [16]. In adult males, a positive correlation between body fat and the quantity or quality of lipids consumed has been described, and diets high in saturated and monounsaturated fatty acids induced greater adiposity compared with diets rich in polyunsaturated fatty acids [17].
Studies by our group have shown a link between a high-fat diet and diferent types of lipids in the diet with changes in gene expression, the synthesis and secretion of adipokines and obesity-related comorbidities [18–21].
hus, the aim of this study was to investigate the efects of high-fat diets enriched with lard, soybean oil, or hydrogenated vegetable oil (30% lipids, w/w) on body fat content, lipid proiles, serum glucose, insulin and adiponectin concentrations, and the tissue cytokines TNF-�, IL-10, and IL-6.
2. Materials and Methods
2.1. Animals and Diet Protocol. he Experimental Research Committee of the S˜ao Paulo Federal University approved all procedures for the care of the animals used in this study (protocol CEP n∘1644/10). hirty-day-old male Swiss mice were used in this study and were kept under controlled conditions (12 h light: 12 h dark cycle at 22∘C±1∘C). During the experimental period, the animals were housed six per cage, receiving water and a speciic diet ad libitum. he animals were assigned to four experimental groups, with 12 animals per group, according to their speciic diet and treated for eight weeks as follows: (1) C (control group; the animals were treated for eight weeks with a standard AIN diet
(American Institute of Nutrition); (2) S (soybean oil group); (3) L (lard group); and (4) H (hydrogenated vegetable oil group). he animals’ weights were evaluated weekly.
All diets were prepared according to the recommenda-tions of the AIN [22] and were normoproteic. All groups received a growth diet (AIN-93G) containing 20% protein and at least 7% essential fatty acids between the 30th and 60th day of life and a maintenance diet (AIN-93M) containing 14% protein and 2% soybean oil to provide the essential fatty acids between the 60th and 90th days of life. he compositions of the control, soybean, lard, and hydrogenated vegetable oil diets are described inTable 1.
2.2. Fatty Acid Composition of the Diets. 500 mg of the prepared diets were used for lipid extraction, saponiication, and fatty acid methylation as described by the American Oil Chemists-Society, 2011. he relative fatty acids content in the total lipids from the diet was quantiied by gas-liquid chromatography using Agilent Technologies 7890A CG System, with an ionizable lame detector acoplado linked to the EZChrom Elite CDS sotware (Agilent Technologies, Inc., C.A., U.S.A.). Fatty acids were separated using an SP 2560 capillary column (Supelco, USA), with 100m ×
0.25mm × 0.20 �m measurements. he chromatographic
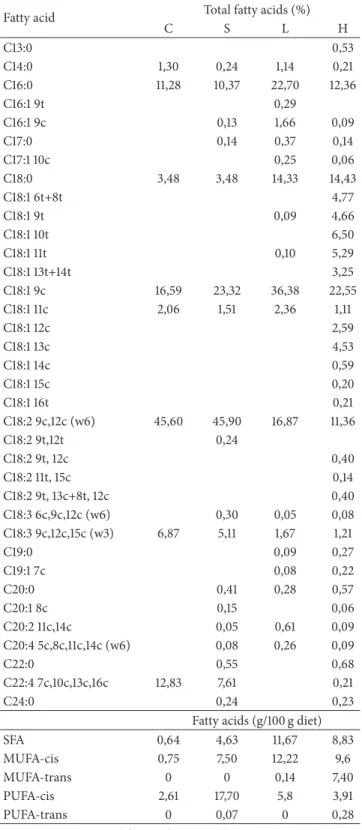
conditions were similar to those described by Tinoco et al. [23]. he methylated fatty acids were identiied by comparing their retention times to known standards (Nu-Chek Prep. Inc). Results were expressed weight percentage (g/100 g of total fatty acids—Table 2).
Table 2: Fatty acid composition, as percent of total lipid content, of the control (C), soybean (S), lard (L), and hydrogenated vegetable oil (H) diets prepared according to AIN-93.
Fatty acid Total fatty acids (%)
C S L H
C13:0 0,53
C14:0 1,30 0,24 1,14 0,21
C16:0 11,28 10,37 22,70 12,36
C16:1 9t 0,29
C16:1 9c 0,13 1,66 0,09
C17:0 0,14 0,37 0,14
C17:1 10c 0,25 0,06
C18:0 3,48 3,48 14,33 14,43
C18:1 6t+8t 4,77
C18:1 9t 0,09 4,66
C18:1 10t 6,50
C18:1 11t 0,10 5,29
C18:1 13t+14t 3,25
C18:1 9c 16,59 23,32 36,38 22,55
C18:1 11c 2,06 1,51 2,36 1,11
C18:1 12c 2,59
C18:1 13c 4,53
C18:1 14c 0,59
C18:1 15c 0,20
C18:1 16t 0,21
C18:2 9c,12c (w6) 45,60 45,90 16,87 11,36
C18:2 9t,12t 0,24
C18:2 9t, 12c 0,40
C18:2 11t, 15c 0,14
C18:2 9t, 13c+8t, 12c 0,40
C18:3 6c,9c,12c (w6) 0,30 0,05 0,08
C18:3 9c,12c,15c (w3) 6,87 5,11 1,67 1,21
C19:0 0,09 0,27
C19:1 7c 0,08 0,22
C20:0 0,41 0,28 0,57
C20:1 8c 0,15 0,06
C20:2 11c,14c 0,05 0,61 0,09
C20:4 5c,8c,11c,14c (w6) 0,08 0,26 0,09
C22:0 0,55 0,68
C22:4 7c,10c,13c,16c 12,83 7,61 0,21
C24:0 0,24 0,23
Fatty acids (g/100 g diet)
SFA 0,64 4,63 11,67 8,83
MUFA-cis 0,75 7,50 12,22 9,6
MUFA-trans 0 0 0,14 7,40
PUFA-cis 2,61 17,70 5,8 3,91
PUFA-trans 0 0,07 0 0,28
MUFA: monounsaturated fatty acids; ND: not detected; PUFA: polyunsatu-rated fatty acids; SFA: satupolyunsatu-rated fatty acids.
and total cholesterol using commercials kits from Labtest Diagnostic SA (Minas Gerais, Brazil) and the concentrations of free fatty acids, insulin, and adiponectin using ELISA
(Linco Research, Inc., USA). he retroperitoneal (RET), epididymal (EPI), and mesenteric (MES) adipose tissues, gastrocnemius muscle (GAST), and liver were dissected and weighed, frozen in liquid nitrogen, and stored at−80∘C until the extraction of protein. he carcasses were weighed and stored for further lipid content determination.
2.4. Carcass Lipid Content Determination. he carcasses were eviscerated, weighed, and stored at−20∘C. he lipid content was measured as described by Stansbie et al. and standardized using the method described by Oller do Nascimento and Williamson [24]. Briely, an eviscerated carcass was auto-claved at 120∘C for 90 min and then homogenized with double its mass of water. Triplicate aliquots of this homogenate were weighed and digested in 3 mL of 30% KOH and 3 mL of ethanol for at least 2 h at 70∘C in capped tubes. Ater cooling, 2 mL of 12 N H2SO4was added, and the sample was washed three times with petroleum ether for lipid extraction. he results are expressed as grams of lipid/100 g of carcass.
2.5. Protein Determination and ELISA Assay. Adipose tissue depots, gastrocnemius muscles, and livers (0.25–0.3 g) were homogenized in ice-cold solubilization and total protein extraction bufer (100 mM Tris, pH 7.5, 10 mM ethylene acetic acid, 100 mM sodium luoride, 10 mM sodium orthovana-date, 2 mM phenylmethylsulfonyl luoride, 10 mM sodium pyrophosphate, and 0.1 mg/mL aprotinin). Ater homoge-nization, Triton X-100 was added to a inal concentration of 1%. Samples rested on ice for 30 min and were clariied by centrifugation. Homogenates were centrifuged at 14000×g for 40 min at 4∘C, the supernatants were saved, and the protein concentrations were determined using a Bradford assay (Bio-Rad, Hercules, California) with bovine serum albumin as a reference. Quantitative assessment of 6, IL-10, and TNF-�was carried out using ELISA. he results are expressed as pg/�g of protein.
2.6. Data Analysis. he results are expressed as the means± SEM. For multiple comparisons of means, one-way analysis of variance (ANOVA) was performed with subsequent use of the Tukey post hoc test. Simple linear regression analysis was used to evaluate the correlation between cytokines (IL-10 and TNF-�). Statistical signiicance was set at� < 0.05.
3. Results
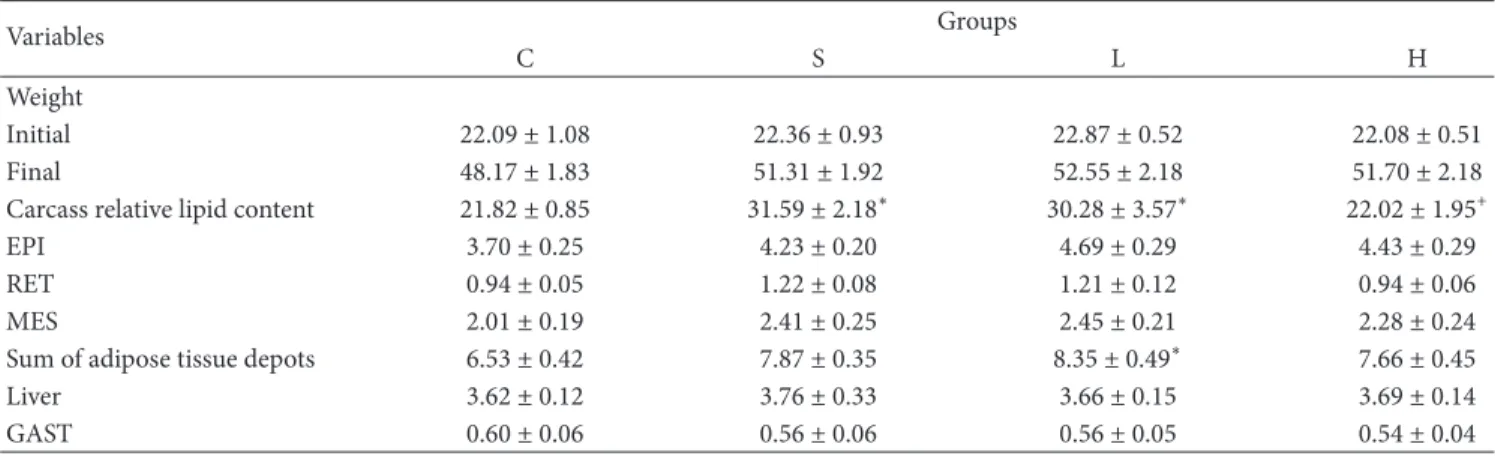
3.1. Body Weight, Carcass Lipid Content, and Biochemical and Hormonal Serum Analysis. Body mass, white adipose tissue depots (EPI, RET, and MES), liver, and GAST weights were similar among all groups. However, the S and L diets promoted a signiicant increase in carcass relative lipid content compared with group C. In addition, this parameter in group H was lower than in group S (Table 3).
Exposure to the L diet ater weaning caused an approxi-mately 28% increase in the sum of the adipose tissue depots compared with the control group.
Table 3: Body Mass (g), carcass relative lipid content (g/100 g), sum of adipose tissue depots (g/100 g) and tissue weight (g/100 g) of studied mice groups-(C) control group, (S) Soybean, (L) Lard and (H) Hydrogenated vegetable fat groups.
Variables Groups
C S L H
Weight
Initial 22.09 ± 1.08 22.36 ± 0.93 22.87 ± 0.52 22.08 ± 0.51
Final 48.17 ± 1.83 51.31 ± 1.92 52.55 ± 2.18 51.70 ± 2.18
Carcass relative lipid content 21.82 ± 0.85 31.59 ± 2.18∗ 30.28 ± 3.57∗ 22.02 ± 1.95+
EPI 3.70 ± 0.25 4.23 ± 0.20 4.69 ± 0.29 4.43 ± 0.29
RET 0.94 ± 0.05 1.22 ± 0.08 1.21 ± 0.12 0.94 ± 0.06
MES 2.01 ± 0.19 2.41 ± 0.25 2.45 ± 0.21 2.28 ± 0.24
Sum of adipose tissue depots 6.53 ± 0.42 7.87 ± 0.35 8.35 ± 0.49∗ 7.66 ± 0.45
Liver 3.62 ± 0.12 3.76 ± 0.33 3.66 ± 0.15 3.69 ± 0.14
GAST 0.60 ± 0.06 0.56 ± 0.06 0.56 ± 0.05 0.54 ± 0.04
All results are presented as means±standard error of the mean (� = 9). ∗Values signiicantly diferent from (C) group atP<0.05.
+Values signiicantly diferent from (S) group atP<0.05.
Table 4: Serum triacylglycerols (mg/dL), total cholesterol (mg/dL), free fat acids (�M), insulin (ng/mL), adiponectin (�g/mL) and glucose (mg/dL) of studied mice groups-(C) control group, (S) Soybean, (L) Lard and (H) Hydrogenated vegetable fat groups.
Variables Groups
C S L H
Triacylglycerols 182 ± 7.88 165 ± 7.67 158 ± 5.54 168 ± 5.12
Total cholesterol 158 ± 7.09 147 ± 5.38 143 ± 4.79 160 ± 15.66
Free fat acids 2.80 ± 0.16 2.26 ± 0.13 1.77 ± 0.24∗ 2.15 ± 0.25
Insulin 1.60 ± 0.33 1.45 ± 0.13 0.93 ± 0.18 2.02 ± 0.38
Adiponectin 3.46 ± 0.28 4.14 ± 0.25 3.17 ± 0.39 3.45 ± 0.39
Glucose 120 ± 7.68 130 ± 11.14 125 ± 13.44 112.0 ± 10.52
All results are presented as means±standard error of the mean (� = 8). ∗Values signiicantly diferent from (C) group atP<0.05.
the studied groups. Nevertheless, the L diet caused a decrease in the serum concentrations of free fatty acids (Table 4).
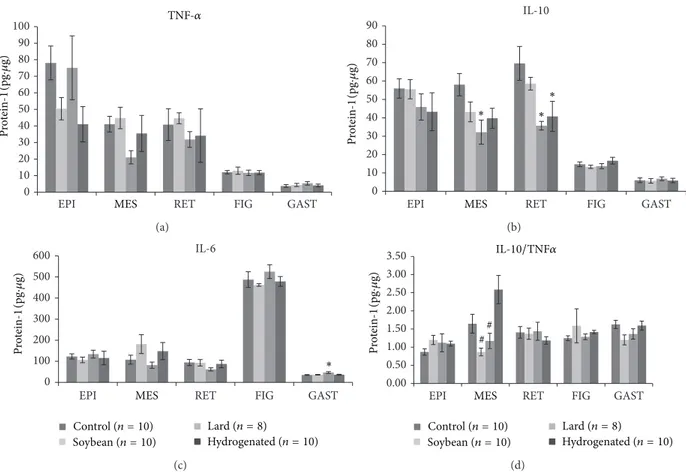
3.2. Tissue Cytokine Content. TNF-�levels did not change in any group or tissue studied compared with the control group (Figure 1(a)).
However, the L diet caused a decrease in IL-10 levels in MES and RET white adipose tissue depots, and the H diet promoted a similar efect in the RET depot (Figure 1(b)). Fur-thermore, the IL-6 content was elevated in mice that ingested the diet containing saturated fatty acids (L) (Figure 1(c)). In group H, the IL-10/TNF-�ratio was higher in MES adipose tissue compared with groups S and L (Figure 1(d)).
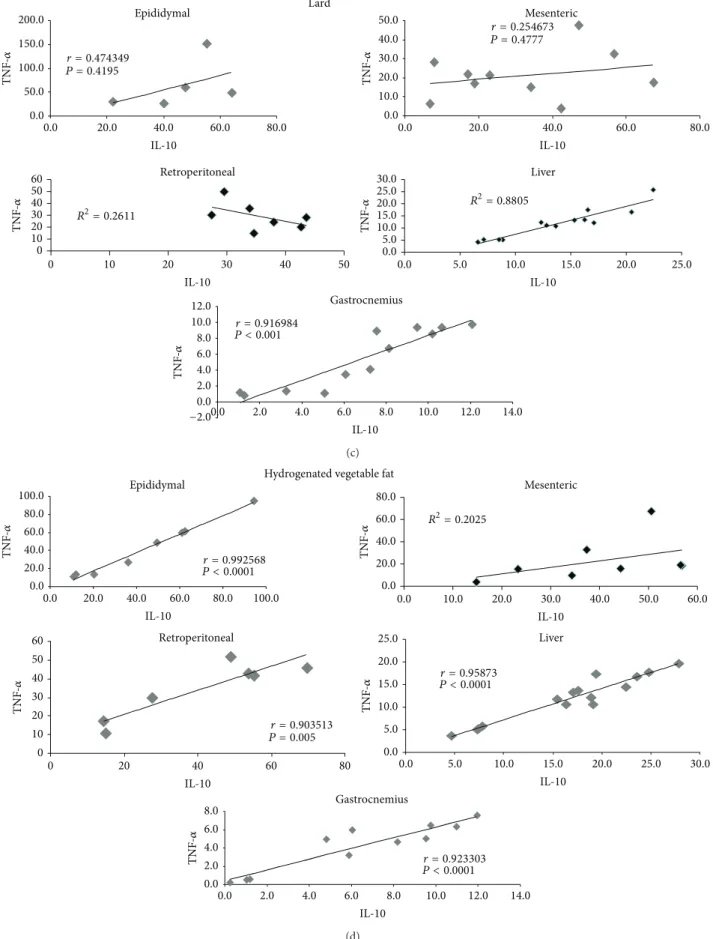
We ran correlation tests for IL-10 and TNF-�and found the following to be positively correlated: group C, retroperi-toneal fat depot, liver, and gastrocnemius muscle; group S, epididymal and mesenteric fat depots and gastrocnemius muscle; and group L, liver and gastrocnemius muscle. In group H, only mesenteric fat tissue did not correlate.
4. Discussion
he ingestion of high-fat diets for 8 weeks did not modify body or tissue weight. Similar results were observed by others
with eight or seven weeks of high-fat diet treatment [19,25,
0 10 20 30 40 50 60 70 80 90 100
EPI RET FIG GAST
TNF-�
MES
P
ro
tein-1
(
pg
·�
g
)
(a)
IL-10
0 10 20 30 40 50 60 70 80 90
EPI RET FIG GAST
∗ ∗
∗
MES
P
ro
tein-1
(
pg
·�
g
)
(b)
0 100 200 300 400 500 600
EPI RET FIG GAST
IL-6
Control(n = 10)
Soybean(n = 10)
Lard(n = 8)
Hydrogenated(n = 10) ∗
MES
P
ro
tein-1
(
pg
·�
g
)
(c)
0.00 0.50 1.00 1.50 2.00 2.50 3.00 3.50
EPI RET FIG GAST
Control(n = 10)
Soybean(n = 10)
Lard(n = 8)
Hydrogenated(n = 10)
# #
MES
IL-10/TNF�
P
ro
tein-1
(
pg
·�
g
)
(d)
Figure 1: Cytokines levels (IL-6 (pg/ug protein-1) in adipose tissue depots, liver, and gastrocnemius muscle of studied mice groups—(C) control group, (S) soybean, (L) lard, and (H) hydrogenated vegetable fat groups. (a) Tumoral necrosis factor alpha (TNF-�), (b) interleukin-10 (IL-interleukin-10), (c) interleukin-6 (IL-6), and (d) IL-interleukin-10/TNF-�ratio.∗Values signiicantly diferent from (C) group at� < 0.05.#Values signiicantly
diferent from (H) group at� < 0.05.
Taken together, these reports suggest that the efects on fat accumulation depend on the type and source of lipids present in the diet and could be related to the efects on energy expenditure and adipose tissue metabolism, such as lipoprotein lipase activity, lipogenesis, and lipolytic enzyme activities.
he diet intervention did not alter the concentrations of serum glucose, triacylglycerol, total cholesterol, adiponectin, or insulin. Previous studies have demonstrated no efect of high-fat diets on the serum adiponectin concentration [33,
34]. However, a time-dependent efect of a high-fat diet on the adiponectin serum concentration has been shown; 10 weeks of treatment increased and 18 weeks of treatment reduced the serum adiponectin concentration compared with the initial experimental period [35], suggesting a compensatory mech-anism to maintain metabolic homeostasis, as this adipokine is associated with the maintenance of carbohydrate and lipid metabolism and also acts to improve insulin sensitivity [19,
36–40]. In fact, in our study, 8 weeks of a high-fat diet treatment did not modify serum glucose, triacylglycerol, total cholesterol, or adiponectin and insulin concentrations, in spite of the increasing adiposity in groups L and S.
Another possible explanation related to the similar serum lipid proile among the groups is the decrease in the car-bohydrate content of the high-fat diets. he review from
Volek et al. [41] reported that the serum total cholesterol level remained unchanged from baseline values, while both the HDL and LDL cholesterol levels increased and the TAG levels dramatically decreased under a high-fat diet compared with high-carbohydrate diets.
In the current study, the lard diet caused a decrease in the serum free fatty acid concentration in relation to the control diet. It has been stated that the plasma free fatty acids resulted from hydrolyzed triacylglycerol in chylomicrons and VLDL by lipoprotein lipase activity and lipolysis in adipose tissue [42]. One important mechanism for the removal of unesteriied plasma fatty acids is through oxidation of these fatty acids in skeletal muscle and the heart [43]. Several studies have demonstrated that IL-6 can increase fatty acid oxidation in myocytes [44, 45] and “in vivo” [46]. When we analyzed the IL-6 content in gastrocnemius muscle, we veriied an increase in group L compared with group C, which could partially explain the reduction in serum fatty acids in lard-treated animals.
Retroperitoneal
0 20 40 60 80 100
0 20 40 60 80 100 120
IL-10
Liver
0.0 5.0 10.0 15.0 20.0
0.0 5.0 10.0 15.0 20.0 25.0
IL-10
Gastrocnemius
0.0 2.0 4.0 6.0 8.0 10.0
0.0 5.0 10.0 15.0
IL-10 Control
r = 0.666207 P = 0.0501
r = 0.80075 P = 0.001
r = 0.978015 P < 0.0001 0.0
20.0 40.0 60.0 80.0 100.0 120.0
0.0 20.0 40.0 60.0 80.0 100.0
IL-10
Epididymal R2
= 0.3453
TNF
-�
TNF
-�
IL-10 0
20 40 60 80
0 20 40 60 80 100 120
Mesenteric
R2= 0.0248
TNF
-�
TNF
-�
TNF
-�
(a)
Soybean Epididymal
0.0 20.0 40.0 60.0 80.0
0.0 20.0 40.0 60.0 80.0
IL-10
Mesenteric
0.0 20.0 40.0 60.0 80.0
0.0 20.0 40.0 60.0 80.0
IL-10 Retroperitoneal
0 20 40 60 80
0 20 40 60 80
IL-10
Liver
0.0 5.0 10.0 15.0 20.0 25.0 30.0
0.0 5.0 10.0 15.0 20.0
IL-10
Gastrocnemius
0.00 2.00 4.00 6.00 8.00 10.00
0.00 2.00 4.00 6.00 8.00 10.00 12.00
IL-10 r = 0.911277
P = 0.0006
r = 0.988944 P < 0.0001
r = −0.246206 P = 0.4929
r = 0.550695 P = 0.0792
r = 0.969779
TNF
-�
TNF
-�
TNF
-�
TNF
-�
TNF
-�
P < 0.0001
(b)
Lard Epididymal
0.0 50.0 100.0 150.0 200.0
0.0 20.0 40.0 60.0 80.0
IL-10
Mesenteric
0.0 10.0 20.0 30.0 40.0 50.0
0.0 20.0 40.0 60.0 80.0
IL-10
0 10 20 30 40 50 60
0 10 20 30 40 50
IL-10 Retroperitoneal
0.0 5.0 10.0 15.0 20.0 25.0 30.0
0.0 5.0 10.0 15.0 20.0 25.0
IL-10 Liver
Gastrocnemius
0.0 2.0 4.0 6.0 8.0 10.0 12.0
0.0 2.0 4.0 6.0 8.0 10.0 12.0 14.0
IL-10
r = 0.474349
P = 0.4195
r = 0.254673 P = 0.4777
R2= 0.2611
R2= 0.8805
−2.0
TNF
-�
TNF
-�
TNF
-�
TNF
-�
TNF
-�
r = 0.916984
P < 0.001
(c)
Epididymal
0.0 20.0 40.0 60.0 80.0 100.0
0.0 20.0 40.0 60.0 80.0 100.0
IL-10
0.0 20.0 40.0 60.0 80.0
0.0 10.0 20.0 30.0 40.0 50.0 60.0
IL-10 Mesenteric
Retroperitoneal
0 10 20 30 40 50 60
0 20 40 60 80
IL-10
Liver
0.0 5.0 10.0 15.0 20.0 25.0
0.0 5.0 10.0 15.0 20.0 25.0 30.0
IL-10 Gastrocnemius
0.0 2.0 4.0 6.0 8.0
0.0 2.0 4.0 6.0 8.0 10.0 12.0 14.0
IL-10 Hydrogenated vegetable fat
r = 0.992568
P < 0.0001
R2= 0.2025
r = 0.903513 P = 0.005
r = 0.95873 P < 0.0001
r = 0.923303 P < 0.0001
TNF
-�
TNF
-�
TNF
-�
TNF
-�
TNF
-�
(d)
groups in all tissues studied. he literature is controversial about the efects of a high-fat diet on TNF-� expression. A similar result was observed by Flanagan et al. [49], who showed that TNF-� gene expression in muscle was not signiicantly afected by the amount or type of dietary fat.
Hong et al. [50] showed that 10-week-old mice treated with a high-fat diet (55% fat by calories) for 3 weeks had lower IL-10 levels in muscle than control mice, accompanied by a decrease in muscle insulin sensitivity. Furthermore, IL-10 treatment prevents muscle insulin resistance by decreasing obesity-associated macrophages and cytokines in muscle from high-fat diet-treated mice. In the present study, the IL-10 gastrocnemius muscle content did not change in treated mice between 30 and 90 days of life with high-fat diets. However, the lard diet caused a decrease in IL-10 in MES and RET, and the same result was observed in RET from group H without any change in glycemia or insulin plasma concentration, suggesting that the type of diet, age of the animal, and time of treatment could have diferent efects depending on the tissues evaluated. In addition, we cannot dismiss the possibility that metabolic processes adapt to changes in dietary components during a speciic period of life. he IL-6 level in gastrocnemius muscle increased in group L compared with group C. he role of IL-6 action in obesity-associated insulin resistance remains highly con-troversial; Wunderlich et al. [51] showed that mice with a hepatic deiciency of IL-6 receptor a (IL-6Ra) develop insulin resistance not only in the liver but also in skeletal muscle and WAT. In addition, the IL-6 level increases with exercise, a situation in which glucose uptake by muscles is high [52]. However, it has been demonstrated that IL-6 administration causes hepatic insulin resistance [53].
It is interesting to note that, in the present study, the lard diet, which promoted a decrease in IL-10 in adipose tissue depots, caused an increase in IL-6 in gastrocnemius muscle. From these results, it is possible to suggest that the whole body of an adult animal tries to maintain carbohydrate and lipid metabolism homeostasis by modifying the expression and secretion of cytokines. In fact, by analyzing the ratio between IL-10 and TNF-�, which is used as an indicator of the inlammatory condition of the individual (where lower values are associated with a poor prognosis) [13, 14], we veriied a similar result among groups in all tissues studied. In addition, a positive correlation between TNF-�and IL-10 was observed in the liver (groups C, L and H) and muscle (all studied groups) (Figure 2), which could contribute to the maintenance of glucose, insulin, and lipid proiles at normal values.
5. Conclusion
In summary, our results demonstrate that enrichment of the diet with soybean oil or lard elevated carcass lipid content, whereas enrichment with hydrogenated vegetable oil did not alter this parameter as compared to control diet (4% of soybean oil). Only the lard diet modiied the fatty acid serum concentration, decreased IL-10 in adipose tissue depots and increased IL-6 in gastrocnemius muscle. hese suggested that the type of fatty acid present in the diet plays a part in
determining the amount of carcass lipid content and serum fatty acid concentration and inluences the cytokines content in the tissues.
Conflict of Interests
he authors of this research disclose any potential conlict of interests.
Acknowledgments
his research was supported by Coordenac¸˜ao de Ape-rfeic¸oamento de Pessoal de N´ıvel Superior (CAPES), Con-selho Nacional de Desenvolvimento Cient´ıico e Tecnol´ogico (CNPq) and Fundac¸˜ao de Amparo `a Pesquisa do Estado de S˜ao Paulo (FAPESP) (no. 2010/20079-2). he authors thank Dr Maria da Grac¸a Tavares do Carmo for the help in the analysis of the composition of fatty acids in the diets.
References
[1] World Health Organization, “Obesity and overweight,” 2013, http://www.who.int/mediacentre/factsheets/fs311/en/. [2] F. P. Heredia, S. Gomez-Mart´ınez, Marcos, and A. Obesity,
“Inl-ammation and immune system,”Proceedings of the Nutrition Society, vol. 71, no. 2, pp. 332–338, 2012.
[3] D. Estadella, M. P. Oller Do Nascimento, L. M. Oyama, E. B. Ribeiro, A. R. Dˆamaso, and A. de Piano, “Lipotoxicity: efects of dietary saturated and transfatty acids,”Mediators of Inlammation, vol. 2013, Article ID 137579, 13 pages, 2013. [4] J. O. Hill, H. R. Wyatt, and J. C. Peters, “Energy banlance and
obesity,”Circulation, vol. 126, no. 1, pp. 126–132, 2012.
[5] P. Trayhurn and I. S. Wood, “Adipokines: inlammation and the pleiotropic role of white adipose tissue,”British Journal of Nutrition, vol. 92, no. 3, pp. 347–355, 2004.
[6] H. H. M. Hermsdorf and J. B. R. Monteiro, “Gordura visceral, subcutˆanea ou intramuscular: onde est´a o problema?”Arquivos Brasileiros de Endocrinologia & Metabologia, vol. 48, no. 6, pp. 803–811, 2004.
[7] C. R. Balistreri, C. Caruso, and G. Candore, “he role of adipose tissue and adipokines in obesity-related inlammatory diseases,” Mediators of Inlammation, vol. 2010, Article ID 802078, 19 pages, 2010.
[8] M. M. Ibrahim, “Subcutaneous and visceral adipose tissue: stru-ctural and functional diferences,”Obesity Reviews, vol. 11, no. 1, pp. 11–18, 2010.
[9] H. Yanai, Y. Tomono, K. Ito, N. Furutani, H. Yoshida, and N. Tada, “he underlying mechanisms for development of hyper-tension in the metabolic syndrome,”Nutrition Journal, vol. 7, no. 1, article no 10, pp. 10–17, 2008.
[10] V. Exel, E. J. Gussekloo, A. J. Craen, M. Fr¨olich, A. B.-V. D. Wiel, and R. G. J. Westendorp, “Low production capacity of interleukin-10 associates with the metabolic syndrome and type 2 diabetes: the leiden 85-plus study,”Diabetes, vol. 51, no. 4, pp. 1088–1092, 2002.
[12] C. Tsatsanis, V. Zacharioudaki, A. Androulidaki et al., “Adipo-nectin induces TNF-�and IL-6 in macrophages and promotes tolerance to itself and other pro-inlammatory stimuli,” Bio-chemical and Biophysical Research Communications, vol. 335, no. 4, pp. 1254–1263, 2005.
[13] K. Kaur, A. K. Sharma, S. Dhingra, and P. K. Singal, “Interplay of TNF-�and IL-10 in regulating oxidative stress in isolated adult cardiac myocytes,”Journal of Molecular and Cellular Cardiology, vol. 41, no. 6, pp. 1023–1030, 2006.
[14] L. Leonidou, A. Mouzaki, M. Michalaki et al., “Cytokine pro-duction and hospital mortality in patients with sepsis-induced stress hyperglycemia,”Journal of Infection, vol. 55, no. 4, pp. 340–346, 2007.
[15] A. Lenz and F. B. Diamond Jr., “Obesity: the hormonal milieu,” Current Opinion in Endocrinology, Diabetes and Obesity, vol. 15, no. 1, pp. 9–20, 2008.
[16] E. K. Naderali, D. Estadella, M. Rocha et al., “A fat-enriched, glucose-enriched diet markedly attenuates adiponectin mRNA levels in rat epididymal adipose tissue,”Clinical Science, vol. 105, no. 4, pp. 403–408, 2003.
[17] E. Doucet, N. Alm´eras, and M. D. White, “Dietary fat com-position and human adiposity,”European Journal of Clinical Nutrition, vol. 52, no. 1, pp. 2–6, 1998.
[18] D. Estadella, L. M. Oyama, A. R. Dˆamaso, E. B. Ribeiro, and C. M. Oller Do Nascimento, “Efect of palatable hyperlipidic diet on lipid metabolism of sedentary and exercised rats,”Nutrition, vol. 20, no. 2, pp. 218–224, 2004.
[19] A. A. Bueno, L. M. Oyama, C. De Oliveira et al., “Efects of diferent fatty acids and dietary lipids on adiponectin gene expression in 3T3-L1 cells and C57BL/6J mice adipose tissue,” Plugers Archiv European Journal of Physiology, vol. 455, no. 4, pp. 701–709, 2008.
[20] L. P. Pisani, C. M. Oller Do Nascimento, A. A. Bueno et al., “Hydrogenated fat diet intake during pregnancy and lactation modiies the PAI-1 gene expression in white adipose tissue of ofspring in adult life,”Lipids in Health and Disease, vol. 7, article 13, 2008.
[21] A. A. Bueno, C. A. Habitante, L. M. Oyama, D. Estadella, E. B. Ribeiro, and C. M. Oller Do Nascimento, “White adipose tissue re-growth ater partial lipectomy in high fat diet induced obese Wistar rats,”Journal of Physiological Sciences, vol. 61, no. 1, pp. 55–63, 2011.
[22] P. G. Reeves, “Components of the AIN-93 diets as improve-ments in the AIN-76A diet,”Journal of Nutrition, vol. 127, no. 5, pp. 838S–841S, 1997.
[23] S. M. B. Tinoco, R. Sichieri, C. L. Setta, A. S. Moura, and M. D. G. Tavares Do Carmo, “Trans fatty acids from milk of Brazilian mothers of premature infants,”Journal of Paediatrics and Child Health, vol. 44, no. 1-2, pp. 50–56, 2008.
[24] C. M. Oller Do Nascimento and D. H. Williamson, “Evidence for conservation of dietary lipid in the rat during lactation and the immediate period ater removal of the litter. Decreased oxidation of oral [1-14C]triolein,”Biochemical Journal, vol. 239, no. 1, pp. 233–236, 1986.
[25] C. A. Cunha, F. S. Lira, J. C. Rosa Neto et al., “Green tea extract supplementation induces the lipolytic pathway, attenuates obe-sity, and reduces low-grade inlammation in mice fed a high-fat diet,”Mediators of Inlammation, vol. 2013, Article ID 635470, 8 pages, 2013.
[26] A. C. Rustan, B.-E. Hustvedt, and C. A. Drevon, “Dietary supplementation of very long-chain n-3 fatty acids decreases
whole body lipid utilization in the rat,”Journal of Lipid Research, vol. 34, no. 8, pp. 1299–1309, 1993.
[27] S. A. Noeman, H. E. Hamooda, and A. A. Baalash, “Biochemical study of oxidative stress markers in the liver, kidney and heart of high fat diet induced obesity in rats,”Diabetology and Metabolic Syndrome, vol. 3, no. 1, article 17, 2011.
[28] H. Takeuchi, T. Matsuo, K. Tokuyama, Y. Shimomura, and M. Suzuki, “Diet-induced thermogenesis is lower in rats fed a lard diet than in those fed a high oleic acid salower oil diet, a salower oil diet or a linseed oil diet,”Journal of Nutrition, vol. 125, no. 4, pp. 920–925, 1995.
[29] M. G. Dube, E. Beretta, H. Dhillon, N. Ueno, P. S. Kalra, and S. P. Kalra, “Central leptin gene therapy blocks high-fat diet-induced weight gain, hyperleptinemia, and hyperinsulinemia: increase in serum ghrelin levels,”Diabetes, vol. 51, no. 6, pp. 1729–1736, 2002.
[30] H. Oudart, R. Groscolas, C. Calgari et al., “Brown fat thermo-genesis in rats fed high-fat diets enriched with n-3 polyunsat-urated fatty acids,”International Journal of Obesity and Related Metabolic Disorders, vol. 21, no. 11, pp. 955–962, 1997.
[31] M. H. G. Ga´ıva, R. C. Couto, L. M. Oyama et al., “Polyunsatu-rated fatty acid-rich diets: efect on adipose tissue metabolism in rats,”British Journal of Nutrition, vol. 86, no. 3, pp. 371–377, 2001.
[32] R. M. Machado, J. T. Stefano, C. P. M. S. Oliveira et al., “Intake of trans fatty acids causes nonalcoholic steatohepatitis and reduces adipose tissue fat content,”Journal of Nutrition, vol. 140, no. 6, pp. 1127–1132, 2010.
[33] C. De Oliveira, C. Iwanaga-Carvalho, J. F. Mota, L. M. Oyama, E. B. Ribeiro, and C. M. Oller Do Nascimento, “Efects of adrenal hormones on the expression of adiponectin and adiponectin receptors in adipose tissue, muscle and liver,”Steroids, vol. 76, no. 12, pp. 1260–1267, 2011.
[34] M. Barnea, A. Shamay, A. H. Stark, and Z. Madar, “A high-fat diet has a tissue-speciic efect on adiponectin and related enzyme expression,”Obesity, vol. 14, no. 12, pp. 2145–2153, 2006. [35] J. W. Bullen, S. Bluher, T. Kelesidis, and C. S. Mantzoros, “Regu-lation of adiponectin and its receptors in response to devel-opment of diet-induced obesity in mice,”American Journal of Physiology, vol. 292, no. 4, pp. E1079–E1086, 2007.
[36] O. Tschritter, A. Fritsche, C. hamer et al., “Plasma adiponectin concentrations predict insulin sensitivity of both glucose and lipid metabolism,”Diabetes, vol. 52, no. 2, pp. 239–243, 2003. [37] J. B. Prins, “Adipose tissue as an endocrine organ,”Best Practice
& Research Clinical Endocrinology & Metabolism, vol. 16, no. 4, pp. 639–651, 2002.
[38] A. Xu, Y. Wang, H. Keshaw, L. Y. Xu, K. S. L. Lam, and G. J. S. Cooper, “he fat-derived hormone adiponectin alleviates alcoholic and nonalcoholic fatty liver diseases in mice,”Journal of Clinical Investigation, vol. 112, no. 1, pp. 91–100, 2003. [39] A. H. Berg and P. E. Scherer, “Adipose tissue, inlammation, and
cardiovascular disease,”Circulation Research, vol. 96, no. 9, pp. 939–949, 2005.
[42] E. A. Newsholme and A. R. Leech, “Catabolism of lipids,” in Biochemistry for the Medicalsciences, pp. 246–299, John Wiley & Sons, New York, NY, USA, 1983.
[43] B. Mittendorfer, “Origins of metabolic complications in obesity: adipose tissue and free fatty acid trafcking,”Current Opinion in Clinical Nutrition & Metabolic Care, vol. 14, no. 6, pp. 535–541, 2011.
[44] C. R. Bruce and D. J. Dyck, “Cytokine regulation of skeletal muscle fatty acid metabolism: efect of interleukin-6 and tumor necrosis factor-�,”American Journal of Physiology, vol. 287, no. 4, pp. E616–E621, 2004.
[45] A. L. Carey, G. R. Steinberg, S. L. Macaulay et al., “Interleukin-6 increases insulin-stimulated glucose disposal in humans and glucose uptake and fatty acid oxidation in vitro via AMP-activated protein kinase,”Diabetes, vol. 55, no. 10, pp. 2688– 2697, 2006.
[46] G. Van Hall, A. Steensberg, M. Sacchetti et al., “Interleukin-6 stimulates lipolysis and fat oxidation in humans,”Journal of Clinical Endocrinology and Metabolism, vol. 88, no. 7, pp. 3005– 3010, 2003.
[47] A. M. Caricilli, P. H. Nascimento, J. R. Pauli et al., “Inhibition of toll-like receptor 2 expression improves insulin sensitivity and signaling in muscle and white adipose tissue of mice fed a high-fat diet,”Journal of Endocrinology, vol. 199, no. 3, pp. 399–406, 2008.
[48] J. C. Moraes, A. Coope, J. Morari et al., “High-fat diet induces apoptosis of hypothalamic neurons,”PLoS ONE, vol. 4, no. 4, Article ID e5045, 2009.
[49] A. M. Flanagan, J. L. Brown, C. A. Santiago, P. Y. Aad, L. J. Spicer, and M. T. Spicer, “High-fat diets promote insulin resistance through cytokine gene expression in growing female rats,” Journal of Nutritional Biochemistry, vol. 19, no. 8, pp. 505–513, 2008.
[50] E.-G. Hong, J. K. Hwi, Y.-R. Cho et al., “Interleukin-10 prevents diet-induced insulin resistance by attenuating macrophage and cytokine response in skeletal muscle,”Diabetes, vol. 58, no. 11, pp. 2525–2535, 2009.
[51] F. T. Wunderlich, P. Str¨ohle, A. C. K¨onner et al., “Interleukin-6 signaling in liver-parenchymal cells suppresses hepatic inlam-mation and improves systemic insulin action,”Cell Metabolism, vol. 12, no. 3, pp. 237–249, 2010.
[52] B. K. Pedersen, A. Steensberg, C. Fischer et al., “he metabolic role of IL-6 produced during exercise: is IL-6 an exercise factor?”Proceedings of the Nutrition Society, vol. 63, no. 2, pp. 263–267, 2004.
Submit your manuscripts at
http://www.hindawi.com
Stem Cells
International
Hindawi Publishing Corporationhttp://www.hindawi.com Volume 2014
Hindawi Publishing Corporation
http://www.hindawi.com Volume 2014 INFLAMMATION
Hindawi Publishing Corporation
http://www.hindawi.com Volume 2014
Behavioural
Neurology
Endocrinology
International Journal ofHindawi Publishing Corporation
http://www.hindawi.com Volume 2014
Hindawi Publishing Corporation
http://www.hindawi.com Volume 2014
Disease Markers
Hindawi Publishing Corporation
http://www.hindawi.com Volume 2014 BioMed
Research International
Oncology
Journal of Hindawi Publishing Corporationhttp://www.hindawi.com Volume 2014
Hindawi Publishing Corporation
http://www.hindawi.com Volume 2014 Oxidative Medicine and Cellular Longevity Hindawi Publishing Corporation
http://www.hindawi.com Volume 2014
PPAR Research
The Scientiic
World Journal
Hindawi Publishing Corporationhttp://www.hindawi.com Volume 2014
Immunology Research Hindawi Publishing Corporation
http://www.hindawi.com Volume 2014 Journal of
Obesity
Journal ofHindawi Publishing Corporation
http://www.hindawi.com Volume 2014
Hindawi Publishing Corporation
http://www.hindawi.com Volume 2014 Computational and Mathematical Methods in Medicine
Ophthalmology
Journal ofHindawi Publishing Corporation
http://www.hindawi.com Volume 2014
Diabetes Research
Journal ofHindawi Publishing Corporation
http://www.hindawi.com Volume 2014
Hindawi Publishing Corporation
http://www.hindawi.com Volume 2014
Research and Treatment
AIDS
Hindawi Publishing Corporationhttp://www.hindawi.com Volume 2014
Gastroenterology Research and Practice
Hindawi Publishing Corporation
http://www.hindawi.com Volume 2014
Parkinson’s
Disease
Evidence-Based Complementary and Alternative Medicine
Volume 2014 Hindawi Publishing Corporation