The Relationship between Temperament and
Autistic Traits in a Non-Clinical Students
Sample
Ewa Pisula1*, RafałKawa1, Dorota Danielewicz2, Wojciech Pisula3
1Faculty of Psychology, University of Warsaw, Warsaw, Poland,2Institute of Applied Psychology, The Maria Grzegorzewska Academy of Special Education, Warsaw, Poland,3Institute of Psychology, Polish Academy of Sciences, Warsaw, Poland
Abstract
Since temperament affects the development of social behaviours and interpersonal rela-tions, the possible links between autistic traits and temperament are of particular interest. The purpose of the study was to explore the relationships between autistic traits and tem-peramental characteristics in the framework of the Regulative Temperament Theory by Strelau, and the Emotionality, Activity and Sociability theory by Buss and Plomin, with par-ticular emphasis on gender differences. The Autism Spectrum Quotient (AQ), Formal Char-acteristics of Behaviour–Temperament Inventory and Temperament Survey for Adults were administered. The participants were 593 university students, including 364 females and 229 males. Results showed positive correlations between autistic traits and Emotional Reactivity, Perseveration, Distress, Fear and Anger, and negative correlations with Activity, Briskness, Endurance and Sociability. The results of multiple regression analyses involving the Autism Spectrum Quotient score as a dependent measure were different for females and males. Results of exploratory PCA analysis showed that AQ score, Sociability and Ac-tivity loaded one factor (with AQ loading being opposite to two others). High AQ scorers demonstrated higher Emotional Reactivity, Perseveration, Distress and Anger, and lower Briskness, Endurance, Activity and Sociability as compared to norms for the general popu-lation. In this study we showed that temperament measures were able to identify items that correlated in parts with autistic traits, while other items were obverse. The relationships be-tween temperament and autistic traits differ slightly bebe-tween genders. We assume that with regard to the broader autism phenotype, temperaments might be helpful in characterizing healthy control samples.
Introduction
Autism spectrum disorders (ASD) are a group of neurodevelopmental disorders characterized by the co-occurrence of deficits in social communication and restrictive, repetitive patterns of
OPEN ACCESS
Citation:Pisula E, Kawa R, Danielewicz D, Pisula W (2015) The Relationship between Temperament and Autistic Traits in a Non-Clinical Students Sample. PLoS ONE 10(4): e0124364. doi:10.1371/journal. pone.0124364
Academic Editor:Marina A. Pavlova, University of Tuebingen Medical School, GERMANY
Received:October 24, 2014
Accepted:March 6, 2015
Published:April 10, 2015
Copyright:© 2015 Pisula et al. This is an open access article distributed under the terms of the Creative Commons Attribution License, which permits unrestricted use, distribution, and reproduction in any medium, provided the original author and source are credited.
Data Availability Statement:All relevant data are within the paper and its Supporting Information files.
Funding:The study was supported by a grant from the Polish National Science Centre (N N106 352940) and by the Warsaw University. The funders had no role in study design, data collection and analysis, decision to publish, or preparation of the manuscript.
behaviour and interests [1]. The aetiology of these disorders is presently unclear, but it is hy-pothesized that genetic factors may be important [2,3].
The claim of an underlying hereditary mechanism in autism is strengthened by the fact that parents and siblings of individuals with ASD are more likely than the general population to demonstrate certain mild symptoms of autism, referred to as thebroader autism phenotype
(BAP) [4,5,6,7]. BAP covers specific characteristics in terms of social and communication skills, cognitive processes and personality [8]. Traits such as aloofness, restrictive interests, ri-gidity, anxiousness, impulsiveness, shyness, irritability and eccentricity are seen more often in first-degree non-autistic relatives of people with autism than in relatives of typically developing children or children with other disabilities [9,10,11,12,13]. Parents and siblings of individuals with ASD are also described sometimes as tactless, hypersensitive, reserved, insecure, negativis-tic, introverted, neurotic and self-critical [9,11,13,14,15].
Autistic characteristics may occur not only in the relatives of individuals with ASD who are not themselves diagnosed with the disorder, but also in other non-clinical groups [16,17]. Baron-Cohen and colleagues [18] suggested that these traits lie on a continuum and are nor-mally distributed in the general population. This makes them similar to other nornor-mally-distrib- normally-distrib-uted characteristics. It also opens up the possibility to interpret symptoms presented in the clinical group as the outcome of extremal values of commonly-shared dimensions. The authors developed a brief self-administered Autism Spectrum Quotient (AQ) [18], useful both in screening for autism among adults with normal intelligence and as a measure of severity of autistic traits in the general population. The instrument has become highly popular and has been used in a number of studies, including those on the relationships between autistic traits and personality dimensions measured by other questionnaires [19,20,21].
Austin [19], as well as Wakabayashi, Baron-Cohen and Wheelwright [21], analysed the rela-tionship between AQ and the“Big Five”dimensions of personality [22], and found total AQ score to be correlated positively with Neuroticism, while negatively with Extraversion. Analysis of regression confirmed that the personality variables accounted for 36.9% of variance in the total AQ score in the study by Austin [19], and 24.1% in the research by Wakabayashi et al. [21]. Thus, personality traits were significantly related to autistic traits and explained a relative-ly large portion of their variance, though autistic traits do not fulrelative-ly fit within the Big Five struc-ture of personality.
The possible links of autistic traits with temperament are of particular interest. Even though the terms“personality”and“temperament”are sometimes used interchangeably, temperament is rather construed as referring to individual differences that are biologically influenced [23,24,
25]. It affects the development of social behaviours and interpersonal relations, including the earliest infant-mother relationships [26,27]. Not only does temperament influence behavioural expression, but it constitutes an important factor affecting individuals' social development as well. Autistic characteristics, viewed as an element of the BAP, are also considered to be biolog-ically and genetbiolog-ically determined [28,29]. It seems, therefore, that due to widely-held theoreti-cal claims concerning strong biologitheoreti-cal/genetic fundamental characteristics, analysis of the relationships between temperament and autistic traits may contribute to our understanding of the specifics of autistic traits.
Very few research projects to date have sought to investigate the relationship between tem-perament and AQ in the general population. Kunihira and colleagues [20] employed the Tem-perament and Character Inventory (TCI) [30], finding significant correlations between AQ and three out of the four dimensions of temperament: Novelty Seeking and Reward Depen-dence correlated negatively, while Harm Avoidance (defined as a genetically determined pre-disposition for intense responses to aversive stimuli) correlated positively. Analysis of the
Temperament and Autistic Traits
results of the 25% of participants with the highest AQ scores revealed an association between high AQ scores and obsessive temperament.
The present study aims at analysing the relationship between temperament and autistic traits in the general population, taking as its theoretical framework two theories of tempera-ment that are well-established in the literature: the Regulative Theory of Temperatempera-ment (RTT) by Strelau [25,31] and the Emotionality, Activity and Sociability (EAS) theory of temperament by Buss and Plomin [32,33]. Both theories define temperament as a partly innate basis of human behaviour involved in the development of personality traits; however, Strelau describes temperamental traits in terms of formal characteristics of behaviour, while Buss and Plomin see them primarily as content-related, with only activity being associated with the style of action.
Under Strelau’s approach [25], temperament is embedded in early development and is a marker for relatively stable, genetically-based determinants of behaviour. The role of tempera-ment is to regulate stimulus input. The biological mechanisms underlying temperatempera-ment taken together make up the so-called neuro-hormonal individuality; temperament is shaped by a unique, individual configuration of physiological and biochemical characteristics of the central and autonomic nervous system, as well as hormonal characteristics [31].
RTT proposes six temperamental traits: Briskness, Perseveration, Emotional Reactivity, Ac-tivity, Endurance and Sensory Sensitivity. Briskness (BR) is defined as a predisposition to react promptly, to perform activities quickly and to shift easily from one activity to another in re-sponse to changes in the environment. Perseveration (PE) is seen as a tendency to maintain and to repeat activities (behaviours) or experience emotions after the withdrawal of evoking sti-muli. Emotional Reactivity (ER) is a relatively stable and individual-specific magnitude of re-sponses to stimuli. Activity (AC) is a predisposition to engage in activities of high stimulative value or to prefer behaviours that provide strong stimulation from the environment. Sensory Sensitivity (SS) is defined as a tendency to react to stimuli which have a low stimulative value, and Endurance (EN) as a predisposition to function effectively in situations requiring sustained or excessive stimulative activity and under high stimulation.
The temperamental traits included in RTT have been shown to be associated with social functioning. A study using the Formal Characteristics of Behaviour—Temperament Inventory [34], a measure based on RTT, found that social competence is positively correlated with Activ-ity, Briskness, and, to a lesser extent, with Sensory Sensitivity and Endurance [35]. Negative correlations were found with respect to Emotional Reactivity and Perseveration. In addition, a negative relationship was found between emotional intelligence and Emotional Reactivity, and positive ones between emotional intelligence and Activity, Sensory Sensitivity and Briskness [36].
In one published study on the relationship between autistic traits and temperament within the RTT approach,Żmijewska and Pisula [37] found total AQ score to be positively correlated with Emotional Reactivity and Perseveration, and negatively with Activity, Briskness and En-durance. The study was conducted on a small sample of university students in Warsaw (Po-land), and the results served as the foundation for a preliminary report to encourage further investigation of correlations between the variables of interest.
duration, and intensity of motor activities, and a tendency to choose high-energy activities over low-energy activities. Sociability is the tendency to prefer the presence of others to being alone and to seek companionship, and manifests itself in high motivation to engage in social contact.
Studies on university students using the EAS Temperament Scale [33] have demonstrated that Fear and Distress are predictors for interpersonal relationships. It is noteworthy that sex is a crucial factor affecting these relationships [38]. Sex differences have also been well-docu-mented with respect to autistic traits, measured by AQ score, in the general population: such traits are more severe in males than in females [18,19,39]. It seems therefore reasonable to study the possible relationships between temperament and autistic characteristics across gen-ders. The purpose of the study was to explore these relationships, in the framework of the AQ concept by Baron-Cohen et al. [18], RTT by Strelau [25] and EAS theory by Buss and Plomin [33].
Method
2.1. Participants
There were 593 participants in the study, including 364 females and 229 males aged 18–41 years (M = 22.82 years; SD = 4.17). Mean age was 22.5 years for females (SD = 4.45) and 23.32 years for males (SD = 3.63), t(591) = 2.336, p<0.05. The participants were university students
of humanities, social sciences, economics and science.
2.2. Instruments
Autism Spectrum Quotient (AQ). AQ [18] is a quantitative measure of autistic traits in
the general population. The scale contains 50 statements to which participants respond on a 4-point Likert scale (1-definitely agree, 2-slightly agree, 3-slightly disagree, 4-definitely dis-agree). In half of the statements the diagnostic answer is“agree”, and in the other half“ dis-agree”. One point is awarded for each diagnostic answer. The total score ranges from 0 to 50 points, with higher scores suggesting a greater magnitude of autistic traits.
There are five subscales in AQ: Social Skill, Communication, Attention Switching, Imagina-tion and AttenImagina-tion to Detail. Currently available data from research on the properties of this scale indicates that measurement reliability for the total score is satisfactory, but it is signifi-cantly lower in the case of some subscales [19,40,41,42]. Several studies have failed to confirm the five-factor structure of AQ [40,43,44,45]. For that reason, in the present study we decided to focus on analysing the total AQ score. The Polish version of AQ [42] was used in this study.
The Formal Characteristics of Behaviour—Temperament Inventory (FCB-TI). The
FCB-TI [34] is an internationally used self-report scale, developed originally in Polish, com-prising 120 items elicitingYESorNOresponses. Behaviours are assessed on six subscales (de-scribed in the Introduction): Briskness, Perseveration, Sensory Sensitivity, Emotional Reactivity, Endurance, and Activity. Raw scores for each subscale are obtained from the total number of diagnostic responses and range from 0 to 20 points. Higher scores indicate greater magnitude of a given characteristic.
Emotionality Activity and Sociability—Temperament Survey for Adults (EAS-TS). The
self-report EAS-TS instrument was developed on the basis of temperament theory by Buss and Plomin [33] as a diagnostic measure for adults. It consists of 20 items to which subjects re-spond on a 5-point scale ranging from 1 (not very typical/characteristic) to 5 (very typical/ characteristic). The survey assesses 5 subscales: Distress, Anger, Fear, Activity and Sociability. The Polish version adapted by Oniszczenko [46] was used in the present study.
In addition, a demographic survey was used containing questions about participants’age, sex, place of residence and field of study. Participants were also asked if they had ever received
Temperament and Autistic Traits
a diagnosis of ASD (childhood autism, Asperger’s syndrome or pervasive developmental disor-der unspecified) and whether they had relatives with such a diagnosis.
2.3. Procedure
Participants were tested in groups during classes at the university. The study was approved by the Ethics Committee of the Faculty of Psychology at the University of Warsaw. According to local regulations, obtaining written consent from adult participants in studies not involving in-vasive or potentially stressful/harmful procedures is not required. Participants were informed about the voluntary nature of their participation. This procedure was also approved by the Eth-ics Committee of the Faculty of Psychology at the University of Warsaw. The order of scales in the sets distributed to students was randomized. The study was anonymous. All participants completed the questionnaires on their own, without external support or advice. Returned forms that included missing responses to any items or more than one answer to a given item were dropped from further analysis. The number of participants given above includes only the sets qualified for analysis. According to the answers in the demographic survey, none of the participants had been diagnosed with ASD or other personality or psychotic disorders. Ten participants reported having non-immediate relatives who had received a diagnosis of ASD (mostly second cousins).
2.4. Data analysis
In this study a correlational approach and regression analysis were used. The forward entry re-gression method was utilised. The correlation and rere-gression analyses were performed sepa-rately in both gender groups. Statistical calculations were made using Tanagra 1.4.50. The gender groups comparisons were performed using Student’s t-test for independent samples. In order to estimate temperament traits as a predictor of AQ, the Forward Entry Selection Regres-sion Analysis method was used. The AQ score was taken as a dependent variable, while six temperamental dimensions from FCB-TI (Briskness, Perseveration, Sensory Sensitivity, Emo-tional Reactivity, Endurance and Activity) and five dimensions (Distress, Fear, Anger, Sociabil-ity and ActivSociabil-ity) from EAS-TS served as predictors. In order to estimate the unrelatedness of AQ and the temperamental measures used, exploratory principal component analysis was con-ducted using VARIMAX rotation.
2.5. Results
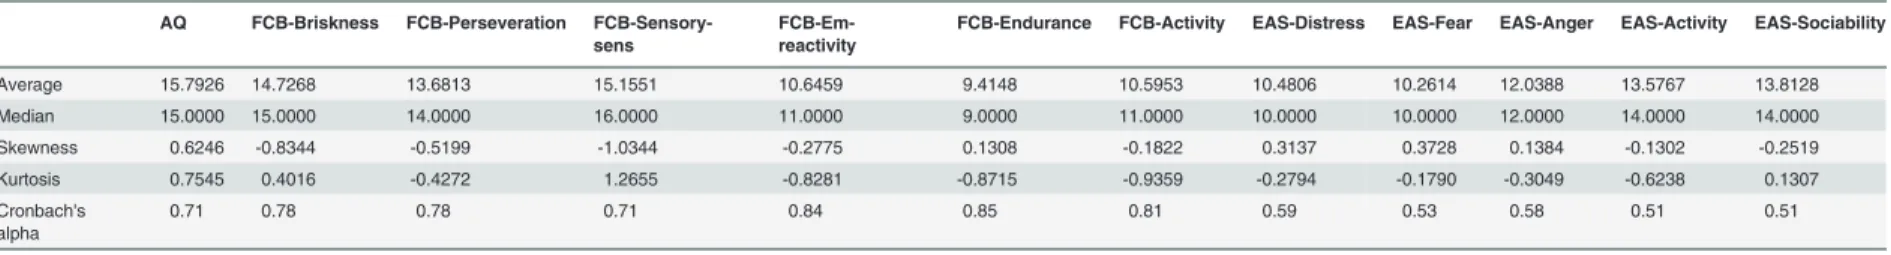
2.5.1. Basic properties and reliability of the measures used in this study. Table 1shows
the normality characteristics of the analysed variables. Since neither kurtosis nor skewness of the analysed variables did not exceeded the critical values, we have not transformed the data in any way.
The reliability of the AQ total scale and all FCB-TI scales was satisfactory. For all EAS scales the reliability was lower, which is in accordance with previous data by Oniszczenko [46]. How-ever, the reliability analysis based on the test-retest method showed much better estimations [46]. Therefore we have accepted the characteristics obtained in this study as satisfactory.
2.5.2. Comparison of AQ scores of females and males. Mean AQ score was 15.03
(SD = 4.55) for females and 17.00 (SD = 5.70) for males. The features of the AQ distribution in the sample of females and males are presented inFig 1.
2.5.3. AQ’s correlations with FCB-TI and EAS-TS. The AQ's correlations with
Table 1. Normality characteristics of the analyzed variables.
AQ FCB-Briskness FCB-Perseveration
FCB-Sensory-sens
FCB-Em-reactivity
FCB-Endurance FCB-Activity EAS-Distress EAS-Fear EAS-Anger EAS-Activity EAS-Sociability
Average 15.7926 14.7268 13.6813 15.1551 10.6459 9.4148 10.5953 10.4806 10.2614 12.0388 13.5767 13.8128
Median 15.0000 15.0000 14.0000 16.0000 11.0000 9.0000 11.0000 10.0000 10.0000 12.0000 14.0000 14.0000 Skewness 0.6246 -0.8344 -0.5199 -1.0344 -0.2775 0.1308 -0.1822 0.3137 0.3728 0.1384 -0.1302 -0.2519
Kurtosis 0.7545 0.4016 -0.4272 1.2655 -0.8281 -0.8715 -0.9359 -0.2794 -0.1790 -0.3049 -0.6238 0.1307
Cronbach's alpha
0.71 0.78 0.78 0.71 0.84 0.85 0.81 0.59 0.53 0.58 0.51 0.51
doi:10.1371/journal.pone.0124364.t001
Temperam
ent
and
Autistic
Traits
PLOS
ONE
|DOI:10.137
1/journal.p
one.0124364
April
10,
2015
6/1
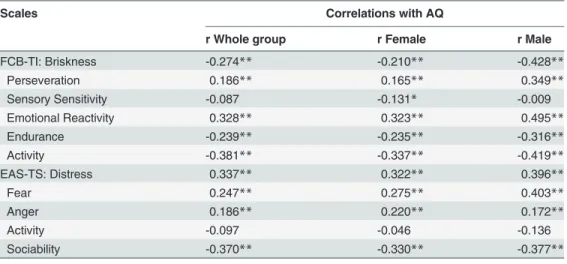
All temperament dimensions measured in FCB-TI were proved to correlate with AQ. Emo-tional Reactivity and Perseveration correlated positively, while Activity, Briskness, Endurance and Sensory Sensitivity correlated negatively with AQ. Correlation analysis in the group of
Fig 1. Box plot showing the differences between male and female subsamples.Whiskers and box bands denote quartiles.Comparison using Student’s t-test for independent samples showed that males scored higher than females (t(591) = 4.655, p<0.001), meaning that the magnitude of autistic traits was
higher in the former.
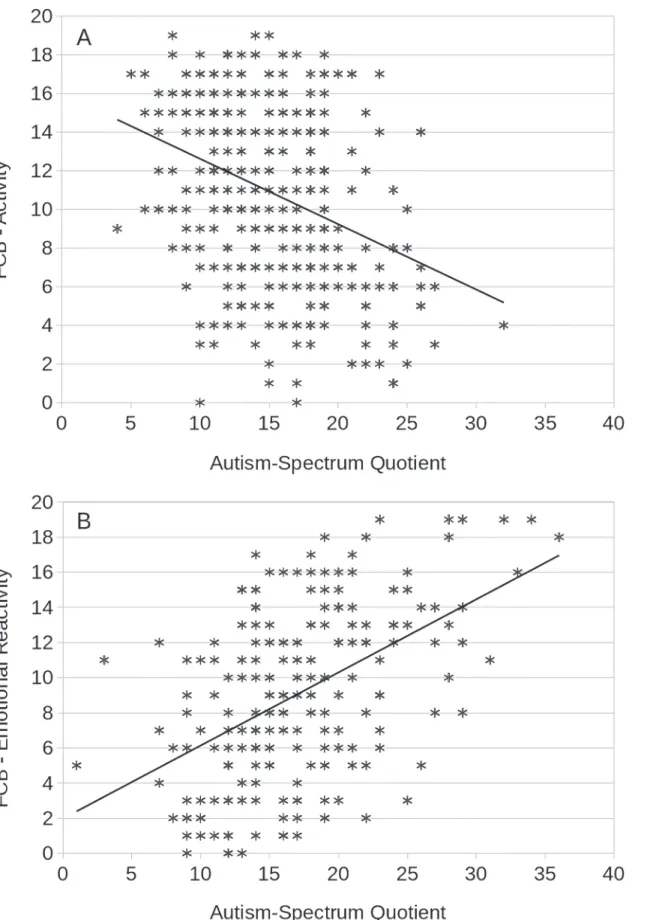
females and males yielded comparable results, however, the strength of individual correlations was higher in males. In females, the strongest correlation was a negative one between AQ and Activity (r = -.337), followed by a positive one with Emotional Reactivity (r = .323). In males, the strongest one was a positive correlation between AQ and Emotional Reactivity (r = .495), followed by a negative one with Briskness (r = -.428) and Activity (r = -.419). The strongest correlations found in gender groups are shown inFig 2.
Correlations between AQ and temperament measured using EAS-TS were slightly weaker, but also present for all evaluated temperamental characteristics. AQ correlated positively with Distress, Fear and Anger, and negatively with Sociability and Activity. When the total sample is divided according to sex, among females the strongest correlations were the negative correla-tion with Sociability (r = -.330) and positive with Distress (r = .322). In males, the strongest correlation was with Fear (r = .403), followed by Distress (r = .396) and Sociability (r = -.377).
2.5.4. Multiple regression analysis. The results of the Forward Entry Selection Regression
analyses are presented for females inTable 3and for males inTable 4.
Among males, the model predicting AQ from four temperamental characteristics explained approximately 35% of variance in AQ (AdjustedR2= 0.349;F(4,224)= 31.54,p<0.01). The
strongest predictor was Emotional Reactivity (FCB-TI, positive correlation), followed by Socia-bility (EAS-TS, negative correlation), Briskness (FCB-TI, negative correlation) and Persevera-tion (FCB-TI, positive correlaPersevera-tion).
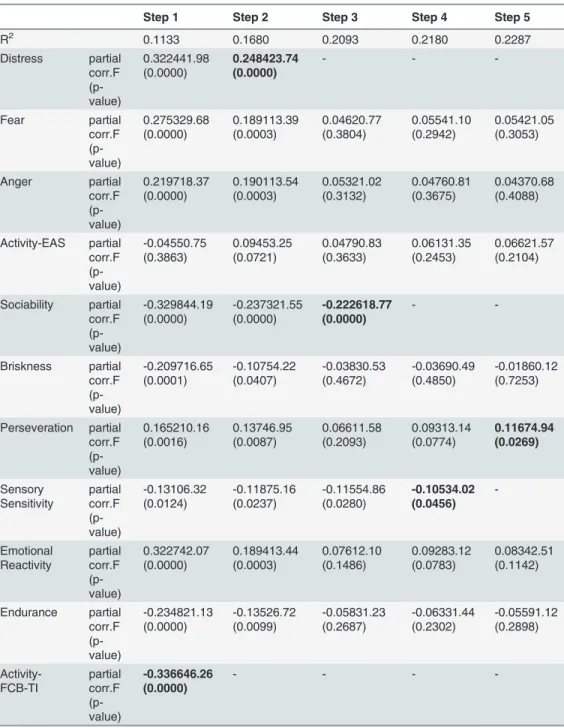
Among females, the model incorporating five temperamental characteristics explained ap-proximately 22% of variance in AQ (AdjustedR2= 0.218;F(5,358)= 21.226,p<0.01). The
stron-gest predictor in the model was Activity (measured by FCB-TI, negative correlation), followed by Distress (from EAS-TS, positive correlation) and Sociability (EAS-TS, negative correlation), Sensory Sensitivity (FCB-TI, negative correlation) and Perseveration (from EAS-TS, positive correlation).
2.5.5. Temperamental characteristics of high AQ scorers. A subgroup of patients with
extremely high AQ scores was compared with the results of normalization groups of the FCB-TI and EAS-TS manuals, matched for age group. It has been shown, that relatively good screening effectiveness in Poland would be achieved at a 25+ cut-off, which was reached by 80% of participants with ASD, 11.67% of the Control group and 9.6% of the large Students
Table 2. Correlations between AQ and FCB-TI and EAS-TS.
Scales Correlations with AQ
r Whole group r Female r Male
FCB-TI: Briskness -0.274** -0.210** -0.428**
Perseveration 0.186** 0.165** 0.349**
Sensory Sensitivity -0.087 -0.131* -0.009
Emotional Reactivity 0.328** 0.323** 0.495**
Endurance -0.239** -0.235** -0.316**
Activity -0.381** -0.337** -0.419**
EAS-TS: Distress 0.337** 0.322** 0.396**
Fear 0.247** 0.275** 0.403**
Anger 0.186** 0.220** 0.172**
Activity -0.097 -0.046 -0.136
Sociability -0.370** -0.330** -0.377**
*—p<0.01 **—p<0.001.
doi:10.1371/journal.pone.0124364.t002
Temperament and Autistic Traits
Fig 2. The correlation plots shown for the strongest coefficient values in group of A—females, B-males.
sample [42]. Therefore, we have used the 25+ cut-off point to extract the high AQ individuals from our present sample. The subgroup of high AQ scorers (n = 28) included 19 males and 9 females.Table 5presents descriptive statistics of temperamental indices calculated for the high
Table 3. Results of Forward Entry Selection Regression Analysis in a group of females, involving Total-AQ variable as a predicted parameter and EAS-TS and FCB-TI scales as predictors.
Step 1 Step 2 Step 3 Step 4 Step 5
R2 0.1133 0.1680 0.2093 0.2180 0.2287
Distress partial corr.F (p-value) 0.322441.98 (0.0000) 0.248423.74 (0.0000) - - -Fear partial corr.F (p-value) 0.275329.68 (0.0000) 0.189113.39 (0.0003) 0.04620.77 (0.3804) 0.05541.10 (0.2942) 0.05421.05 (0.3053) Anger partial corr.F (p-value) 0.219718.37 (0.0000) 0.190113.54 (0.0003) 0.05321.02 (0.3132) 0.04760.81 (0.3675) 0.04370.68 (0.4088) Activity-EAS partial corr.F (p-value) -0.04550.75 (0.3863) 0.09453.25 (0.0721) 0.04790.83 (0.3633) 0.06131.35 (0.2453) 0.06621.57 (0.2104) Sociability partial corr.F (p-value) -0.329844.19 (0.0000) -0.237321.55 (0.0000) -0.222618.77 (0.0000) - -Briskness partial corr.F (p-value) -0.209716.65 (0.0001) -0.10754.22 (0.0407) -0.03830.53 (0.4672) -0.03690.49 (0.4850) -0.01860.12 (0.7253) Perseveration partial corr.F (p-value) 0.165210.16 (0.0016) 0.13746.95 (0.0087) 0.06611.58 (0.2093) 0.09313.14 (0.0774) 0.11674.94 (0.0269) Sensory Sensitivity partial corr.F (p-value) -0.13106.32 (0.0124) -0.11875.16 (0.0237) -0.11554.86 (0.0280) -0.10534.02 (0.0456) -Emotional Reactivity partial corr.F (p-value) 0.322742.07 (0.0000) 0.189413.44 (0.0003) 0.07612.10 (0.1486) 0.09283.12 (0.0783) 0.08342.51 (0.1142) Endurance partial corr.F (p-value) -0.234821.13 (0.0000) -0.13526.72 (0.0099) -0.05831.23 (0.2687) -0.06331.44 (0.2302) -0.05591.12 (0.2898) Activity-FCB-TI partial corr.F (p-value) -0.336646.26 (0.0000) - - -
-Note—significant values have been bolded.
Global results: R2= 0.22806; Adjusted R2= 0.217887; Sigma error = 4.027546; F(5,358) = 21,2255,
p<0.00001.
doi:10.1371/journal.pone.0124364.t003
Temperament and Autistic Traits
AQ scorers’group and the results of between-group comparisons (high AQ scorersvs. normal values from the scales’manuals [34,46]).
As seen inTable 5, the results of high AQ scorers differed from normalization samples in the majority of subscales used (with the exceptions of Sensory Sensitivity from FCB-TI and
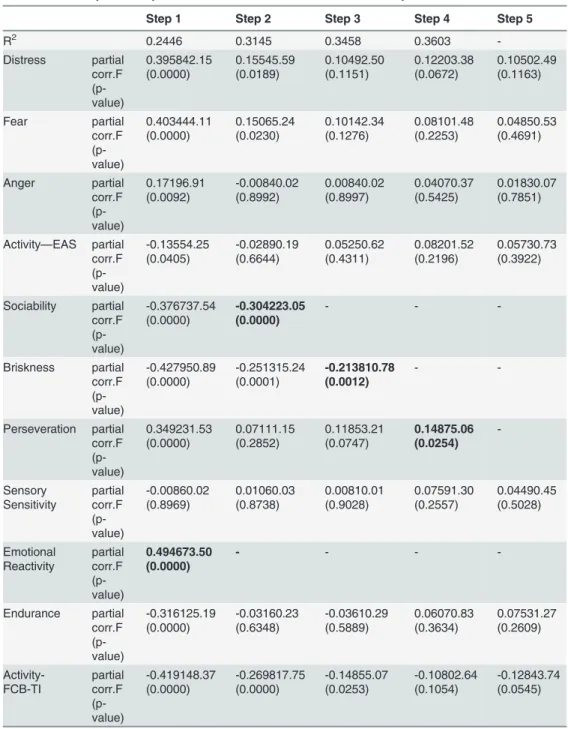
Table 4. Results of Forward Entry Selection Regression Analysis in a group of males, involving Total-AQ variable as a predicted parameter and EAS-TS and FCB-TI scales as predictors.
Step 1 Step 2 Step 3 Step 4 Step 5
R2 0.2446 0.3145 0.3458 0.3603
-Distress partial corr.F (p-value) 0.395842.15 (0.0000) 0.15545.59 (0.0189) 0.10492.50 (0.1151) 0.12203.38 (0.0672) 0.10502.49 (0.1163) Fear partial corr.F (p-value) 0.403444.11 (0.0000) 0.15065.24 (0.0230) 0.10142.34 (0.1276) 0.08101.48 (0.2253) 0.04850.53 (0.4691) Anger partial corr.F (p-value) 0.17196.91 (0.0092) -0.00840.02 (0.8992) 0.00840.02 (0.8997) 0.04070.37 (0.5425) 0.01830.07 (0.7851)
Activity—EAS partial corr.F (p-value) -0.13554.25 (0.0405) -0.02890.19 (0.6644) 0.05250.62 (0.4311) 0.08201.52 (0.2196) 0.05730.73 (0.3922) Sociability partial corr.F (p-value) -0.376737.54 (0.0000) -0.304223.05 (0.0000) - - -Briskness partial corr.F (p-value) -0.427950.89 (0.0000) -0.251315.24 (0.0001) -0.213810.78 (0.0012) - -Perseveration partial corr.F (p-value) 0.349231.53 (0.0000) 0.07111.15 (0.2852) 0.11853.21 (0.0747) 0.14875.06 (0.0254) -Sensory Sensitivity partial corr.F (p-value) -0.00860.02 (0.8969) 0.01060.03 (0.8738) 0.00810.01 (0.9028) 0.07591.30 (0.2557) 0.04490.45 (0.5028) Emotional Reactivity partial corr.F (p-value) 0.494673.50 (0.0000) - - - -Endurance partial corr.F (p-value) -0.316125.19 (0.0000) -0.03160.23 (0.6348) -0.03610.29 (0.5889) 0.06070.83 (0.3634) 0.07531.27 (0.2609) Activity-FCB-TI partial corr.F (p-value) -0.419148.37 (0.0000) -0.269817.75 (0.0000) -0.14855.07 (0.0253) -0.10802.64 (0.1054) -0.12843.74 (0.0545)
Note—significant values have been bolded.
Global results: R2 = 0.360298; Adjusted-R2= 0.348874; Sigma error = 4.601722; F(4,224) = 31,5407,
p<0.0001.
Fear and Activity from EAS-TS). Compared to normalization samples, individuals with high AQ demonstrated higher Emotional Reactivity, Perseveration, Distress and Anger, and lower other temperamental dimensions.
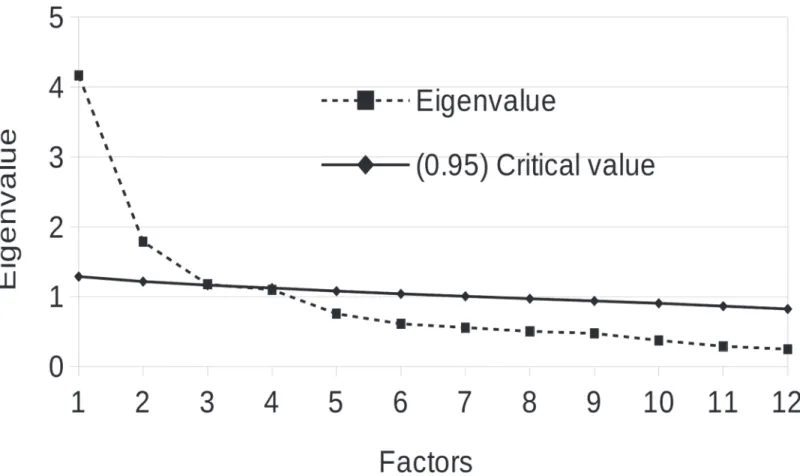
2.5.6. Exploratory PCA analysis. A three-factor model of Principal Component Analysis
was adopted involving Parallel Analysis (Fig 3) for the determination of appropriate number of extracted factors.Table 6presents factor loadings of individual scales used in the study.
AsTable 6indicates, Factor I is comprised of five components: Emotional Reactivity,
Per-severation and Fear (positive loadings), Endurance and Briskness (negative loadings). Factor II was made up of Sociability, Activity (from FCB-TI) (positive loadings), and AQ (negative load-ing). The third factor comprised Anger, Distress and Activity (EAS-TS) (positive loadings). To-gether, these factors explained 60% of the total variance of the measured variables.
Discussion
The results of the present study confirm the presence of multiple relationships between tem-perament as measured by FCB-TI [34] and EAS-TS [33] and autistic traits, measured by AQ [18], in a sample from the general population. Correlation analysis conducted on the whole sample showed that the majority of temperament dimensions (with the exceptions of Sensory Sensitivity from FCB-TI and Activity from EAS-TS) were significantly correlated with autistic traits. Positive correlations were found with Emotional Reactivity, Perseveration (from FCB-TI), Distress, Fear and Anger (EAS-TS), while negative ones were found with Activity, Briskness, Endurance (FCB-TI) and Sociability (EAS-TS). All these correlations were low, as
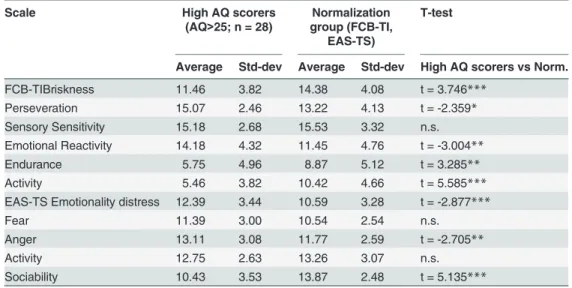
Table 5. Descriptive statistics of FCB-TI and EAS-TS scales in high AQ scorers group and normaliza-tion in respective groups, as well as the results of their comparison with the t-test.
Scale High AQ scorers
(AQ>25; n = 28)
Normalization group (FCB-TI,
EAS-TS)
T-test
Average Std-dev Average Std-dev High AQ scorers vs Norm.
FCB-TIBriskness 11.46 3.82 14.38 4.08 t = 3.746***
Perseveration 15.07 2.46 13.22 4.13 t = -2.359*
Sensory Sensitivity 15.18 2.68 15.53 3.32 n.s.
Emotional Reactivity 14.18 4.32 11.45 4.76 t = -3.004**
Endurance 5.75 4.96 8.87 5.12 t = 3.285**
Activity 5.46 3.82 10.42 4.66 t = 5.585***
EAS-TS Emotionality distress 12.39 3.44 10.59 3.28 t = -2.877***
Fear 11.39 3.00 10.54 2.54 n.s.
Anger 13.11 3.08 11.77 2.59 t = -2.705**
Activity 12.75 2.63 13.26 3.07 n.s.
Sociability 10.43 3.53 13.87 2.48 t = 5.135***
*p<0.05
**p<0.01
***p<0.001
Note: 1. Values of FCB-TI [44] were taken for the 20–29 years age group; 2. Values from EAS-TS (Polish version) manual [46] were combined across sex; 3. FCB-TI normalization group n = 1130; EAS-TS group n = 1613.
Descriptive statistics of the normalization groups come from the published manuals of the Polish version of the questionnaires [44,46].
doi:10.1371/journal.pone.0124364.t005
Temperament and Autistic Traits
Fig 3. Scree plot of PCA involving the AQ (total result) and FCB-TI and EAS-TS PCA, and critical values of parallel analysis for the determination of significant eigenvalues.
doi:10.1371/journal.pone.0124364.g003
Table 6. Results of exploratory PCA with Varimax rotation.
Factor 1 Factor 2 Factor 3
- Corr. Corr. Corr.
Emotional Reactivity 0.821 -0.150 0.292
Endurance -0.791 0.103 -0.063
Briskness -0.715 0.255 0.042
Perseveration 0.637 0.274 0.352
Fear 0.632 -0.112 0.456
Sociability 0.017 0.793 -0.124
Activity (FCB-TI) -0.413 0.677 0.095
Total-AQ 0.182 -0.608 0.320
Anger 0.213 -0.050 0.768
Distress 0.429 -0.247 0.706
Activity (EAS-TS) -0.369 0.414 0.551
Sensory Sensitivity 0.002 0.337 0.046
Variance Explained 27% 17% 16%
Factor loadings higher than│0.05│have been bolded.
none of them surpassed 0.4, although for two dimensions of temperament (Activity from FCB-TI and Sociability from EAS-TS) they approached that level.
Previous reports on autistic traits in the general population have implied the presence of sex differences [18,19,42,47]. This is confirmed by our findings: autistic traits were expressed more clearly in males. The direction of correlations between AQ and temperament directions was the same in both gender groups. The strongest correlations were detected in the group of men between AQ and such temperament dimensions measured by FCB-TI as Emotional Reac-tivity, Briskness and Activity. In females, the strongest negative correlation was that between AQ and Activity, followed by a positive correlation with Emotional Reactivity. As for the di-mensions of temperament described in the theory of temperament by Buss and Plomin [33], autistic traits correlated positively with Distress, Fear and Anger, and negatively with Sociabili-ty. Only in the case of Activity were no significant relationships found.
Our findings cannot be easily compared with other reports due to the lack of studies on the relationship between autistic traits and temperament as described in RTT and Buss and Plo-min’s approach. They confirm the results of a pilot study in whichŻmijewska and Pisula [37] found the same correlations between AQ and temperament as defined by RTT. Our findings appear to be compatible with the negative correlation reported by other researchers between AQ and Extraversion, and positive correlation between AQ and Neuroticism [19,21].
Analysis of regression yielded differences in the models explaining AQ score variance among males and females. In males, the following variables were the strongest predictors: Emo-tional Reactivity (FCB-TI, positive correlation), Sociability (EAS, negative correlation), Brisk-ness (FCB-TI, negative correlation) and Perseveration (FCB-TI, positive correlation). These temperamental characteristics explained approximately 35% of variance in AQ scores. In fe-males, there were five predictors: Activity (FCB-TI, negative correlation), Distress (EAS, posi-tive correlation), Sociability (EAS, negaposi-tive correlation), Sensory Sensitivity (FCB-TI, negaposi-tive correlation) and Perseveration (FCB-TI, positive correlation). This model explained a smaller proportion of score variance with respect to autistic traits (22%) than the one devised for males.
The relationship between AQ and Emotional Reactivity seems logical. According to RTT, highly reactive individuals respond strongly to experienced stimuli and are less active due to the fact that their physiological mechanism amplifies stimulation. They are characterized by emotional hyperreactivity, behavioural rigidity, social withdrawal and avoidance of difficult sit-uations. This description is commensurate with the functioning of individuals with ASD [1,48,
49], and its association with autistic traits appears clear.
The relationship between AQ and Perseveration is also quite obvious. People characterized by higher perseveration in turn demonstrate high emotional sensitivity, decreased endurance, and often experience emotional distress [34]. This is also the case in individuals with ASD [50,
51,52]. In addition, the propensity for Perseveration may be associated with the presence of stereotyped, repetitive and rigid patterns of behaviour, which is also typical for individuals with ASD [49,53]. It is worth mentioning empirical data suggesting that total AQ score is positively correlated with proneness to obsessive personality [20].
The correlations between the RTT temperament dimensions and traits other than AQ shed an interesting light on the relationships described above. High Emotional Reactivity was dem-onstrated to be negatively correlated with social competence [35]. As previously mentioned, high reactivity complicates the ability to cope with stimulation and is associated with a tenden-cy to avoid high-stimulation situations, social stimulation included. Restricted social experi-ence impoverishes social training and consequently inhibits the development of social competence [35]. High Perseveration and low Endurance also make it difficult for individuals to deal with incoming stimulation. Temperamental traits that facilitate the development of
Temperament and Autistic Traits
social competences are primarily Activity and Briskness. They make individuals vivid, flexible in their behaviour, sociable and expansive [34]. Both these dimensions in our study were nega-tively correlated with autistic traits, providing evidence in support of the above reasoning. Thus, high Emotional Reactivity and Perseveration combined with low Briskness and Endur-ance are associated with low stimulation processing capacity [34]. The direction of correlation found between AQ and these temperamental dimensions in the present study may suggest that higher levels of autistic traits are also associated with limited capacity for stimulation process-ing. This conclusion is consistent with other research findings, including studies investigating sensory stimulation processing [54,55]. Horder and colleagues [56] found that AQ correlated positively with all three scales used in their study to measure abnormal sensory responsivity.
Furthermore, Zawadzki and Strelau [34] report that Emotional Reactivity and Perseveration have a strong positive correlation with neuroticism. As mentioned above, higher neuroticism was found in the students who showed higher AQ scores [21]. Studies on mothers of children with autism indicate that they are characterized by higher neuroticism than controls [14]. This is therefore an interesting avenue of research that could reveal associations between emotional reactivity, perseveration, neuroticism and autistic traits. At present, it would be difficult to identify the mechanisms underlying the emergence of the above correlations. Nevertheless, in the future it will be worthwhile to investigate the factors determining those traits and their mu-tual relationships in greater detail.
The relationship of AQ with Sociability appears obvious. According to Buss and Plomin [33], Sociability is the tendency to prefer the presence of others to being alone, and to seek company. It is manifested by a strong motivation to engage in social interactions. Thus it is by definition practically the exact opposite of AQ. Seeking the company of others, which is an as-pect of Sociability, is also one of the elements of extraversion [57]. Therefore we can reasonably interpret the presence and direction of the correlation between AQ and Sociability established in the present study in a similar manner as the correlation between AQ and Extraversion dem-onstrated by other researchers [19,21].
Both Distress (from EAS-TS) and Emotional Reactivity (described in RTT) involve re-sponding with anxiety to a stimulus. Since Buss and Plomin [33] found a relationship between Distress and neuroticism, the results of our study may be interpreted in the context of earlier research by Austin [19] and Wakabayashi and colleagues [21], in which AQ was shown to be positively correlated with neuroticism.
The fact that total AQ score did not correlate with Activity measured by EAS-TS in spite of correlating with Activity from FCB-TI needs further comment. The source of this apparent in-consistency may be in the different approaches to activity in the two instruments. In RTT, Ac-tivity is defined as the predisposition to engage in activities of high stimulative value or to prefer behaviours that provide strong stimulation from the environment. This includes social situations with high stimulative value. Moreover, the“Activity”subscale in FCB-TI includes items directly related to sociability (e.g.“My social live is very active”,“I try to make a lot of new friends”). In the theory proposed by Buss and Plomin [33], Activity rather refers to the characteristic of physical effort, and is defined as the frequency, duration and intensity of motor activities, and the tendency to choose high-energy activities over low-energy activities. The fact that Activity in RTT is defined to some extent in the context of social activity eluci-dates the role of this dimension of temperament as the strongest predictor of AQ in women.
cut-off calculated for the Polish version of AQ [42], according to information from the participants, none of them had received a diagnosis of ASD. In the case of FCB-TI, differences in the magni-tude of temperamental characteristics in the high AQ scorers group and in the normalization groups were present in all dimensions of temperament except for Sensory Sensitivity. Com-pared to the normalization groups, high AQ scorers demonstrated lower Briskness, Activity and Endurance, and higher Emotional Reactivity and Perseveration. As for EAS-TS, differences were present in the case of Distress and Anger (higher in the AQ scorers group) and Sociability (lower in the high AQ group). On the basis of those regularities, we can trace the temperamen-tal functioning of people with high AQ as individuals characterized by emotional lability who, when responding to stimuli with distress, withdrawal and anger, have a tendency to repeat ac-tivities (behaviours), and demonstrate limited activity and briskness.
In the present study we also checked whether autistic traits and the dimensions of tempera-ment analysed were unrelated. PCA yielded three factors. Only one factor (Factor II) included autistic traits along with Sociability from EAS-TS and Activity from FCB-TI, and therefore this became the main subject of our attention. This finding is easily interpreted. The scales belong-ing to that factor include similar questions relatbelong-ing to involvement in social interactions (as dis-cussed above). Taking into account the sign of the loading, it is clear that AQ scores are the obverse of the scores in the Sociability and Activity subscales. It should be noted that AQ was unrelated to the other temperamental variables.
Limitations and conclusion
The study had certain limitations, including the characteristics of the study sample, which in-cluded exclusively university students (narrow age range: 18–41 years) and was not randomly selected. Furthermore, only self-report measures were used, and participants' declarations of the lack of ASD diagnosis were not verified. In addition, as rightly noted by Wakabayashi and colleagues [21], there is no guarantee that data from studies on autistic traits in the general population are relevant to those traits in individuals with ASD. The debate on the relationship between autistic traits in the general population and in individuals with ASD remains unre-solved [58,59]. Further research on the relationships between temperament and AQ will cer-tainly benefit from information collected in longitudinal studies that could elucidate these correlations in the context of development. It would also be interesting to investigate the effects of temperament and environmental factors (associated with experiences from social interac-tions, including early relations with parents) in the context of the presence of autistic traits. De-spite these limitations and the need for further research, we believe that the results presented in this paper shed new light on the associations between autistic traits and other spheres of human functioning.
Generally, our findings confirm the need to analyse the correlations between autistic traits and temperament, although they leave open some questions requiring further investigation. These questions are fundamental and relate to the status of autistic traits, whether they can be treated as autistic personality traits, and how they are related to temperamental and personality characteristics other than those analysed herein.
Supporting Information
S1 Dataset. Data set used in this study.The first raw includes the variable names.
EAS-Emo-tionality-Activity-Sciability temperament scale. FCB-Formal Characteristics of Behavior—
Temperament inventory. (CSV)
Temperament and Autistic Traits
Acknowledgments
The authors thank Katarzyna Prejs, Marta Kuligowska and Anna Kościan for their assistance in data collection and Katarzyna Trędota for her help in database preparation.
Author Contributions
Conceived and designed the experiments: EP. Performed the experiments: EP RK DD WP. An-alyzed the data: EP WP. Contributed reagents/materials/analysis tools: EP DD. Wrote the paper: EP RK WP.
References
1. APA. The Diagnostic and Statistical Manual of Mental Disorders: DSM 5. 2013.
2. Currenti SA. Understanding and determining the etiology of autism. Cell Mol Neurobiol. 2010; 30 (2):161–71. doi:10.1007/s10571-009-9453-8PMID:19774457
3. Dodds L, Fell DB, Shea S, Armson BA, Allen AC, Bryson S. The role of prenatal, obstetric and neonatal factors in the development of autism. J Autism Dev Disord. 2011; 41(7):891–902. doi: 10.1007/s10803-010-1114-8PMID:20922473
4. Bolton P, Macdonald H, Pickles A, Rios P, Goode S, Crowson M, et al. A Case-Control Family History Study of Autism. J Child Psychol Psychiatry. 1994; 35(5):877–900. PMID:7962246
5. Bishop DVM, Maybery M, Wong D, Maley A, Hallmayer J. Characteristics of the broader phenotype in autism: a study of siblings using the children’s communication checklist-2. Am J Med Genet B Neurop-sychiatr Genet. 2006; 141B(2):117–22. PMID:16389586
6. Constantino JN, Lajonchere C, Lutz M, Gray T, Abbacchi A, McKenna K, et al. Autistic social im-pairment in the siblings of children with pervasive developmental disorders. Am J Psychiatry. 2006; 163 (2):294–6. PMID:16449484
7. Folstein SE, Bisson E, Santangelo SL, Piven J. Finding specific genes that cause autism: a combina-tion of approaches will be needed to maximize power. J Autism Dev Disord. 1998; 28:439–45. PMID: 9813779
8. Levy SE, Mandell DS, Schultz RT. Autism. Lancet. 2009; 374(9701):1627–38. doi: 10.1016/S0140-6736(09)61376-3PMID:19819542
9. Bölte S, Knecht S, Poustka F. A case-control study of personality style and psychopathology in parents of subjects with autism. J Autism Dev Disord. 2007 Feb; 37(2):243–50. PMID:16897383
10. Losh M, Childress D, Lam K, Piven J. Defining key features of the broad autism phenotype: a compari-son across parents of multiple- and single-incidence autism families. Am J Med Genet B Neuropsy-chiatr Genet. 2008; 147B(4):424–33. PMID:17948871
11. Murphy M, Bolton PF, Pickles A, Fombonne E, Piven J, Rutter M. Personality traits of the relatives of autistic probands. Psychol Med. 2000; 30(6):1411–24. PMID:11097081
12. Piven J, Chase GA, Landa R, Wzorek M, Gayle J, Cloud D, et al. Psychiatric disorders in the parents of autistic individuals. J Am Acad Child Adolesc Psychiatry. 1991; 30(3):471–8. PMID:1829081
13. Piven J, Palmer P, Landa R, Santangelo S, Jacobi D, Childress D. Personality and language character-istics in parents from multiple-incidence autism families. Am J Med Genet. 1997 Jul 25; 74(4):398–411. PMID:9259376
14. Dor-Shav NK, Horowitz Z. Intelligence and personality variables of parents of autistic children. J Genet Psychol. 1984; 144(1st Half):39–50. PMID:6726195
15. Piven J, Wzorek M, Landa R, Lainhart J, Bolton P, Chase GA, et al. Personality characteristics of the parents of autistic individuals. Psychol Med. 1994 Jul 9; 24(03):783–95.
16. Constantino JN, Todd RD. Intergenerational transmission of subthreshold autistic traits in the general population. Biol Psychiatry. 2005; 57(6):655–60. PMID:15780853
17. Hoekstra RA, Bartels M, Verweij CJH, Boomsma DI. Heritability of autistic traits in the general popula-tion. Arch Pediatr Adolesc Med. 2007; 161(4):372–7. PMID:17404134
18. Baron-Cohen S, Wheelwright S. The autism-spectrum quotient (AQ): Evidence from asperger syn-drome/high-functioning autism, malesand females, scientists and mathematicians. J autism. . .. 2001; 31:5–17.
20. Kunihira Y, Senju A, Dairoku H, Wakabayashi A, Hasegawa T.“Autistic”traits in non-autistic Japanese populations: relationships with personality traits and cognitive ability. J Autism Dev Disord. 2006; 36 (4):553–66. PMID:16602034
21. Wakabayashi A, Baron-Cohen S, Wheelwright S. Are autistic traits an independent personality dimen-sion? A study of the Autism-Spectrum Quotient (AQ) and the NEO-PI-R. Pers Individ Dif. 2006; 41 (5):873–83.
22. Costa PT, McCrae RR. Neo-PI-R professional manual: revised neo personality and neo five-factor in-ventory. Odessa, FL: Psychological Assessment Resources; 1992.
23. Plomin R. Genetics and Children’s Experiences in the Family. J Child Psychol Psychiatry. 1995; 36 (1):33–68. PMID:7714029
24. Rutter M. Temperament, personality and personality disorder. Br J Psychiatry. 1987; 150(4):443–58. 25. Strelau J. Temperament personality activity. London, UK: Academic Press; 1983.
26. Seifer R, Schiller M, Sameroff AJ, Resnick S, Riordan K. Attachment, maternal sensitivity, and infant temperament during the first year of life. Dev Psychol. 1996; 32(1):12–25.
27. Umemura T, Jacobvitz DB. Nonmaternal care hours and temperament predict infants’ proximity-seek-ing behavior and attachment subgroups. Infant Behav Dev. 2014; 37(3):352–65. doi:10.1016/j.infbeh. 2014.05.007PMID:24905902
28. Klusek J, Losh M, Martin GE. Sex differences and within-family associations in the broad autism pheno-type. Autism. 2014; 18(2):106–16. doi:10.1177/1362361312464529PMID:23188882
29. Sasson NJ, Nowlin RB, Pinkham AE. Social cognition, social skill, and the broad autism phenotype. Au-tism. 2013; 17(6):655–67. doi:10.1177/1362361312455704PMID:22987889
30. Cloninger CR. The Temperament and Character Inventory (TCI): A guide to its development and use. St. Louis: Washington University Center for Psychobiology of Personality; 1994.
31. Strelau J. Temperament: A psychological perspective. Washington, DC: Plenum; 1998. 32. Buss AH, Plomin R. A temperament theory of personality development. New York: Wiley; 1975. 33. Buss AH, Plomin R. Temperament: Early developing personality traits. Hillsdale, New Jersey:
Law-rence Erlbaum Associates, Inc.; 1984.
34. Zawadzki B, Strelau J. Formalna Charakterystyka Zachowania—Kwestionariusz Temperamentu (FCZ
—KT). Podręcznik [Formal Characteristics of Behavior—Temperament Inventory. Manual]. Warsaw: Pracownia Testów Psychologicznych PTP; 1997.
35. Matczak A. Kwestionariusz Kompetencji Społecznych. Podręcznik [Questionnaire of Social Compe-tence. Manual]. Warsaw: Pracownia Testów Psychologicznych PTP; 2001.
36. Jaworowska A, Matczak A. Kwestionariusz inteligencji emocjonalnej [Emotional Intelligence Question-naire]. Warsaw: Pracownia Testów Psychologicznych PTP; 2001.
37. Żmijewska A, Pisula E. Cechy temperamentalne a autystyczna charakterystyka zachowania [Tempera-mental traits and characteristics of autistic behavior]. Psychologia-Etologia-Genetyka. 2009; 20:51–61. 38. Worobey J. Associations between temperament and love attitudes in a college sample. Pers Individ
Dif. 2001; 31(3):461–9.
39. Brunyé TT, Ditman T, Giles GE, Mahoney CR, Kessler K, Taylor HA. Gender and autistic personality traits predict perspective-taking ability in typical adults. Pers Individ Dif. 2012 Jan; 52(1):84–8. 40. Hoekstra RA, Bartels M, Cath DC, Boomsma DI. Factor structure, reliability and criterion validity of the
Autism-Spectrum Quotient (AQ): a study in Dutch population and patient groups. J Autism Dev Disord. 2008; 38(8):1555–66. doi:10.1007/s10803-008-0538-xPMID:18302013
41. Ingersoll B, Hopwood CJ, Wainer A, Brent Donnellan M. A comparison of three self-report measures of the broader autism phenotype in a non-clinical sample. J Autism Dev Disord. 2011; 41(12):1646–57. doi:10.1007/s10803-011-1192-2PMID:21331821
42. Pisula E, Kawa R, SzostakiewiczŁ,Łucka I, Kawa M, Rynkiewicz A. Autistic traits in male and female students and individuals with high functioning autism spectrum disorders measured by the Polish ver-sion of the Autism-Spectrum Quotient. PLoS One. 2013; 8(9):e75236. doi:10.1371/journal.pone. 0075236PMID:24086474
43. Hurst RM, Mitchell JT, Kimbrel NA, Kwapil TK, Nelson-Gray RO. Examination of the reliability and factor structure of the Autism Spectrum Quotient (AQ) in a non-clinical sample. Pers Individ Dif. 2007; 43 (7):1938–49.
44. Kloosterman PH, Keefer K V, Kelley EA, Summerfeldt LJ, Parker JDA. Evaluation of the factor structure of the Autism-Spectrum Quotient. Pers Individ Dif. 2011; 50(2):310–4.
45. Stewart ME, Austin EJ. The structure of the Autism-Spectrum Quotient (AQ): Evidence from a student sample in Scotland. Pers Individ Dif. 2009; 47(3):224–8.
Temperament and Autistic Traits
46. Oniszczenko W. Kwestionariusz Temperamentu EAS A. H. Bussa i R. Plomina. Wersje dla dorosłych i dla dzieci. Adaptacja polska [EAS Temperament Questionnaire AH Buss and R Plomin. Versions for both adults and children. Polish adaptation]. Warsaw: Pracownia Testów Psychologicznych PTP; 1997.
47. Baron-Cohen S, Cassidy S, Auyeung B, Allison C, Achoukhi M, Robertson S, et al. Attenuation of Typi-cal Sex Differences in 800 Adults with Autism vs. 3,900 Controls. PLoS One. 2014; 9(7):e102251. doi: 10.1371/journal.pone.0102251PMID:25029203
48. Davis TE, Fodstad JC, Jenkins WS, Hess JA, Moree BN, Dempsey T, et al. Anxiety and avoidance in infants and toddlers with autism spectrum disorders: Evidence for differing symptom severity and pre-sentation. Res Autism Spectr Disord. 2010 Apr; 4(2):305–13.
49. Gabriels RL, Cuccaro ML, Hill DE, Ivers BJ, Goldson E. Repetitive behaviors in autism: relationships with associated clinical features. Res Dev Disabil. 2005; 26(2):169–81. PMID:15590247
50. Nuske HJ, Vivanti G, Dissanayake C. Are emotion impairments unique to, universal, or specific in au-tism spectrum disorder? A comprehensive review. Cogn Emot. 2013; 27(6):1042–61. doi:10.1080/ 02699931.2012.762900PMID:23387530
51. Samson AC, Huber O, Gross JJ. Emotion regulation in Asperger’s syndrome and high-functioning au-tism. Emotion. 2012; 12(4):659–65. doi:10.1037/a0027975PMID:22642342
52. Samson AC, Phillips JM, Parker KJ, Shah S, Gross JJ, Hardan AY. Emotion dysregulation and the core features of autism spectrum disorder. J Autism Dev Disord. 2014; 44(7):1766–72. doi:10.1007/ s10803-013-2022-5PMID:24362795
53. Lam KSL, Bodfish JW, Piven J. Evidence for three subtypes of repetitive behavior in autism that differ in familiality and association with other symptoms. J Child Psychol Psychiatry. 2008; 49(11):1193–200. doi:10.1111/j.1469-7610.2008.01944.xPMID:19017031
54. Crane L, Goddard L, Pring L. Sensory processing in adults with autism spectrum disorders. Autism. 2009 May; 13(3):215–28. doi:10.1177/1362361309103794PMID:19369385
55. Tavassoli T, Miller LJ, Schoen SA, Nielsen DM, Baron-Cohen S. Sensory over-responsivity in adults with autism spectrum conditions. Autism. 2014 May; 18(4):428–32. doi:10.1177/1362361313477246 PMID:24085741
56. Horder J, Wilson CE, Mendez MA, Murphy DG. Autistic traits and abnormal sensory experiences in adults. J Autism Dev Disord. 2014; 44(6):1461–9. doi:10.1007/s10803-013-2012-7PMID:24305777 57. Eaves L, Eysenck H. The nature of extraversion: A genetical analysis. J Pers Soc Psychol. 1975; 32
(1):102–12. PMID:1239499
58. Frazier TW, Youngstrom EA, Sinclair L, Kubu CS, Law P, Rezai A, et al. Autism spectrum disorders as a qualitatively distinct category from typical behavior in a large, clinically ascertained sample. Assess-ment. 2010; 17:308–20. doi:10.1177/1073191109356534PMID:20040725