647
FATTY ACID COMPOSITION OF LEAVES OF FORCED
CHICORY (
CICHORIUM INTYBUS
L.)
Lovro Sinkovič
1, Janez Hribar
1, Rajko Vidrih
1, Žarko M. Ilin
2and Dragan Žnidarčič
3,*
1Department of Food Science and Technology, Biotechnical Faculty, University of Ljubljana,
Jamnikarjeva 101, 1000 Ljubljana, Slovenia
2 Department for Field and Vegetable Crops, Faculty of Agriculture, University of Novi Sad,
Trg Dositeja Obradovića 8, 21000 Novi Sad, Serbia
3Department of Agronomy, Biotechnical Faculty, University of Ljubljana,
Jamnikarjeva 101, 1000 Ljubljana, Slovenia
*Corresponding author: [email protected]
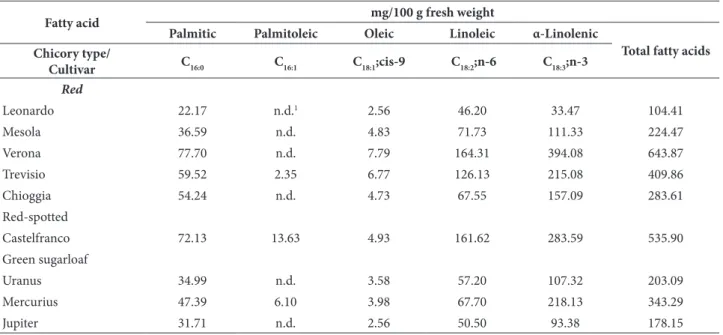
Abstract:The objective of the present study was to determine the composition of fatty acids in leaves of nine chicory cultivars (Cichorium intybus L.). The growing practice followed the traditional forcing method of devel-oped roots in a peat to obtain new etiolated vegetative apical buds, known as chicons. The fatty acid content was determined by the extraction of fatty acid methyl esters and analysis by means of gas chromatography. The analysis revealed the following ratios of C16:0, C18:0, C18:1, C18:2 and C18:3 of individual fatty acids. The total fatty acid content in forced chicory leaves ranged from 104 to 644 mg/100 g fresh weight. The highest rela-tive content (64%) is presented by α-linolenic acid, followed by linoleic (44%) and palmitic (21%). An n-6/n-3 polyunsaturated fatty acids ratio of studied forced chicory is below 1.4 and thus, in accordance with the recom-mended dietary ratio that is close to 1.
Key words: Forced chicory; Cichorium intybus; gas chromatography; fatty acid methyl esters; MUFA and PUFA
Received November 5, 3014; Accepted November 29, 2014
INTRODUCTION
A plant cell contains about 5-10% of total lip-ids by dry weight and most of them are found in the membranes. The major fatty acids pres-ent in plants have a carbon chain length of 16 or 18, varying in the number of cis-doublebounds from 0 to 3 (Ohlrogge and Browse, 1995; Kreb-sky et al., 1996). Plant lipids consist of five fatty
dis-eases and cancer (Staerfl et al., 2011). Two types of PUFAs, n-3 and n-6 fatty acids in foods, have received increasing attention due to reported health benefits for humans (Peterson et al., 2011). Regular consumption of n-3 essential fatty acids is a dietary recommendation to prevent potential diseases, but even more important is the n-6/n-3 ratio currently recommended at less than ten (Vidrih et al., 2009).
In recent years, leafy vegetables belonging to Cichorium intybus L. have become widely used in Mediterranean countries as raw salads (Žnidarčič et al., 2011), especially in the winter time when fresh vegetables are limited on the market (Carazzone et al., 2013). α-linolenic acid (C18:3, n-3) is the precursor of long chain n-3 PUFAs, such as eicosapentaenoic and docosa-hexaenoic acids and it is known to be present in many plants, including chicory (Lavelli et al., 2009). An important sustainable economic pro-duction of chicory is the forcing of its developed roots in darkness where, in the absence of
pho-tosynthesis, new leaves growth relies on carbon reserves (Casan et al., 2008).
To the best of our knowledge, no investiga-tions have been undertaken to determine the fatty acid composition in different cultivars (red, red-spotted and green sugarloaf) of forced chicory. The objective of the present work was to analyze the fatty acid composition of chicory leaves from several cultivars obtained according to the traditional forcing method in a peat from pre-developed chicory roots. The gas chromatog-raphy method with prior fatty acid methyl esters preparation was used for analysis.
MATERIALS AND METHODS
Plant material
Nine commercial cultivars of chicory ( Cichori-um intybus L.) were studied: five red (‘Leonardo’,
Table 1. Fatty acid composition of leaf samples at the end of the forced phase in peat.
Fatty acid mg/100 g fresh weight
Palmitic Palmitoleic Oleic Linoleic α-Linolenic
Total fatty acids Chicory type/
Cultivar C16:0 C16:1 C18:1;cis-9 C18:2;n-6 C18:3;n-3
Red
Leonardo 22.17 n.d.1 2.56 46.20 33.47 104.41
Mesola 36.59 n.d. 4.83 71.73 111.33 224.47
Verona 77.70 n.d. 7.79 164.31 394.08 643.87
Trevisio 59.52 2.35 6.77 126.13 215.08 409.86
Chioggia 54.24 n.d. 4.73 67.55 157.09 283.61
Red-spotted
Castelfranco 72.13 13.63 4.93 161.62 283.59 535.90
Green sugarloaf
Uranus 34.99 n.d. 3.58 57.20 107.32 203.09
Mercurius 47.39 6.10 3.98 67.70 218.13 343.29
Jupiter 31.71 n.d. 2.56 50.50 93.38 178.15
‘Treviso’, ‘Mesola’, ‘Verona’ and ‘Chioggia’), one red-spotted (‘Castelfranco’) and three green sugarloaf types (‘Jupiter’, ‘Uranus’ and ‘Mercu-rius’). The chicory roots were cultivated in the Posavje region (Slovenia) in a moderate soil, with their planting following alfalfa (Medicago sativa). Before plowing, 500 kg ha-1 Multicomb
(13-11-20+microelements) was used. The chicory seedlings were transplanted to the open field at the beginning of August 2012. Additional nutri-tion was supplied by 400 kg ha-1 Multi K
(12-0-42+2% MgO) and Multi Cal (15.5-0-0+19% Ca) at a ratio of 3:5. Plants were dug up by hand-fork on 16 November 2012. After harvest, the under-cut roots were left to wilt on the field for 5 days according to the traditional method. Before the clean roots were placed for forcing, the leaves were cut to about 2 cm above the root crown. The roots were trimmed to a similar length of approxi-mately 15 cm. The roots were placed in an upright position in a few centimeters of peat in forcing boxes. The boxes were placed on rolling benches in a heated dark glasshouse compartment of the Biotechnical Faculty, Ljubljana. Air temperature
was maintained at 10oC during the first forcing
period (20 days) and was gradually increased to 15oC during the second period (10 days). After 30
days, the forced leaves were harvested.
Determination of fatty acids
For the experimental analysis, leaves of three ran-domly chosen plants of each cultivar were used. The leaves were combined in plastic bags and frozen at -20°C until analysis. Fatty acid compo-sition was determined using gas chromatogra-phy of fatty acid methyl esters (FAMes). FAMes were prepared from the unfrozen leaf samples ac-cording to literature (Park and Goins, 1994). In a Hach test tube with a screw cap 100 μL of inter-nal standard solution (heptadecanoic acid, C17:0, Sigma H 3500, lot 097K1029) and approximately 0.1-0.4 g chopped unfrozen leaves of each chico-ry cultivar were weighed. To the same vial 300 μL of methylene chloride and 3 mL 0.5 M of freshly prepared sodium hydroxide in methanol were added. The test tubes were mixed and heated in a water bath for 60 min at 90ºC with occasional
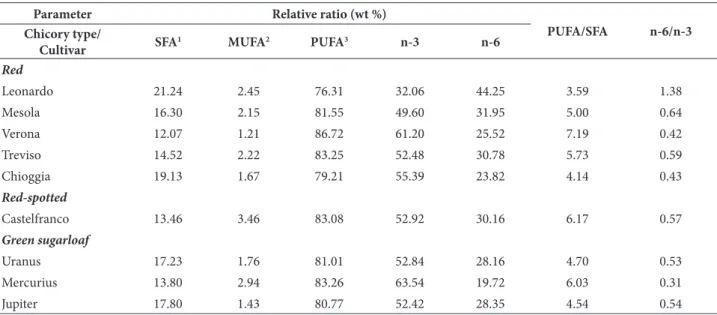
Table 2. Nutritional information regarding forced chicory cultivars derived from raw fatty acids data.
Parameter Relative ratio (wt %)
PUFA/SFA n-6/n-3 Chicory type/
Cultivar SFA
1 MUFA2 PUFA3 n-3 n-6
Red
Leonardo 21.24 2.45 76.31 32.06 44.25 3.59 1.38
Mesola 16.30 2.15 81.55 49.60 31.95 5.00 0.64
Verona 12.07 1.21 86.72 61.20 25.52 7.19 0.42
Treviso 14.52 2.22 83.25 52.48 30.78 5.73 0.59
Chioggia 19.13 1.67 79.21 55.39 23.82 4.14 0.43
Red-spotted
Castelfranco 13.46 3.46 83.08 52.92 30.16 6.17 0.57
Green sugarloaf
Uranus 17.23 1.76 81.01 52.84 28.16 4.70 0.53
Mercurius 13.80 2.94 83.26 63.54 19.72 6.03 0.31
Jupiter 17.80 1.43 80.77 52.42 28.35 4.54 0.54
mixing. The reaction mixture was quickly cooled and 3 mL of 14% boron trifluoride in methanol were added and the test tubes were heated again for another 10 min at the same temperature. The reaction mixture was cooled and 3 mL of 10% so-dium chloride solution and 1.0 mL hexane were added. The reaction mixture was mixed vigor-ously by Vortexer for 1 min and centrifuged at 4 000 xgfor 10 min. The hexane phase with dis-solved methyl esters of fatty acids was transferred to a dark vial and frozen at -20°C until analyzed by gas chromatography.
The solution of FAMes was quantified on an Agilent 6890N gas chromatograph with flame ionization detector, equipped with an Agilent 7683 series autosampler (Agilent Technologies Inc., Wilmington, De, USA). Separation was carried out on column SPB PUFA; 30 m×0.25 mm×0.2 μm column (SUPeLCO). The follow-ing conditions were used to separate and detect the FAMes: column temperature 210°C, injec-tor temperature 250°C, detecinjec-tor temperature 260°C, injection volume 1 μL, helium was used as the carrier gas at a flow rate of 1 mL min-1.
The resultant data was processed by computer using GC Chem Station software. Identification of fatty acids was carried out using a reference standard mixture of methyl esters of higher fatty acids (Lipid standard Sigma 189-19).GC analysis of chicory samples detected the following fatty acids: C 16:0, C 16:1, C 18:1, C 18:2 and C 18:3. The amounts of each of fatty acid were calculat-ed from the areas of the internal standard (hep-tadecanoic acid, C 17:0).
Data analysis
Correlations among five fatty acids (%) and the total fatty acid content (mg/100 g FW) in nine chicory cultivars were calculated by PROC CORR procedure in SAS ver. 9.1. The principal
component analysis (PCA) based on five fatty ac-ids (%) and the total fatty acid content (mg/100 g FW) in nine chicory cultivars was performed using PROC PRINCOMP in SAS. The biplot was constructed by two principal components show-ing cultivars and analyzed variables (as vectors).
RESULTS AND DISCUSION
The calculated nutritional information as relative ratio (wt %) of studied chicory cultivars are reported in Table 2. The major fatty acid present in lipids of chicory plants was omega-3 α-linolenic (C 18:3), ranging from 32 to 64%, followed by omega-6 linoleic (C 18:2; 20-44%) and palmitic (C 16:0; 12-21%), which is the only saturated fatty acid (SFA). Palmitoleic (C 16:1) and oleic (C 18:1) fatty acids are less present in analyses samples and together represent a minor group of monounsaturated fatty acids (MUFA; 1-4%). α-linolenic and linoleic acid represent the group of polyunsaturated fatty acids (PUFA), ranging from 76 to 87%. The PUFA/SFA ratio ranged from 4 to 7, while the n-6/n-3 ratio of the analyzed chicory cultivars
was below 1, except for cv. ‘Leonardo’ (1.38). Previous investigations done on wild species of
Cichorium intybus reported slightly lower values found for n-6/n-3 ratio (Vardavas et al., 2006; Morales et al., 2012). The balance of n-6 and n-3 fatty acids is important for homeostasis, normal development, decreasing the risk for coronary heart disease, gene expression and is a determi-nant of health; therefore the appropriate recom-mended n-6/n-3 ratio is close to 1 (Simopoulos, 2002, 2008). The dietary recommendations for human health to increase the consumption of fish or n-3 rich vegetables remain (Russo, 2009), and chicory, with a good balance of n-6 and n-3 fatty acids, proved to be a beneficial vegetable in this respect.
Table 3. Pearson’s correlation coefficients among five fatty acids (%) and total fatty acid content in nine forced chicory cultivars.
No. Variable Variable
1 2 3 4 5 6
1 Palmitic acid (%) ns * ns * **
2 Palmitoleic acid (%) -0.531 * ns ns ns
3 Oleic acid (%) 0.767 -0.668 * * *
4 Linoleic acid (%) 0.559 -0.258 0.714 *** ns
5 α-Linolenic acid (%) -0.748 0.305 -0.787 -0.965 ns
6 Total fatty acids (mg/100 g FW) -0.875 0.456 -0.744 -0.428 0.613
The significance of the correlations is indicated as follows: ***, significance at the 0.1% nominal level; **, significance at the 1% nominal level; *, significance at the 5% nominal level; ns, not significant.
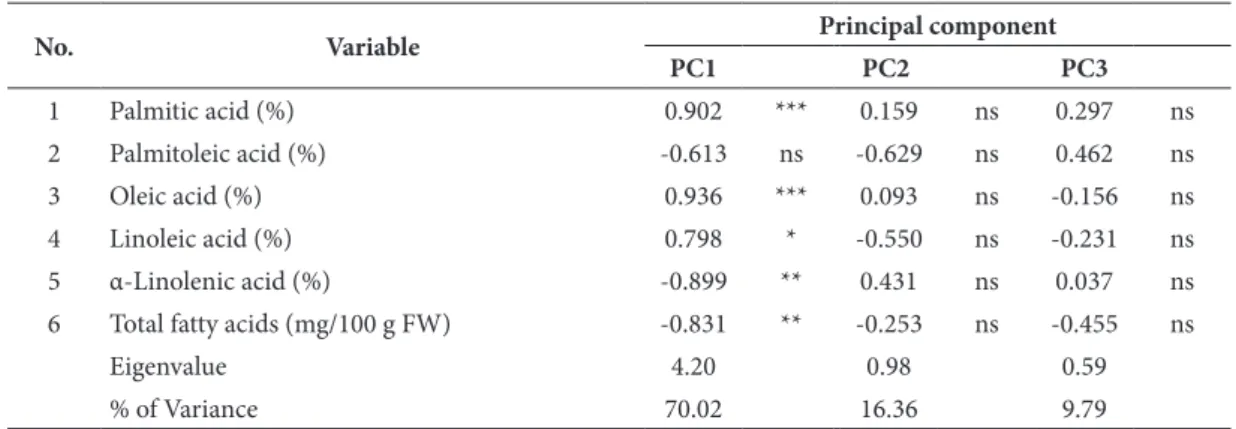
Table 4. Component loadings of the five fatty acids (%) and total fatty acid content on the first three principal components.
No. Variable Principal component
PC1 PC2 PC3
1 Palmitic acid (%) 0.902 *** 0.159 ns 0.297 ns
2 Palmitoleic acid (%) -0.613 ns -0.629 ns 0.462 ns
3 Oleic acid (%) 0.936 *** 0.093 ns -0.156 ns
4 Linoleic acid (%) 0.798 * -0.550 ns -0.231 ns
5 α-Linolenic acid (%) -0.899 ** 0.431 ns 0.037 ns
6 Total fatty acids (mg/100 g FW) -0.831 ** -0.253 ns -0.455 ns
eigenvalue 4.20 0.98 0.59
% of Variance 70.02 16.36 9.79
As presented in Table 3, out of 15 pairwise cor-relations between five fatty acids (%) and the total fatty acid content (mg/100 g FW) in nine forced chicory cultivars, eight were proven significant at
P<0.05, out of which seven could be considered as strong (r>0.70 or r<-0.70). The strong positive correlations (r>0.70; P<0.05) were observed be-tween oleic acid and both palmitic (r=0.767) and linoleic acid (r=0.714). The strong negative corre-lations (r<-0.79; P<0.05) were observed between palmitic acid and both α-linolenic acid (r=-0.748) and the total fatty acids (r=-0.875), between oleic acid and both α-linolenic acid (r=-0.787) and the total fatty acids (r=-0.744), and between linoleic and α-linolenic acid (r=-0.965).
The PCA based on five fatty acids (%) and total fatty acid content (mg/100 g FW) in nine forced chicory cultivars revealed that the first three principal components explained as much as 96.17% of the total variation (Table 4). All variables except palmitoleic acid were strong-ly (r>0.70 or r<-0.70) correlated with the first principal component that explained 70.02% of
the total variation. The strong positive correla-tions were observed between the first principal component and palmitic, oleic and linoleic acid, while strong negative correlations were observed between the first principal component and both α-linolenic acid and total fatty acid content. None of the variables showed correlation with either the second or the third principal components. The strongest correlation was found between the second principal component and palmitoleic acid (r=-0.629), although non-significant (P=0.07).
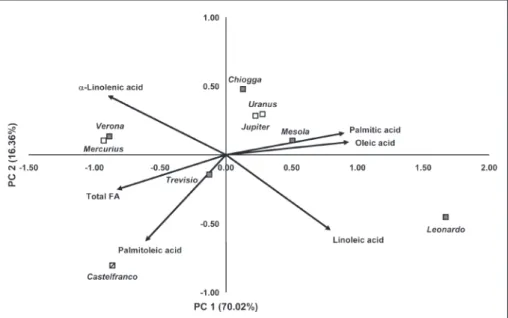
The biplot constructed by two principal com-ponents showing cultivars and the analyzed vari-ables (as vectors) is presented in Fig. 1. The first principal component axis separated the cultivars with higher percentages of palmitic, oleic and linoleic acid (‘Leonardo’ and ‘Mesola’) from the cultivars characterized by an above-average per-centage of α-linoleic acid and total fatty acid con-tent (‘Mercurius’, ‘Verona’ and ‘Castelfranco’). On the second principal component axis, the cultivar ‘Castelfranco’, characterized by an above-average percentage of palmitoleic acid, was separated
from the rest of the cultivars. Based on five fatty acids (%) and the total fatty acid content, the ana-lyzed cultivars belonging to the same type (sugar-loaf, red-spotted and red) did not tend to group together, e.g. the cultivars ‘Verona’ and ‘Mercu-rius’, although belonging to different chicory types grouped closely together, while ‘Verona’ and ‘Leonardo’, both red-headed, had clearly different fatty acid profiles and grouped on the opposite sides along the first principal component axis.
CONCLUSIONS
The present analysis demonstrated that the ma-jority of fats in forced chicory leaves consisted of unsaturated fatty acids, among which are main α-linolenic (C 18:3, n-3) and linoleic acid (C 18:2, n-6). Saturated fatty acids are represented mainly by palmitic acid (C 16:0). The forced chic-ory showed itself to be a good source of essential α-linoleic fatty acid with an appropriate n-6/n-3 ratio. Although the fatty acid content in vegetables is rather low, they have an important nutritional value due to their favorable fatty acid balance.
Acknowledgments:This study was a part of the Horti-culture Program No. P4-0013 and Integrated Food Tech-nology and Nutrition Program No. P4-0234. The authors greatly appreciate the financial support of the Slovenian Research Agency for Financial Support.
REFERENCES
Carazzone, C., Mascherpa, D., Gazzani, G. and A. Papetti (2013).
Identification of phenolic constituents in red chicory salads
(Cichorium intybus) by high-performance liquid
chromatog-raphy with diode array detection and electrospray ionisation tandem mass spectrometry. Food Chem. 138, 1062-1071.
Cassan, L., Corbineau, F. and A.M. Limami (2008). Genetic
vari-ability of nitrogen accumulation during vegetative devel-opment and remobilization during the forcing process in
witloof chicory tuberized root (Cichorium intybus L.). J.
Plant Physiol. 165, 1667-1677.
Clapham, W.M., Foster, J.G., Neel, J.P.S. and J.M. Fedders (2005).
Fatty acid composition of traditional and novel forages. J. Agric. Food Chem. 53, 10068-10073.
Garces, R. and M. Mancha (1993). One-step lipid extraction and
fatty acid methyl esters preparation from fresh plant tis-sues. Anal. Chem. 211, 139-143.
Krebsky, E.O., Geuns, J.M.C. and M.D. Proft (1996). Fatty acids in
polar lipids from etiolated Cichorium intybus.
Phytochem-istry 43, 747-751.
Lavelli, V., Pagliarini, E., Ambrosoli, R. and B. Zanoni (2009).
Quality of minimally processed red chicory (Cichorium
intybus L.) evaluated by anthocyanin content, radical
scav-enging activity, sensory descriptors and microbial indices.
Int. J. Food Sci. Technol. 44, 994-1001.
Morales, P., Ferreira, I.C., Carvalho, A.M., Sánchez-Mata, M.C.,
Cámara, M. and J. Tardío (2012). Fatty acids profiles of
some Spanish wild vegetables. Food Sci. Technol. Int. 18, 281-290.
Ohlrogge, J. and J. Browse (1995). Lipid biosynthesis. Plant Cell
7, 957-970.
Park, P.W. and R.E. Goins (1994). In situ preparation of fatty
acid methyl esters for analysis of fatty acid composition in foods. J. Food Sci. 59, 1262-1266.
Petersen, M.B., Søegaard, K. and S.K. Jensen (2011). Herb feeding
increases n-3 and n-6 fatty acids in cow milk. Livestock Sci. 141, 90-94.
Russo, G.L. (2009). Dietary n-6 and n-3 polyunsaturated fatty
acids: From biochemistry to clinical implications in car-diovascular prevention. Biochem. Pharmacol. 77, 937-946.
Simopoulos, A.P. (2002). The importance of the ratio of omega-6/
omega-3 essential fatty acids. Biomed. Pharmacother. 56, 365-379.
Simopoulos, A.P. (2008). The importance of the omega-6/omega-3
fatty acid ratio in cardiovascular disease and other chronic diseases. Exp. Biol. Med (Maywood). 233, 674-688.
Singh, S.P., Zhou, X.R., Liu. Q., Stymne. S. and A.G. Green (2005).
Metabolic engineering of new fatty acids in plants. Curr.
Opin. Plant Biol. 8, 197-203.
Staerfl, S.M., Soliva, C.R., Leiber, F. and M. Kreuzer 2011. Fatty
acid profile and oxidative stability of the perirenal fat of bulls fattened on grass silage and maize silage supple-mented with tannins, garlic, maca and lupines. Meat Sci. 89: 98-104.
Vardavas, C., Majchrzak, D., Wagner, K., Elmadfa, I. and A.
Kafa-tos (2006). Lipid concentrations of wild edible greens in Crete. Food Chem. 99, 822-834.
Vidrih, R., Filip, S. and J. Hribar. (2009). Czech J. Food Sci. 27,
125-129.
Žnidarčič, D., Ban, D. and H. Šircelj (2011). Carotenoid and
chlorophyll composition of commonly consumed leafy vegetables in Mediterranean countries. Food Chem. 129, 1164-1168.
Žnidarčič, D. and R. Vidrih (2009). Content of essential fatty acids