BGD
11, 12773–12797, 2014
Insight intoEmiliania huxleyi
coccospheres
R. Hoffmann et al.
Title Page
Abstract Introduction
Conclusions References
Tables Figures
◭ ◮
◭ ◮
Back Close
Full Screen / Esc
Printer-friendly Version
Interactive Discussion
Discussion
P
a
per
|
Discus
sion
P
a
per
|
Discussion
P
a
per
|
Discussion
P
a
per
|
Biogeosciences Discuss., 11, 12773–12797, 2014 www.biogeosciences-discuss.net/11/12773/2014/ doi:10.5194/bgd-11-12773-2014
© Author(s) 2014. CC Attribution 3.0 License.
This discussion paper is/has been under review for the journal Biogeosciences (BG). Please refer to the corresponding final paper in BG if available.
Insight into
Emiliania huxleyi
coccospheres by focused ion beam
sectioning
R. Hoffmann1,*, C. Kirchlechner2,*, G. Langer3,*, A. S. Wochnik4, E. Griesshaber1, W. W. Schmahl1, and C. Scheu2,4
1
Department of Earth and Environmental Sciences, LMU, 80333 Munich, Germany
2
Max Planck Institute for Iron Research GmbH, 40237 Düsseldorf, Germany
3
Department of Earth Sciences, University of Cambridge, Cambridge CB2 3EQ, UK
4
Department of Chemistry, LMU, 81377 Munich, Germany
*
These authors contributed equally to this work.
Received: 24 July 2014 – Accepted: 14 August 2014 – Published: 2 September 2014
Correspondence to: C. Scheu (scheu@mpie.de)
BGD
11, 12773–12797, 2014
Insight intoEmiliania huxleyi
coccospheres
R. Hoffmann et al.
Title Page
Abstract Introduction
Conclusions References
Tables Figures
◭ ◮
◭ ◮
Back Close
Full Screen / Esc
Printer-friendly Version
Interactive Discussion
Discussion
P
a
per
|
Discus
sion
P
a
per
|
Discussion
P
a
per
|
Discussion
P
a
per
|
Abstract
Coccospheres of a cultured Emiliania huxleyi clone were sampled in the exponential growth phase and sectioned using a focused ion beam microscope. An average of 69 sections and the corresponding secondary electron micrographs per coccosphere pro-vided detailed information on coccosphere architecture. The latter features, 2–3 layers
5
on average and 20 coccoliths per cell, of which only 15 can be seen in conventional scanning electron micrographs. The outer coccosphere diameter was positively corre-lated with the number of coccolith layers. By contrast, the inner coccosphere diameter (around 4.36 µm), and hence the cell diameter, was quasi-constant. Coccoliths were not evenly distributed across the coccosphere, resulting more often than not, in one
10
part of the coccosphere displaying more coccolith layers than the other.
The architectural data allowed us to calculate, with sufficient accuracy, the PIC/POC ratio and the density of individual cells. The lack of a significant correlation of the latter parameters has implications for the ongoing debate on the function of coccoliths.
1 Introduction 15
In the context of the current climate change debate, ecosystem response to environ-mental disturbances has become a matter of unprecedented urgency. In order to be able to predict how ecosystems in general and groups of organisms in particular will respond to ongoing changes such as global warming and ocean acidification, an under-standing of past climate change and the corresponding response of organisms is
piv-20
otal (Curey et al., 1951; Gibbs et al., 2013). The marine sedimentary archive potentially provides an enormous database of past organismal responses to climate change (Ger-hard and Wefer, 1999). Especially the calcium carbonate shells of the major pelagic calcifiers, coccolithophores and foraminifera, constitute an archive that extends for tens of millions of years (Bown and Pearson, 2009; Hamilton, 1953). Coccolithophores are
25
BGD
11, 12773–12797, 2014
Insight intoEmiliania huxleyi
coccospheres
R. Hoffmann et al.
Title Page
Abstract Introduction
Conclusions References
Tables Figures
◭ ◮
◭ ◮
Back Close
Full Screen / Esc
Printer-friendly Version
Interactive Discussion
Discussion
P
a
per
|
Discus
sion
P
a
per
|
Discussion
P
a
per
|
Discussion
P
a
per
|
coccoliths which consist primarily of a radial array of complexly shaped crystals of cal-cite (Young et al., 1992, 1999; Young and Henriksen, 2003). Both the chemical compo-sition of coccoliths and the morphology of the coccosphere as well as of the coccoliths were used to gain information about physiological parameters such as growth and cal-cification rate at different times in the geological past (Stoll and Schrag, 2000; Gibbs
5
et al., 2013). The morphological analysis of coccospheres and coccoliths relies on scanning electron microscopy (SEM), a tool which renders the accurate determination of size and morphological aberrations possible (Young and Ziveri, 2000; Langer et al., 2013a). Some features, however, cannot be disclosed by means of classical scanning electron microscopy. The number of coccoliths per cell for instance can only be
esti-10
mated on the basis of the coccoliths that can actually be seen (Langer et al., 2013a). Shedding light on features such as the latter and gaining further insight into cocco-sphere architecture requires step by step cross sectioning of complete coccococco-spheres.
A helpful tool to gain information on the interior architecture of samples is focused ion beam (FIB) sectioning combined with SEM imaging (Inkson et al., 2001; Williams
15
et al., 2005; Uchic et al., 2006; Holzapfel et al., 2007; Kato et al., 2007; Mc Grozther and Munroe, 2007). This combination enables bulk samples to be locally sectioned by ion milling and subsequently imaged at high resolution (De Winter et al., 2009). This application of FIB-SEM instruments is commonly referred to as FIB tomography (Inkson et al., 2001; Kubis et al., 2004). Using FIB-SEM tomography to investigate
20
insulators like biological, geological and ceramic samples, is challenging because of charging effects that disturb the sectioning as well as the imaging (De Winter et al., 2009). Nevertheless the FIB-SEM microscope is often used to analyse biological ma-terials, which are difficulty to cut like teeth (Nalla et al., 2005) and bones (Giannuzzi et al., 2007). Another application for FIB-SEM microscopes in biology is the
prepa-25
BGD
11, 12773–12797, 2014
Insight intoEmiliania huxleyi
coccospheres
R. Hoffmann et al.
Title Page
Abstract Introduction
Conclusions References
Tables Figures
◭ ◮
◭ ◮
Back Close
Full Screen / Esc
Printer-friendly Version
Interactive Discussion
Discussion
P
a
per
|
Discus
sion
P
a
per
|
Discussion
P
a
per
|
Discussion
P
a
per
|
formation allows to gain crystallographic information of the sample (De Winter et al., 2009).
In this study FIB-SEM sectioning and SE as well as BSE imaging was used to study the coccosphere’s internal architecture of the abundant coccolithophore species E. huxleyi. The so obtained information was used to calculate the particulate inorganic
5
carbon (PIC)/particulate organic carbon (POC) ratio of individual coccolithophore cells. Coccolithophores fix dissolved inorganic carbon either through photosynthesis (POC) or through calcification (PIC) (Thierstein and Young, 2004). The ratio of calcification to photosynthesis (PIC/POC ratio) determines if coccolithophores act as a source or a sink of CO2 relative to the atmosphere (Balch et al., 1991; Holligan et al., 1993;
10
Buitenhuis et al., 1996) and therefore is an important variable for modeling carbon cycling in the oceans (Ridgwell et al., 2009). A further application of the information gained by FIB-sectioning was the calculation of the coccolithophore density. The latter allows for the estimation of sinking rates.
2 Material and methods 15
2.1 Samples
Clonal cultures of E. huxleyi (strain RCC1238) were grown in aged, sterile-filtered (0.2 µm pore-size cellulose-acetate filters) North Sea seawater enriched with 100 µmol L−1 nitrate, 6.25 µmol L−1 phosphate, trace metals and vitamins as in f/2 medium (Guillard and Ryther, 1962). The strains were obtained from the Roscoff
Cul-20
ture Collection (http://www.sb-roscoff.fr/Phyto/RCC). The cultures were grown under a 16/8 h light/dark cycle, at a light intensity of 400 µmol photons m−2s−1 in an
ad-justable incubator (Rubarth Apparate GmbH, Germany). The temperature used was 20◦C. Cells were grown in dilute batch cultures, ensuring a quasi-constant seawater carbonate system over the course of the experiment (Langer et al., 2009).
BGD
11, 12773–12797, 2014
Insight intoEmiliania huxleyi
coccospheres
R. Hoffmann et al.
Title Page
Abstract Introduction
Conclusions References
Tables Figures
◭ ◮
◭ ◮
Back Close
Full Screen / Esc
Printer-friendly Version
Interactive Discussion
Discussion
P
a
per
|
Discus
sion
P
a
per
|
Discussion
P
a
per
|
Discussion
P
a
per
|
The sample was filtered directly after the collection with a vacuum pump onto an Omnipore polycarbonate membrane filter (diameter: 47 mm, pore size: 0.45 µm), that was dried at 60◦C. The material was then carefully removed with a spattle from the dried filter dissolved in ethanol. Afterwards the sample was dropped on a silicon wafer and dried. In order to protect the sensitive sample material from electron beam damage
5
and to avoid charging effects a thin carbon film using a BAL-TEC coating system was deposited.
2.2 Instrumentation
For serial sectioning a Zeiss Auriga®crossbeam workstation, applying a SEM for imag-ing and a FIB microscope for cuttimag-ing roughly 50 nm thick slices from the coccolithophore
10
samples was used. The acceleration voltage of the SEM was set to 2 kV, and a 30 µm aperture resulting in 20 pA imaging current was used. The Auriga® is equipped with SE, BSE as well as in-lens detectors, which were used to image the cross-sectional slices at constant contrast and brightness settings.
The FIB gun was operated with 30 kV Ga+ ions and a polishing current of 240 pA.
15
During the cutting process the FIB gun is inclined by 54◦ with respect to the SEM gun and – thus – no sample rotation or tilt is required for imaging the cross-section of the cut sphere. In order to keep the ion damage as little as possible a local electrode to avoid charging was used and drift correction was performed before and after each slice. Drift correction and slice thickness measurement were done using a cross-marker in
20
BGD
11, 12773–12797, 2014
Insight intoEmiliania huxleyi
coccospheres
R. Hoffmann et al.
Title Page
Abstract Introduction
Conclusions References
Tables Figures
◭ ◮
◭ ◮
Back Close
Full Screen / Esc
Printer-friendly Version
Interactive Discussion
Discussion
P
a
per
|
Discus
sion
P
a
per
|
Discussion
P
a
per
|
Discussion
P
a
per
|
2.3 Carbon quota and density estimates
The cellular PIC (particulate inorganic carbon) quota was calculated using the following equation (Langer et al., 2009; Young and Ziveri, 2000):
PIC [pg]
cell =n·m· MC MCaCO3
=n·ρ· MC
MCaCO3
·V =n·ρ· MC
MCaCO3
·ks·L3 5
Here, n is the number of coccoliths per cell (coccosphere), m is the mass of one coccolith, MC
MCaCO3 is the molar mass ratio of C and CaCO3 which is equal to 0.12, ρ
is the density of the coccolith and V is the volume of one coccolith. V can be esti-mated according to (Young and Ziveri, 2000) with the help of the coccolith length L and the shape constantks. To compare our results to those of the literature we used 10
a coccolith length of L=3.5±1.0 µm and the E. huxleyi morphotype A shape
con-stant valueks=0.020±0.004 (Young and Ziveri, 2000). In addition, a density value of
ρ=2.7 pg µm−3 was used which is based on the assumption that the coccoliths are pure calcite (Young and Ziveri, 2000). The only remaining parametern, the number of coccoliths per cell, was determined experimentally by using the FIB sectioning.
15
The cellular POC (particulate organic carbon) quota can be calculated according to the literature as follows (Menden-Deuer and Lessard, 2000):
POC [pg] cell =a·V
b
cell
Here,Vcellis the volume of the cell (protoplast), which is calculated from the inner cocco-20
sphere diameter, andaandbare constants which vary depending on the investigated species. For plankton the literature values obtained via log-log plots areb=0.939 (with a 95 % confidence interval of 0.041) and loga=−0.665 (with a 95 % confidence
inter-val of 0.132) resulting in a inter-value of a=0.216 (Menden-Deuer and Lessard, 2000). For better comparison with literature we have used these values for our calculations.
BGD
11, 12773–12797, 2014
Insight intoEmiliania huxleyi
coccospheres
R. Hoffmann et al.
Title Page
Abstract Introduction
Conclusions References
Tables Figures
◭ ◮
◭ ◮
Back Close
Full Screen / Esc
Printer-friendly Version
Interactive Discussion
Discussion
P
a
per
|
Discus
sion
P
a
per
|
Discussion
P
a
per
|
Discussion
P
a
per
|
The inner coccosphere diameter was obtained experimentally by using the FIB cross-sections.
The overall cell density was estimated using the outer coccosphere diameter to cal-culate total cell volume. The total cell mass was calcal-culated as follows: The density of the protoplast was assumed to be equal to the density of seawater. Using the latter
as-5
sumption and the inner coccosphere diameter, i.e. the maximum protoplast diameter, the mass of the protoplast was calculated. The mass of the coccosphere, i.e. the calcite extracellular matrix mass and the non-calcite extracellular matrix mass, was calculated by using the cellular PIC quota, converted to the cellular calcite quota. The cellular calcite quota divided by the density of calcite yields the volume of the coccosphere
10
occupied by calcite. The volume derived from the outer coccosphere diameter minus the volume derived from the inner coccosphere diameter yields the total coccosphere volume, precisely the volume of the extracellular matrix. The latter minus the volume of the coccosphere occupied by calcite equals the volume of the coccosphere not oc-cupied by calcite. This residual volume was assumed to have the density of seawater.
15
Using the non-calcite coccosphere volume and the density of seawater, the mass of the non-calcite coccosphere volume can be calculated. The total cell mass was therefore the sum of the protoplast mass, the non-calcite extracellular matrix mass, and the cal-cite extracellular matrix mass. The total cell mass divided by the volume derived from the outer coccosphere diameter equals the overall cell density.
20
3 Results
To investigate the 3-D morphology and microstructure of the coccolithophore species
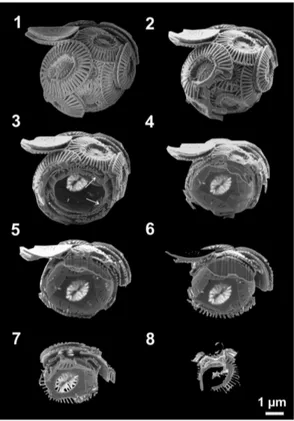
E. huxleyi serial sectioning in the SEM-FIB was used. Exemplary Fig. 1 shows one of the sectioned coccospheres. Here eight steps of the cutting process are summarized; additionally the whole video of the sectioning is given in the Supplement (supplement
25
BGD
11, 12773–12797, 2014
Insight intoEmiliania huxleyi
coccospheres
R. Hoffmann et al.
Title Page
Abstract Introduction
Conclusions References
Tables Figures
◭ ◮
◭ ◮
Back Close
Full Screen / Esc
Printer-friendly Version
Interactive Discussion
Discussion
P
a
per
|
Discus
sion
P
a
per
|
Discussion
P
a
per
|
Discussion
P
a
per
|
a single coccolith can be seen (lower left part of the image). The images 1.3 and 1.4 reveal that the coccosphere ofE. huxleyi is comprised of several coccolith layers. Arrows mark location where it is clearly visible that the coccoliths are interlocked. In the image 1.5 and 1.6 it can be observed that this coccosphere is constructed of three coccolith layers in the upper region and just one in the lower region. This observation
5
shows that the coccoliths are not evenly distributed over the coccosphere. Additionally, in image 1.6 the organic residues are visible in the upper part of the coccosphere. They can be recognized also in image 1.4 and 1.5. The images 1.7 and 1.8 illustrate the last steps of the FIB section before the coccolithophore was cut completely.
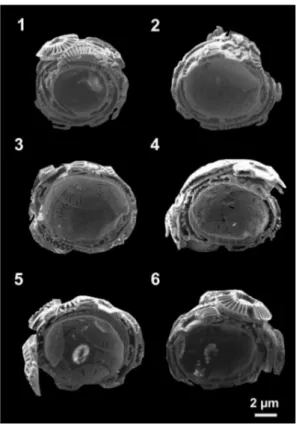
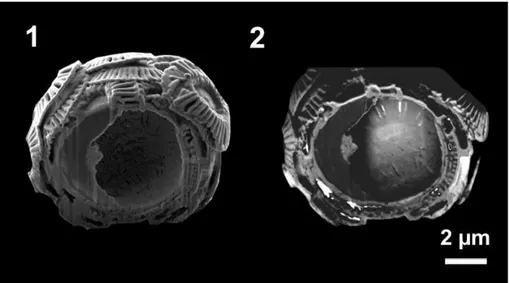
The SE images of six slicedE. huxleyi coccospheres are summarized in Fig. 2. To
10
illustrate the size distribution of the cell cavity the images used for this figure show the maximum diameter of the cavity. The architectural principle, i.e. the interlocking of individual coccoliths can be seen (Fig. 2). Figure 2 also displays exemplarily the coc-cosphere size distribution, the diversity in coccolith layer numbers and the assembly of the coccolith layers. Image 2.1 shows a coccosphere that is comprised of four
coccol-15
ith layers. Compared to the coccosphere in image 2.2, which consists of three layers, the inner coccosphere diameter of this four layer coccosphere is smaller. Whether this represents a trend, however, cannot be decided on the basis of a single observation. In image 2.3 a coccosphere with two coccolith layers and in image 2.4 a sphere with three coccolith layers is displayed. It can be seen that one side of the coccospheres
20
consists of one additional coccolith layer. In the images 2.5 and 2.6 two further exam-ples of E. huxleyi cross-sections with coccolith layers that are not evenly distributed over the coccosphere are given. Furthermore image 2.5 reveals an organic residue similar to that in image 1.6 in Fig. 1. The images in Fig. 2 illustrate that the thickness of the coccospheres is related to the coccolith layer number. This is clearly visible by
25
comparison of image 2.1 with 2.3 and 2.6.
BGD
11, 12773–12797, 2014
Insight intoEmiliania huxleyi
coccospheres
R. Hoffmann et al.
Title Page
Abstract Introduction
Conclusions References
Tables Figures
◭ ◮
◭ ◮
Back Close
Full Screen / Esc
Printer-friendly Version
Interactive Discussion
Discussion
P
a
per
|
Discus
sion
P
a
per
|
Discussion
P
a
per
|
Discussion
P
a
per
|
2–3 layer coccosphers were found. In a second prodedure the total coccolith number was counted by using the FIB section series. This method showed that the 2–3 layer coccospheres consist of around 20 coccoliths per cell.
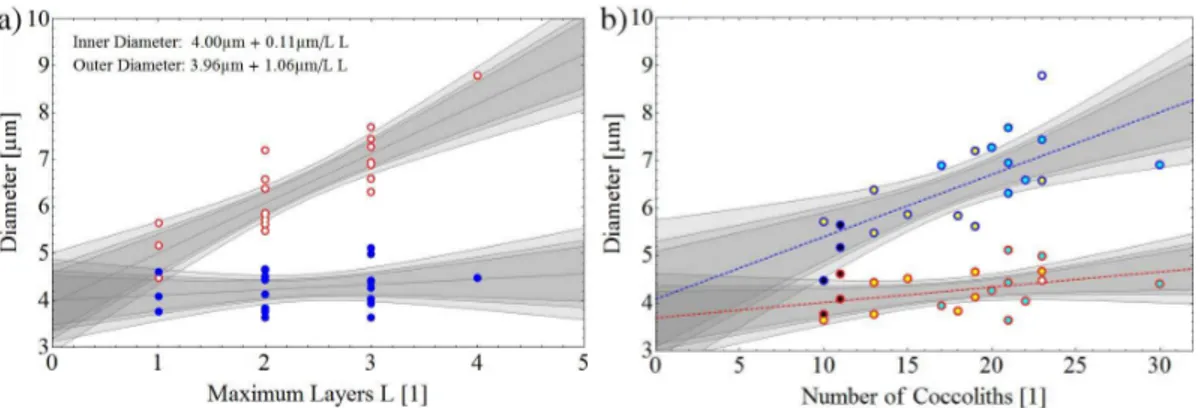
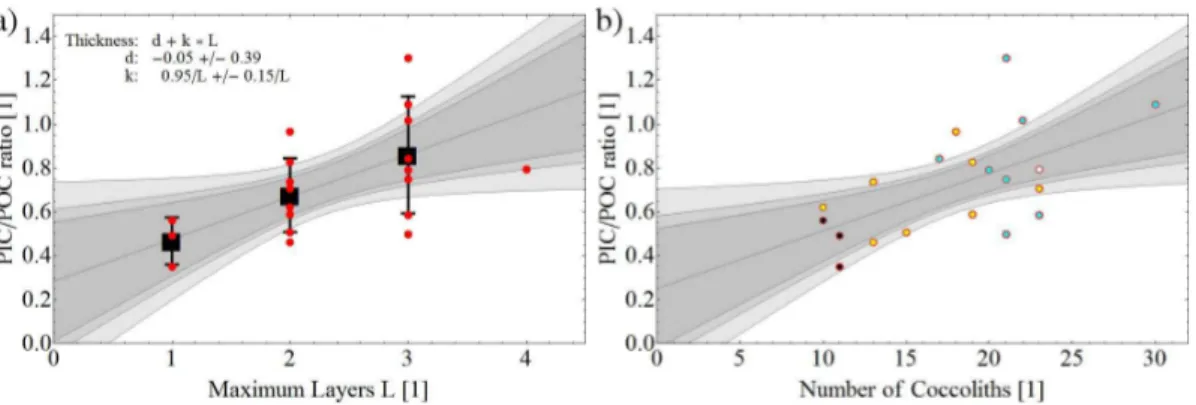
Serial SEM-FIB sectioning was performed at 27 differentE. huxleyi coccolithophores to compare the inner and outer diameters, the number of the coccolith layers and its
5
influence on the shell thickness. The SE images, which showed the maximum diameter of the cavity, were used to measure the diameter of the outer and inner coccosphere shell. The correlation between inner and outer diameter of the coccosphere shell is given in Fig. 3. The closed circles denote the outer diameter and the open circles the inner sphere diameter which are plotted in Fig. 3a as a function of the maximum
10
number of layers (in the case of non-equally distributed number of coccoliths). The gray lines correspond to the fitted slope as well as to the calculated 0.9, 0.95, and 0.99 confidence levels. The inner diameter of the coccosphere, which equals the cell diameter, is independent of the maximum number of coccolith layers, while the outer diameter increases linearly with the maximum number of coccolith layers. In addition,
15
we have plotted in Fig. 3b the inner and outer diameter of the coccosphere as a function of the number of coccoliths forming this shell. A similar trend can be observed, with the inner diameter remaining nearly constant and the outer diameter increasing with increasing number of coccoliths.
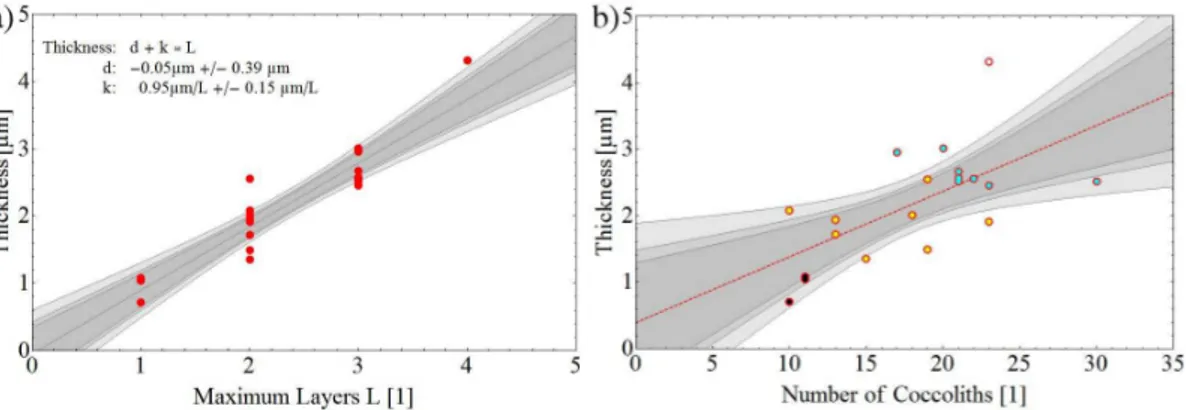
Figure 4 shows the relationship between coccosphere thickness (outer-inner
diam-20
eter) and the number of coccolith layers. Since the number of coccolith layers is only in one of three cases evenly distributed over the coccosphere (Fig. 2) the maximum number of coccolith layers was counted. Coccospheres with 1–4 coccolith layers were observed and since most measured points are given for 2–3 layers it is indicated that the average coccolith layer number for the used strain is 2–3 (Fig. 4). This figure shows
25
BGD
11, 12773–12797, 2014
Insight intoEmiliania huxleyi
coccospheres
R. Hoffmann et al.
Title Page
Abstract Introduction
Conclusions References
Tables Figures
◭ ◮
◭ ◮
Back Close
Full Screen / Esc
Printer-friendly Version
Interactive Discussion
Discussion
P
a
per
|
Discus
sion
P
a
per
|
Discussion
P
a
per
|
Discussion
P
a
per
|
increasing linearly with increasing number of coccoliths. The fitted slope as well as the confidence level is given by the gray lines.
To gain detailed information of the coccosphere structure different detectors were used for the imaging. In Fig. 5 one coccosphere cross-section imaged by two diff er-ent imaging methods is shown. An image obtained by a SE detector using the surface
5
near secondary electrons is given in 5.1. Here the surface topography is illustrated and the SE image gives a three dimensional impression due to the effect that surfaces, which are inclined to the detector, appear brighter than surfaces that are turned away (Goodhew et al., 2000). In image 5.2 a BSE in-lens detector was used to create the micrograph. These images reveal information about the elements and the crystal
ori-10
entation. Light elements like carbon occur darker than elements with a higher atomic number. Due to this so called material/compositional contrast the organic residue at the left side of the coccosphere is dark gray in image 5.2. The contrast differences of the coccoliths, which can be seen in image 5.2 (brighter area at the lower right side of the coccosphere) can be caused by orientation differences of the calcite platelets.
15
4 Discussion
In the present study FIB-SEM sectioning was used to gain detailed information about the architecture ofE. huxleyi coccospheres. FIB-SEM sectioning was shown to be ap-propriate for biological samples in 1993 for the first time (Young et al., 1993). Since this seminal study this method improved and several groups reported about the use of
20
FIB-SEM microscopes for material sciences and biological materials (Phaneuf, 1999; Uchic et al., 2006; Giannuzzi et al., 2007; Leser et al., 2009; Grandfield and Engquvist, 2012; Srot et al., 2012). Nevertheless the investigation of biological and non-conductive materials remains challenging due to the sensitive nature of these samples and their in-teraction with the electron and ion beam (Grandfield and Engquvist, 2012). The quality
25
BGD
11, 12773–12797, 2014
Insight intoEmiliania huxleyi
coccospheres
R. Hoffmann et al.
Title Page
Abstract Introduction
Conclusions References
Tables Figures
◭ ◮
◭ ◮
Back Close
Full Screen / Esc
Printer-friendly Version
Interactive Discussion
Discussion
P
a
per
|
Discus
sion
P
a
per
|
Discussion
P
a
per
|
Discussion
P
a
per
|
a local electrode close to the imaged area. Thus, drift due to charging during the FIB-milling as well as SEM imaging was considerably reduced and a continuous drift cor-rection before and after each slice was not necessary. Slice thickness evaluation and drift correction were only performed in a post processing step using the SE-images and a cross-marker. The combination of these methods allowed us to increase the imaging
5
quality and to gain a relatively stable FIB section series. Nevertheless charging effects could not be completely avoided.
In any case, we have shown that FIB-SEM sectioning is an appropriate method to an-alyze coccosphere architecture in a way which is impossible using conventional SEM. For instance the number of coccoliths per cell can only be estimated on the basis of
10
conventional scanning electron micrographs, because not all coccoliths can be seen. In an experimental study usingCalcidiscus leptoporusthe number of visible coccoliths per coccosphere was analyzed (Langer et al., 2006). This approach might yield a sat-isfactory result forCalcidiscus, which typically produces one layer of coccoliths only. However, the situation, is more complicated inE. huxleyi, because the latter species
15
does not stop coccolith production upon cessation of cell division (Langer et al., 2013a) or completion of a coccosphere, resulting in multiple layers of coccoliths (Paasche, 2002). These multiple layers can even be seen in exponentially growing cultures, such as the one analysed here. We showed thatE. huxleyi RCC1238 features 2–3 layers of coccoliths, corresponding to 20 coccoliths per cell. Using the conventional SEM view
20
of a coccosphere, only 15 coccoliths can be seen. Thus the latter approach underesti-mates coccolith quota by 25 %.
Another interesting aspect of multi-layer coccospheres is the diameter of the cocco-sphere. The outer coccosphere diameter was positively correlated with the number of layers (Fig. 3). Our results show that coccospheres composed of 1–3 coccolith layers
25
have a quasi-constant inner diameter of about 4.36 µm (Fig. 3).
con-BGD
11, 12773–12797, 2014
Insight intoEmiliania huxleyi
coccospheres
R. Hoffmann et al.
Title Page
Abstract Introduction
Conclusions References
Tables Figures
◭ ◮
◭ ◮
Back Close
Full Screen / Esc
Printer-friendly Version
Interactive Discussion
Discussion
P
a
per
|
Discus
sion
P
a
per
|
Discussion
P
a
per
|
Discussion
P
a
per
|
verting the coccolith size to mass (Young and Ziveri, 2000). Hence these data render it possible to estimate the PIC/POC ratio of individual cells. We calculated a cellu-lar POC quota of 7.2 (standard deviation (SD) 2.1) pg/cell and a PIC quota of 5 (SD 1.5) pg/cell. Both the POC and the PIC quota are lower than values determined on bulk samples using elemental analysis via dynamical flash combustion (Langer et al.,
5
2009). The difference between our estimates and the data in Langer et al. (2009), how-ever, is very small considering the two radically different approaches used to determine carbon quotas. First, we used a small sample of individual cells as opposed to an aver-age of millions of cells. Second, our estimates are based on standardised conversion factors, which might not be perfectly suited for this particular set of samples. Third, our
10
raw data are biometrical as opposed to the chemical-analytical raw data on which the Langer et al. (2009) dataset is based. The PIC/POC ratio estimated here, i.e. 0.70 (SD 0.24), falls well within the range of values reported in Langer et al., 2009. The, by comparison with data in Langer et al. (2009), high standard deviation of 0.24 reflects the fact that we picked a small sample of cells comprising a considerable range with
15
respect to number of coccolith layers or number of coccoliths (Fig. 6). There is, despite the large scatter in the data, a clear positive correlation between the PIC/POC ratio and the number of coccolith layers.
The latter data seem, at first glance, to suggest that a higher PIC/POC ratio entails a higher overall density of the cell (Benner, 2008). The latter assumption is important
20
in the ongoing debate on the question of nutrient limitation of coccolithophores in par-ticular and the function of coccoliths in general. It has been put forth that coccoliths act as ballast stones in the cell’s buoyancy control (Winter and Siesser, 1994). A widely held, but by no means uncontested (Langer et al., 2012, 2013b), notion is that nutrient limitation leads to increased calcification rate, which in turn leads to a higher overall
25
pos-BGD
11, 12773–12797, 2014
Insight intoEmiliania huxleyi
coccospheres
R. Hoffmann et al.
Title Page
Abstract Introduction
Conclusions References
Tables Figures
◭ ◮
◭ ◮
Back Close
Full Screen / Esc
Printer-friendly Version
Interactive Discussion
Discussion
P
a
per
|
Discus
sion
P
a
per
|
Discussion
P
a
per
|
Discussion
P
a
per
|
sible to test the hypothesis that an increase in the PIC/POC ratio entails an increase in overall cell density and therefore in the sinking rate (Benner, 2002).
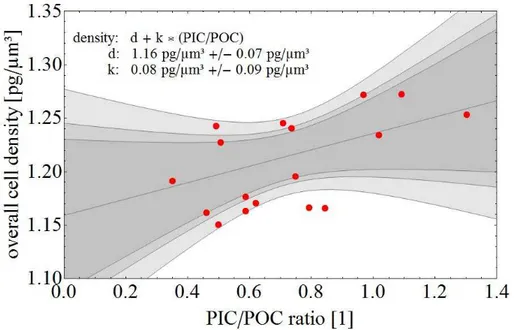
Figure 7 shows that there is no good correlation between overall cell density and the PIC/POC ratio. Hence a change in PIC/POC ratio alone is not sufficient to infer a change in overall cell density. This might seem counter-intuitive, but reflects the fact
5
that cell architecture plays an important role in defining overall cell density. The role of cell architecture has, understandably, been overlooked so far. It is simply not possible to obtain the required information on architecture in the context of a standard culture experiment, because the number of analyses required is at least an order of magnitude bigger than the one performed in the present study. This is far too time-consuming to fit
10
the scope of a standard culture experiment, which usually focuses on other parameters such as organic carbon production. Is the method of estimating density (see Material and Methods) employed here accurate enough? We argue that it is. First, the values calculated here tally well with the ones calculated by Bach et al., 2012 based on a fun-damentally different approach. Second, the assumptions made here, are reasonable.
15
Most marine phytoplankton cells have, indeed, a protoplast density which equals that of seawater (Boyd and Gradmann, 2002). Moreover it is reasonable to assume that the non-calcite space in the coccosphere has the density of seawater, because it actually is seawater in a polysaccharide matrix. And even if the polysaccharides present (Hen-riksen et al., 2004), should lower the density, this would only affect the absolute value
20
of overall cell density and not the relationship of overall cell density and the PIC/POC ratio (Fig. 7). In summary, our cell architecture based approach allows us to estimate, with sufficient accuracy, the overall density of an individual coccolithophore cell. Taken together with individual cell PIC/POC ratios, this sheds new light on the old question of the relationship between coccolithophore nutrient limitation and sinking rates.
BGD
11, 12773–12797, 2014
Insight intoEmiliania huxleyi
coccospheres
R. Hoffmann et al.
Title Page
Abstract Introduction
Conclusions References
Tables Figures
◭ ◮
◭ ◮
Back Close
Full Screen / Esc
Printer-friendly Version
Interactive Discussion
Discussion
P
a
per
|
Discus
sion
P
a
per
|
Discussion
P
a
per
|
Discussion
P
a
per
|
5 Conclusions
In the present work we studied the shells ofE. huxleyi coccoliths by using a combina-tion of FIB seccombina-tioning and SEM imaging. We showed that the combinacombina-tion of a thin car-bon film coating and drift correction by using a cross-marker in a post-processing step is a useful method to reduce charging effects and drift when imagingE. huxleyi
coc-5
cospheres by means of FIB-SEM. By using this preparation and imaging technique we were able to get information about the inner assembly ofE. huxleyi coccolithophores. The culture (Strain RCC1238) used here, was found to consist of 2 to 3 coccolith layers and an average number of 20 coccoliths per cell. The cell cavity for these coccospheres shows a constant size of about 4.36 µm. FIB sectioning was shown to be a useful tool to
10
elucidate coccosphere architecture, rendering accurate determination of cellular coc-colith quota and estimates of single cell PIC/POC ratios possible.
The Supplement related to this article is available online at doi:10.5194/bgd-11-12773-2014-supplement.
Author contribution. All authors have contributed to the study and have given approval to the 15
final version of the manuscript.
Acknowledgements. We are thankful for receiving funding by the German Science Foundation (DFG, Grant Nr. SCHM 930/15-1). R. H. thanks the Bayerische Eliteförderung (BayEFG) for a fellowship. This work was funded in part by the European Research Council (ERC grant 2010-NEWLOG ADG-267931 HE). We thank I. Druckenmüller for her assistance in this project. 20
BGD
11, 12773–12797, 2014
Insight intoEmiliania huxleyi
coccospheres
R. Hoffmann et al.
Title Page
Abstract Introduction
Conclusions References
Tables Figures
◭ ◮
◭ ◮
Back Close
Full Screen / Esc
Printer-friendly Version
Interactive Discussion
Discussion
P
a
per
|
Discus
sion
P
a
per
|
Discussion
P
a
per
|
Discussion
P
a
per
|
References
Balch, W. M., Holligan, P. M., Ackleson, S. G., and Voss, K. J.: Biological and optical properties of mesoscale coccolithophore blooms in the Gulf of Maine, Limnol. Oceanogr., 36, 629–43, 1991.
Baumann, G. F., Isenberg, H. D., and Gennaro, J. J.: The inverse relationship between nu-5
trient nitrogen concentration and coccolith calcification in cultures of the coccolithophorid
Hymenomonassp., J. Protozool., 25, 253–6, 1978.
Benner, I.: The utilization of organic nutrients in marine phytoplankton with emphasis on coc-colithophores, Dissertation, Universität Bremen, 2008.
Bown, P. and Pearson, P.: Calcareous plankton evolution and the Paleocene/Eocene thermal 10
maximum event: new evidence from Tanzania, Mar. Micropaleontol., 71, 60–70, 2009. Boyd, C. M. and Gradmann, D.: Impact of osmolytes on buoyancy of marine phytoplankton,
Mar. Biol., 141, 605–18, 2002.
Buitenhuis, E., van Bleijswijk, J., Bakker, D., and Veldhuis, M.: Trends in inorganic and organic carbon in a bloom ofEmiliania huxleyiin the North Sea, Mar. Ecol.-Prog. Ser., 143, 271–82, 15
1996.
Curey, H., Lowenstam, H. A., Epstein, S., and McKinney, C. R.: Measurement of paleotempera-tures and temperapaleotempera-tures of the upper cretaceous of England, Denmark, and the southeastern United States, Geol. Soc. Am. Bull., 62, 399–416, 1951.
Gerhard, F. and Wefer, G., eds.: Use of Proxies in Paleoceanography. Examples from the South 20
Atlantic, Springer-Verlag, Berlin, Heidelberg, 1999.
Giannuzzi, L. A., Phifer, D., Giannuzzi, N. J., and Capuano, M. J.: Two-dimensional and 3-dimensional analysis of bone/dental implant interfaces with the use of focused ion beam and electron microscopy, J. Oral Maxil. Surg., 65, 737–47, 2007.
Gibbs, S. J., Poulton, A. J., Bown, P. R., Daniels, C. J., Hopkins, J., Young, J. R. et al.: Species-25
specific growth response of coccolithophores to Palaeocene–Eocene environmental change, Nat. Geosci., 6, 218–22, 2013.
Goodhew, P. J., Humphreys, J. F., and Beanland, R.: Electron Microscopy and Analysis, 3rd edn., Taylor and Francis, London, New York, 2001.
Grandfield, K. and Engqvist, H.: Focused ion beam in the study of biomaterials and biological 30
BGD
11, 12773–12797, 2014
Insight intoEmiliania huxleyi
coccospheres
R. Hoffmann et al.
Title Page
Abstract Introduction
Conclusions References
Tables Figures
◭ ◮
◭ ◮
Back Close
Full Screen / Esc
Printer-friendly Version
Interactive Discussion
Discussion
P
a
per
|
Discus
sion
P
a
per
|
Discussion
P
a
per
|
Discussion
P
a
per
|
Mc Grouther, D. and Munroe, P. R.: Imaging and analysis of 3-D structure using a dual beam FIB, Microsc. Res. Tech., 70, 186–94, 2007.
Guillard, R. R. L. and Ryther, J. H.: Studies of marine planktonic diatoms, I,Cyclotella nanna
(Hustedt) andDetonula convervacea(Cleve), Can. J. Microbiol., 8, 229–39, 1962.
Hamilton, E. L.: Upper Cretaceous, Tertiary, and recent planktonic foraminifera from mid-Pacific 5
flat-topped seamounts, J. Paleontol., 27, 204–37, 1953.
Henriksen, K., Stipp, S. L. S., and Young, J. R.: Biological control on calcite crystallization: AFM investigation of coccolith polysaccharide function, Am. Mineral., 89, 1709–16, 2004.
Holligan, P. M., Fernández, E., Aiken, J., Balch, W. M., Boyd, P., Burkill, P. H. et al.: A bio-geochemical study of the coccolithophore,Emiliania huxleyi, in the North Atlantic, Global 10
Biogeochem. Cy., 7, 879–900, 1993.
Holzapfel, C., Schäf, W., Marx, M., Vehoff, H., and Mücklich, F.: Interaction of cracks with pre-cipitates and grain boundaries: understanding crack growth mechanisms through focused ion beam tomography, Scripta Mater., 56, 697–700, 2007.
Inkson, B. J., Mulvihill, M., and Möbus, G.: 3-D determination of grain shape in a FeAl-based 15
nanocomposite by 3-D FIB tomography, Scripta Mater., 45, 753–8, 2001.
Kato, M., Ito, T., Aoyama, Y., Sawa, K., Kaneko, T., Kawase, N. et al.: Three-dimensional struc-tural analysis of a block copolymer by scanning electron microscopy combined with a focused ion beam, J. Polym. Sci. Pol. Phys., 45, 677–83, 2007.
Kelm, K., Goetz, A., Sehrbrock, A., Irsen, S., Hoffmann, R., Schmahl, W. W. et al.: Mosaic 20
structure in the spines ofHolopneustes porossisimus, Z. Kristallogr., 227, 758–65, 2012. Kubis, A. J., Shiflet, G. J., Dunn, D. N., and Hull, R.: Focused ion-beam tomography, Metall.
Mater. Trans. A, 35, 1935–43, 2004.
Langer, G., Geisen, M., Baumann K-H, Kläs, J., Riebesell, U., Thoms, S. et al.: Species-specific responses of calcifying algae to changing seawater carbonate chemistry, Geochem. Geophy. 25
Geosy., 7, 1–12, 2006.
Langer, G., Nehrke, G., Probert, I., Ly, J., and Ziveri, P.: Strain-specific responses of Emil-iania huxleyi to changing seawater carbonate chemistry, Biogeosciences, 6, 2637–2646, doi:10.5194/bg-6-2637-2009, 2009.
Langer, G., Oetjen, K., and Brenneis, T.: Calcification ofCalcidiscus leptoporusunder nitrogen 30
and phosphorus limitation, J. Exp. Mar. Bio. Ecol., 413, 131–7, 2012.
BGD
11, 12773–12797, 2014
Insight intoEmiliania huxleyi
coccospheres
R. Hoffmann et al.
Title Page
Abstract Introduction
Conclusions References
Tables Figures
◭ ◮
◭ ◮
Back Close
Full Screen / Esc
Printer-friendly Version
Interactive Discussion
Discussion
P
a
per
|
Discus
sion
P
a
per
|
Discussion
P
a
per
|
Discussion
P
a
per
|
Langer, G., Oetjen, K., and Brenneis, T.: Coccolithophores do not increase particulate carbon production under nutrient limitation: a case study usingEmiliania huxleyi (PML B92/11), J. Exp. Mar. Bio. Ecol., 443, 155–61, 2013b.
Leser, V., Drobne, D., Pipan, Z., Milani, M., and Tatti, F.: Comparison of different preparation methods of biological samples for FIB milling and SEM investigation, J. Microsc., 233, 309– 5
19, 2009.
Menden-Deuer, S. and Lessard, E. J.: Carbon to volume relationships for dinoflagellates, di-atoms, and other protist plankton, Limnol. Oceanogr., 45, 569–79, 2000.
Nalla, R. K., Porter, A. E., Daraio, C., Minor, A. M., Radmilovic, V., Stach, E. A. et al.: Ultra-structural examination of dentin using focused ion-beam cross-sectioning and transmission 10
electron microscopy, Micron, 36, 672–80, 2005.
Paasche, E.: Roles of nitrogen and phosphorus in coccolith formation in Emiliania huxleyi
(Prymnesiophyceae), Eur. J. Phycol., 33, 33–42, 1998.
Paasche, E.: A review of the coccolithophoridEmiliania huxleyi(Prymnesiophyceae), with par-ticular reference to growth, coccolith formation, and calcification-photosynthesis interactions, 15
Phycologia, 40, 503–29, 2002.
Phaneuf, M. W.: Applications of focused ion beam microscopy to materials science specimens, Micron, 30, 277–88, 1999.
Ridgwell, A., Schmidt, D. N., Turley, C., Brownlee, C., Maldonado, M. T., Tortell, P., and Young, J. R.: From laboratory manipulations to Earth system models: scaling calcification 20
impacts of ocean acidification, Biogeosciences, 6, 2611–2623, doi:10.5194/bg-6-2611-2009, 2009.
Schmahl, W. W., Griesshaber, E., Merkel, C., Kelm, K., Deuschle, J., Neuser, R. D. et al.: Hier-archical fibre composite structure and micromechanical properties of phosphatic and calcitic brachiopod shell biomaterials – an overview, Miner. Mag., 72, 541–62, 2008.
25
Srot, V., Bussmann, B., Salzberger, U., Koch, C. T., and van Aken, P. A.: Linking microstructure and nanochemistry in human dental tissues, Microsc. Microanal., 18, 509–23, 2012.
Stoll, H. M. and Schrag, D. P.: Coccolith Sr/Ca as a new indicator of coccolithophorid calcifica-tion and growth rate, Geochem. Geophy. Geosy., 1, 1–29, 2000.
Thierstein, H. R. and Young, J. R., eds.: Coccolithophores: from Molecular Processes to Global 30
BGD
11, 12773–12797, 2014
Insight intoEmiliania huxleyi
coccospheres
R. Hoffmann et al.
Title Page
Abstract Introduction
Conclusions References
Tables Figures
◭ ◮
◭ ◮
Back Close
Full Screen / Esc
Printer-friendly Version
Interactive Discussion
Discussion
P
a
per
|
Discus
sion
P
a
per
|
Discussion
P
a
per
|
Discussion
P
a
per
|
Uchic, M. D., Groeber, M. A., Dimiduk, D. M., and Simmons, J. P.: 3-D microstructural char-acterization of nickel superalloys via serial-sectioning using a dual beam FIB-SEM, Scripta Mater., 55, 23–8, 2006.
Williams, R. E. A., Uchic, M., Dimiduk, D., and Fraser, H. L.: Three-dimensional reconstruction of alpha laths in alpha/beta titanium alloys by serial sectioning with a FEI NOVA, Microsc. 5
Microanal., 11, 836–7, 2005.
De Winter, M. D. A., Schneijdenberg, C. T. W. M., Lebbink, M. N., Lich, B., Verkleij, A. J., Drury, M. R. et al.: Tomography of insulating biological and geological materials using fo-cused ion beam (FIB) sectioning and low-kV BSE imaging, J. Microsc., 233, 372–83, 2009. Winter, A. and Siesser, G. W., eds.: Coccolithophores, University Press, Cambridge, 1994. 10
Young, J. R. and Henriksen, K.: Biomineralization within vesicles: the calcite of coccoliths, Rev. Min. Geochem., 54, 189–215, 2003.
Young, J. R. and Ziveri, P.: Calculation of coccolith volume and it use in calibration of carbonate flux estimates, Deep-Sea Res. Pt. II, 47, 1679–700, 2000.
Young, J. R., Didymus, J. M., Bown, P. R., Prins, B., and Mann, S.: Crystal assembly and 15
phylogenetic evolution in heterococcoliths, Nature, 356, 516–8, 1992.
Young, R. J., Dingle, T., Robinsonts, K., and Pugh, P. J. A.: An application of scanned focused ion beam milling to studies on the internal morphology of small arthropods, J. Microsc., 172, 81–8, 1993.
Young, J. R., Davis, S. A., Bown, P. R., and Mann, S.: Coccolith ultrastructure and biominerali-20
BGD
11, 12773–12797, 2014
Insight intoEmiliania huxleyi
coccospheres
R. Hoffmann et al.
Title Page
Abstract Introduction
Conclusions References
Tables Figures
◭ ◮
◭ ◮
Back Close
Full Screen / Esc
Printer-friendly Version
Interactive Discussion
Discussion
P
a
per
|
Discus
sion
P
a
per
|
Discussion
P
a
per
|
Discussion
P
a
per
|
Figure 1.Eight selected steps of SEM-FIB sectioning of the coccolithophore speciesE.
BGD
11, 12773–12797, 2014
Insight intoEmiliania huxleyi
coccospheres
R. Hoffmann et al.
Title Page
Abstract Introduction
Conclusions References
Tables Figures
◭ ◮
◭ ◮
Back Close
Full Screen / Esc
Printer-friendly Version
Interactive Discussion
Discussion
P
a
per
|
Discus
sion
P
a
per
|
Discussion
P
a
per
|
Discussion
P
a
per
|
Figure 2.Six exemplary SE images of cross-sections through the coccolithophore speciesE.
BGD
11, 12773–12797, 2014
Insight intoEmiliania huxleyi
coccospheres
R. Hoffmann et al.
Title Page
Abstract Introduction
Conclusions References
Tables Figures
◭ ◮
◭ ◮
Back Close
Full Screen / Esc
Printer-friendly Version
Interactive Discussion
Discussion
P
a
per
|
Discus
sion
P
a
per
|
Discussion
P
a
per
|
Discussion
P
a
per
|
Figure 3. The correlation between inner and outer coccosphere diameter is illustrated. The
BGD
11, 12773–12797, 2014
Insight intoEmiliania huxleyi
coccospheres
R. Hoffmann et al.
Title Page
Abstract Introduction
Conclusions References
Tables Figures
◭ ◮
◭ ◮
Back Close
Full Screen / Esc
Printer-friendly Version
Interactive Discussion
Discussion
P
a
per
|
Discus
sion
P
a
per
|
Discussion
P
a
per
|
Discussion
P
a
per
|
Figure 4. (a)The relationship between the number of coccolith layers which build the sphere
BGD
11, 12773–12797, 2014
Insight intoEmiliania huxleyi
coccospheres
R. Hoffmann et al.
Title Page
Abstract Introduction
Conclusions References
Tables Figures
◭ ◮
◭ ◮
Back Close
Full Screen / Esc
Printer-friendly Version
Interactive Discussion
Discussion
P
a
per
|
Discus
sion
P
a
per
|
Discussion
P
a
per
|
Discussion
P
a
per
|
Figure 5.SEM images of a coccosphere cross-section gained by two different imaging
BGD
11, 12773–12797, 2014
Insight intoEmiliania huxleyi
coccospheres
R. Hoffmann et al.
Title Page
Abstract Introduction
Conclusions References
Tables Figures
◭ ◮
◭ ◮
Back Close
Full Screen / Esc
Printer-friendly Version
Interactive Discussion
Discussion
P
a
per
|
Discus
sion
P
a
per
|
Discussion
P
a
per
|
Discussion
P
a
per
|
Figure 6.The calculated PIC/POC ratio as a function of(a)maximum layer of coccoliths and
BGD
11, 12773–12797, 2014
Insight intoEmiliania huxleyi
coccospheres
R. Hoffmann et al.
Title Page
Abstract Introduction
Conclusions References
Tables Figures
◭ ◮
◭ ◮
Back Close
Full Screen / Esc
Printer-friendly Version
Interactive Discussion
Discussion
P
a
per
|
Discus
sion
P
a
per
|
Discussion
P
a
per
|
Discussion
P
a
per
|
Figure 7.The overall cell density as function of the PIC/POC ratio is given. The black trend