ISSN 0104-6632 Printed in Brazil
www.abeq.org.br/bjche
Vol. 30, No. 03, pp. 563 - 573, July - September, 2013
Brazilian Journal
of Chemical
Engineering
AN EXPERIMENTAL SIMULATION MODEL FOR
COATED PAPER DRYING
A. Hallajisani
1, H. Shahbeig
1*, S. J. Hashemi
1and W. J. Murray Douglas
2 1School of Chemical Engineering, University College of Engineering, University of Tehran, Tehran, Iran. Phone: + (98 21 66957780), Fax: + (98 2166957781)
E-mail: [email protected]
2
Pulp and Paper Research Centre, Department of Chemical Engineering, McGill University, Montreal, Quebec, Canada.
(Submitted: April 20, 2012 ; Revised: August 10, 2012 ; Accepted: August 13, 2012)
Abstract - Due to the lack of information regarding the phenomena of mass, heat, and momentum transfer in coated paper drying, substantial research work still needs to be done. A simulation model for coated paper drying is introduced which integrates heat and mass transfer mechanisms. In the model, the coated paper was assumed to have 3 layers (coated layer, wet and dry layers of the base paper), in which the thickness of each layer is a function of drying time and condition. The thickness of the wet layer of the base paper was considered to be a function of water permeability rate that in turn is a function of the moisture diffusion coefficient, time and drying rate. Movement of vapor resulting from evaporation in the middle layer was assumed to be a combination of laminar bulk flow and molecular diffusion. Radiation absorption was used as a diminishing exponential model, which depends on moisture content. Hot air and super heated vapor were used as drying fluids. Functional variables were temperature, drying fluid velocity and delay time. To verify the simulation results two compositions were applied for the coating suspension. The simulation results matched well with experimental outcomes.
Keywords: Coated paper; Coating suspension;Superheated vapordrying; Rewetting; Capillary force.
INTRODUCTION
Models presented for drying coated papers are either microscopic or macroscopic. In microscopic models, components of various mechanisms of mass, heat and momentum transfer are taken into account; based on the simulation results, the quantities of temperature and moisture are found at a specific time. In macroscopic models, components of transfer mechanisms are not addressed; by defining the overall mass and heat equilibriums, the overall temperature and moisture content are determined. In order to predict the effects of the drying method, the com-position of the coating suspension and the base paper type on the paper quality, finding the internal proper-ties at each moment is essential. Therefore, the microscopic method is preferred over the macro-scopic one for the simulation and modeling of coated
paper drying. In the microscopic method, the coated paper is divided into three layers:
1) Coated layer
2) Moist layer of base paper
3) Completely dry layer of base paper.
The thickness of each layer is a function of time, the initial moisture content in the coated layer, delay time, and the composition of the coating suspension.
model. However rewetting, shrinkage and binder type were not dealt with in their model (Pan et al., 1995). Although, these models have certain advan-tages and disadvanadvan-tages, in most of them, paper shrinkage and movement of the binding material were not pondered, mostly due to the lack of experimental and thermodynamic data for the latter.
In the present model, paper shrinkage while drying, rewetting of the base paper due to dewatering of the coating layer, the depth of moisture penetra-tion in the base paper, radiapenetra-tion absorppenetra-tion in the paper’s middle layers, bulk movement of vapor in the final stage of drying, and the type of coating material are considered. Due to the lack of thermo-dynamic information as well as laboratory data, no model could be presented for the solid distribution in the coating solution across the coated paper.
COATING- DRYING PROCESS
Paper is coated in order to improve paper softness and brightness, to make a discernible surface and to increase the printing quality. The coating suspension is a colloidal suspension which is designed and produced to maximize the required qualities of the paper. Basically this mixture consists of a pigment, a binding material and additives. Type and quantity of those components result in different solidification behaviors, causing versatility in the final properties of the coated sheet. Blade coating is a widely used technique in which the freshly applied coating film is smoothed and the excess removed by a thin, flexible metal blade. There is a short distance (about 0.5 meter) between the blade and applicator in the unit.
Immediately after coating, drying must take place. The interval between coating and drying is called the delay time, during which the moisture in the coated layer moves into the base paper while transferring the binding material thereto. Conse-quently, a longer time is needed for drying, which affects the optical properties and quality of the coated sheet. Considering the high moisture content in coated paper, non-contact dryers such as IR dryers and convective dryers are used. Application of contact dryers such as drum dryers is recommended only at the end to complete drying and create softness.
As drying process starts, two competing factors, surface evaporation and moisture diffusion into the base paper (dewatering), will determine the average drying rate, temperature distribution and moisture content across the paper.
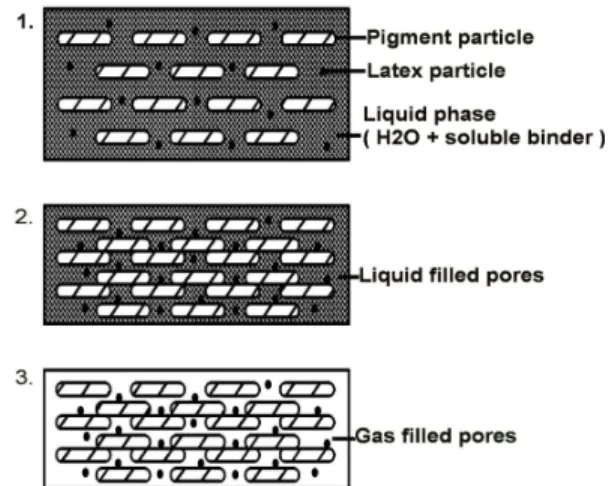
Paper drying can be categorized into three stages (Figure 1):
1) Initially, particles are dispersed and move freely, evaporation takes place on the surface, and
water enters the base sheet along with binding
material. Basically due to the small gravitational force, moisture enters the base sheet by permeation and moves inside it.
2) As drying continues, at a certain moment particles join together completely. In this stage, solids concentration in the coated layer is called the First Critical Concentration (FCC) or Immobilization Solids Content (Engström and Rigdahl, 1986).
3) After FCC, the moisture within the particles moves out and reaches the sheet surface through mechanisms such as capillary suction force. The overall structural shape of the coated layer does not change during this stage, but its thickness decreases. This stage lasts until the free moisture within the particles is removed completely (Watanabe and Lepourte 1982). The solids concentration at this moment is called the Second Critical Concentration (SCC). From this moment on, dewatering terminates.
Figure 1: Changes in coated layer structure during drying.
Having passed the SCC, the liquid surface leaves the coated layer and goes down into the coating layer. The liquid is removed primarily from bigger pores and then smaller pores. Moisture is evaporated at its sites, and the resulting vapor passes through a distance from the evaporation point up to the paper-fluid interface.
COATED PAPER DRYING MODEL
Model Formulation
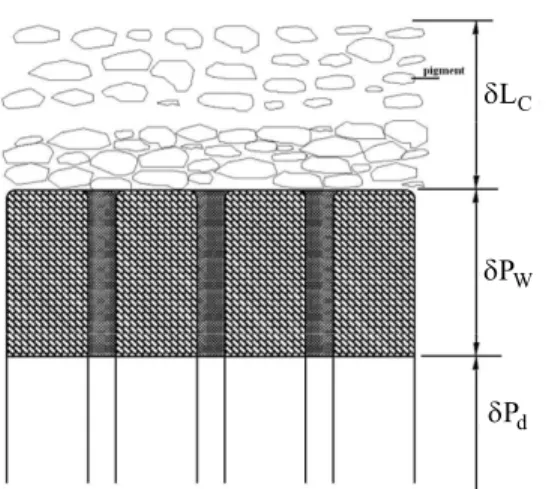
1) Coated layer δLC
2) Wetted base paper layer δPW 3) Dry base paper layer.
C
L δ
W
P δ
d
P δ
C
L δ
W
P δ
d
P δ
Figure 2: Schematic of coated paper while drying.
The extent of δLC at the outset depends on the concentration and volume content of solid particles and the lighter the solid particles the greaterδLC. During the delay time, before reaching the SCC condition, the moisture inside the coated layer enters the base paper together with binding material; the longer this period the greater δPW.
The extent of δPW depends on the delay time and moisture diffusion into the base paper. The following equation is proposed for its calculation Arpaci (1966):
W,t W,0 x,t
P P 12D t
δ = δ + (1)
W,0 P
δ = A layer of base paper wetted prior to
entering the dryer.
x,t
D = coefficient of moisture diffusion into the
base paper, which is a function of moisture content and temperature (Hashemi et al., 2003).
(
)
P P P
x x x
D =F T , X (2)
Since D is a strong function of temperature and Px moisture content; which are highly variable parameters during drying, the value of δPW,t had to be determined numerically.
The thickness of the dry base paper layer was obtained using Equation (3). The base paper expan-sion is assumed to be constant.
d d,0 W,t
P P P
δ = δ − δ (3)
d,0 P
δ = base paper thickness
The thickness of the coated layer will be:
L
C,0 L C,0
c,d
L CW X⎡ ρ ⎤
δ = ρ ⎢ +ρ ⎥
⎢ ⎥
⎣ ⎦ (4)
C,t t C,t C
L +Δ L L
δ = δ − Δδ (5)
C C,t
L,t CW
L X
Δδ =ρ Δ XC,t≥XSCC (6)
When XC,t<XSCC, the thickness of the coated layer is constant and the liquid level moves down into the coated layer. The thickness of the internal layer, which is water-free and filled with gas, is ob-tained by the following equation:
V C,SCC C,t
C L,t CW
y L X
δ = δ −ε ρ Δ (7)
Heat Transfer Mechanism
The heat required for coated paper drying is mainly generated by means of vertical impingement of fast jets of hot fluid on the paper surface. The mode of impingement of fluid on the paper surface is demonstrated in Figure 3.
S
D Td
c T j
T
j j
T ; V
ex T H
S
D Td
c T j
T
j j
T ; V
ex T H
D Td
c T j
T
j j
T ; V
ex T H
Figure 3: Mode of hot fluid impingement on the coated paper surface.
Tj, Tc, Td and Tex are the temperatures of the
m n
NU=C. Re . Pr (8)
All physical properties of the fluids are read at an effective average temperature:
(
)
f c j ex
1 1
T T T T
2 2
⎡ ⎤
= ⎢ + + ⎥
⎣ ⎦ (9)
where T is the paper surface temperature, which c varies according to fluid type. If hot air is used as the heating fluid, T will be the wet bulb temperature, c which is determined by the following equation and through trial and error:
j c s
j c i
y y C
T T
− = −
− λ (10)
When the fluid is superheated vapor, the temperature of the paper surface is the boiling water temperature at the pressure of the dryer chamber.
Since the pressure inside the dryer chamber is the same as the atmosphere, its temperature and the temperature of all metal plates inside the dryer must be kept above 100 °C in order to prevent vapor condensation on the paper surface (Figure 4).
' 1 q ' 3 q ' 2
q Td
c T ' 1 q ' 3 q ' 2
q Td
c T ' 1 q ' 3 q ' 2
q Td
c T
Figure 4: Radiation between paper and metal surfaces.
Defining the radiation power of a black body for material i using the Stefan-Boltzmann law and radiation properties, ρλ, ελ and τλ, which are the coefficients of reflection, absorption and transmission, each of the quantities q1′, q2′ andq3′ can be calculated as follows:
i
4
b i
8 2 4
E T
5.667 10 ...W / m .K− = σ
σ = × (11)
c, bc c, d, bd
' 1 d, c, E E q 1
λ λ λ
λ λ
ε +ρ ε
= −ρ ρ (12)
c, bd d, c, bc
' 2 d, c, E E q 1
λ λ λ
λ λ
ε + ρ ε
= −ρ ρ (13)
c, d, bd c, d, c, bc
' 3 d, c, E E q 1
λ λ λ λ λ
λ λ
τ ε + τ ρ ε
= −ρ ρ (14)
Heat absorbed by the surface is equal to (q2′-q1′ -3
q′).
Mass Transfer Mechanism
After the coating suspension is applied to the base paper, moisture will be transferred in two ways:
1) Dewatering: Movement of coated layer moisture into the base paper with transfer of the binding material.
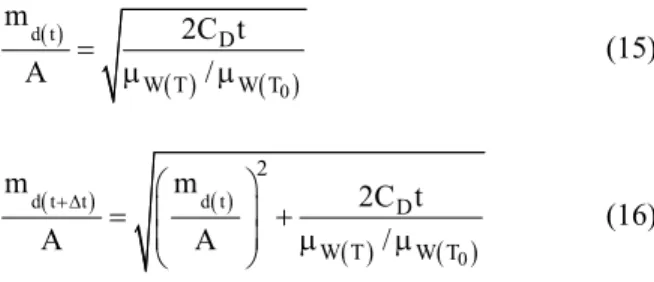
For modeling dewatering intensity, the Heikkilae equation is used, which was obtained by reconciling the Darcy, Lucas and Washburn equations:
( )
( ) ( )
d t
0
D
W T W T
m 2C t
A = μ /μ (15)
( ) ( )
( ) ( )
d t t d t
0
2
D
W T W T
m m 2C t
A A /
+Δ = ⎛⎜ ⎞⎟ +
⎜ ⎟ μ μ
⎝ ⎠
(16)
These two equations are valid until XC=XC,FCC, after which dewatering will not take place.
2) Evaporation: As coated paper passes through dryer, its surface temperature increases and will reach the evaporation temperature. As long as the paper surface is completely wet, evaporation proceeds similar to an open surface and the mass transfer coefficient are obtained using the Chilton-Calburn analogy (Kneule et al., 1975):
( )
.
y t v,
ev t
2/3
v P t t
c,t c,SCC
h P P
m P
ln
A R T C Le P P
X X ∞ − ⎡ ⎤ = ⎢ ⎥ −
ρ ⎣ ⎦
≥ (17a)
(
)
. ev
y V,C V,
m
h C P P
A ≅ − ∞ (17b)
When XC<XC,SCC, the evaporation front goes down into the coated layer. Vapor resulting from evaporation has to travel out of the dry layer in some way.
Mechanisms which are taken into account for vapor transfer to the solid-fluid interface include:
1) Molecular diffusion;
2) Laminar flow through the pores.
For each of the above-mentioned mechanisms, the following approximate equations may apply:
Molecular diffusion (Toei 1983; Masamune and Smith, 1962)
.
' ev
AB v,c v,c
v
m 1 1
D P P
A ≅ εψ RT yδ ⎡⎣ − ⎤⎦ (18)
A laminar flow exists for vapor bulk movement due to the small diameter of the pores, so:
. 2 L,t ' ev v,c v,c L,x v R m 1 P P
A 8 y
ρ εψ ⎡ ⎤
≅ μ δ ⎣ − ⎦ (19)
As a result, the following general equation is obtained:
(
)
(
)
. 2 ev t vv v L,x
'
v v,c v,c
m P R
x D 1 x
A R T. y 8
D P P
⎡ ⎤
εψ
≅ δ ⎢ η + − μ ⎥
⎢ ⎥
⎣ ⎦
− (20)
where x indicates the diffusion function for vapor transfer to the coated paper surface. If Equation (20) is simplified as follows:
(
)
.
' ev
G v,c v,c
m
K P P
A = − (21)
Then the overall intensity of mass transfer would be:
(
)
.
y G '
ev
v,c v,
y G
h C K m
P P
A h C K ∞
×
= + − (22)
where Pv,c' is the partial pressure of vapor at the evaporation level, which is less than the pure water
vapor pressure at a similar temperature, using Kelvin's equation:
' sat
v,i v Pv
P =P F (23)
The vapor pressure factor under the present conditions is assumed to be 0.25 for water (Gutoff 1999).
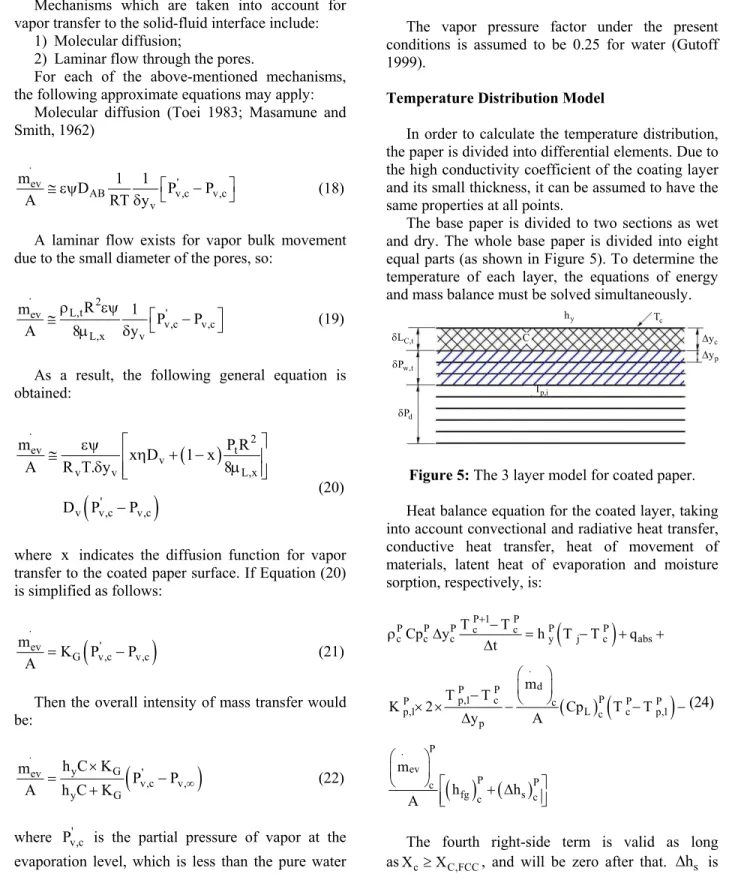
Temperature Distribution Model
In order to calculate the temperature distribution, the paper is divided into differential elements. Due to the high conductivity coefficient of the coating layer and its small thickness, it can be assumed to have the same properties at all points.
The base paper is divided to two sections as wet and dry. The whole base paper is divided into eight equal parts (as shown in Figure 5). To determine the temperature of each layer, the equations of energy and mass balance must be solved simultaneously.
C,t L δ w,t P δ d P δ c T y h c y Δ p,i T C p y Δ C,t L δ w,t P δ d P δ c T y h c y Δ p,i T C p y Δ
Figure 5: The 3 layer model for coated paper.
Heat balance equation for the coated layer, taking into account convectional and radiative heat transfer, conductive heat transfer, heat of movement of materials, latent heat of evaporation and moisture sorption, respectively, is:
(
)
( )
(
)
( )
( )
P 1 P
P P P c c P P
c c c y j c abs
d
P P
P
p,1 c
P c P P
p,1 L c c p,1
p
P
ev
P P
c
fg c s c
T T
Cp y h T T q
t
m
T T
K 2 Cp T T
y A m h h A + ⋅ ⋅ −
ρ Δ = − + +
Δ ⎛ ⎞ ⎜ ⎟ − ⎝ ⎠ × × − − − Δ ⎛ ⎞ ⎜ ⎟
⎝ ⎠ ⎡ + Δ ⎤
⎢ ⎥
⎣ ⎦
(24)
The fourth right-side term is valid as long
the latent heat of water sorption, the quantity of which depends on temperature and moisture content. Since the base paper has been covered with a metal plate in this model, mass transfer occurs only in the positive direction.
The heat balance equation for the internal layer (i) is:
( )
(
)
( )
(
)
( )
( )
P 1 P P P
p,i p,i p,i 1 p,i
P P P
p,i p,i p,i p,i 1
p
P P
p,i 1 p,i
P ' P
p,i 1 3 p,i
p
P
d
P
p,i 1 P P
p,i 1 p,i
p,i 1
P
d
P
p,i P P
p,i p,i 1
p,i P
ev
P P
p,i
fg p,i s p,i
T T T T
Cp y K
t y
T T
K q F
y
m
Cp T T
A
m
Cp T T
A m h h A + − − + + ⋅ − − − ⋅ + ⋅ − −
ρ Δ = +
Δ Δ − + × + Δ ⎛ ⎞ ⎜ ⎟ ⎝ ⎠ − + ⎛ ⎞ ⎜ ⎟ ⎝ ⎠ − − ⎛ ⎞ ⎜ ⎟
⎝ ⎠ ⎡ + Δ ⎤
⎢ ⎥
⎣ ⎦
(25)
The fourth, fifth and sixth right-side terms of the equation are valid if the moisture level does not reach to the interface of the base paper; otherwise, all these three terms become zero.
Moisture Distribution Model
The moisture balance equations are divided into two time intervals:
1) Xc,t ≥Xc,FCC
For the coated layer:
P P
. .
ev d
P 1 P
c c c c
m m
X X
CW
t A A
+ − ⎛⎜⎝ ⎞⎟⎠ ⎛⎜⎝ ⎞⎟⎠
= − −
Δ (26)
For the wetted layers:
P P
. .
d d
P 1 P
b,i b,i i 1 i
m m
X X
BW
t A A
+
−
⎛ ⎞ ⎛ ⎞
⎜ ⎟ ⎜ ⎟
− =⎝ ⎠ −⎝ ⎠
Δ (27)
But regarding the dry layers, there will be no change in the moisture content:
2) Xc,t <Xc,FCC
For the coated layer:
P . ev
P 1 P
c c c
m X X CW t A + − ⎛⎜⎝ ⎞⎟⎠ = −
Δ (28)
For the wetted layers:
P . ev
P 1 P
p,i b,i b,i m X X BW t A + − ⎛⎜⎝ ⎞⎟⎠ = −
Δ (29)
Porosity of the Coating
It is demonstrated practically that saucer-shape clay particles co-align during drainage and severely reduce the porosity coefficient (Sennete et al., 1968), but tiny binder particles will increase or decrease porosity depending on the fact that they can reside between pigment particles or fill vacant space surrounding those particles. Garey (Garey et al., 1975) reported that, in a clay-starch system, an increase of the binder concentration up to 5 pph slightly increased porosity, but at higher concentra-tions reduced the porosity. In research conducted by (Lepoutre et al., 1977) on a clay-latex system, it was found that a latex concentration up to 15 pph had a trivial effect on porosity but at higher concentrations it reduced the porosity.
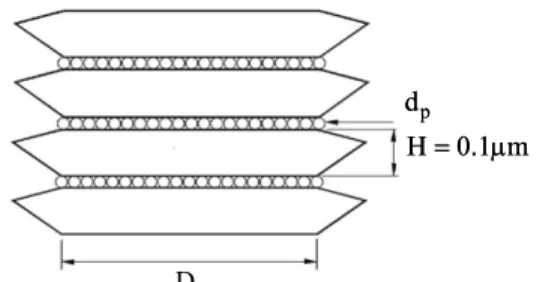
For approximate determination of the coated layer porosity, pigment particles are assumed to be hexagonal with an approximate diameter of 2-4 µm and a height of 1 µm and binding particles with an average diameter of 0.1 µm occupy the hollow spaces between them. Although other solid additives are present in these spaces, the following configura-tion gives a better answer (Figure 6).
D
p
d
H=0.1 mμ
D
p
d
H=0.1 mμ
p
d
H=0.1 mμ
Figure 6: Configuration of solid particles
Table 1: Coated layer porosity, XC,SCC and XC,FCC in terms of diameter.
C,SCC
X XC, FCC εc D ( m)μ
0.773
0.2925 0.305 4
0.8102
0.2342 0.26 2
0.8022
0.2465 0.27 1
SOLUTION OF THE EQUATIONS
Temperature and moisture distribution equations were defined for the different layers. Then the equations were solved through the Crank-Nicolson method. This method has appropriate stability. According to this method, when the temperature distribution is known at time (t), it can be obtained at t + ∆t by the following equations:
(
) ( )
i i i
T t+ Δ =t T t + ΔT (30)
i i
t t t
i
dT dT
dt dt
T t
2
+Δ
⎛ ⎞ ⎛+ ⎞
⎜ ⎟ ⎜ ⎟
⎝ ⎠ ⎝ ⎠
Δ = Δ (31)
Different quantities were examined within the 0.1-0.001 s range, and 0.01 s proved to be the appropriate period, confirmed by observing stability and alignment in the responses.
EXPERIMENTAL PROCEDURE
Experimental Setup
To validate the model, laboratory measurements were performed using a coater unit at McGill University lab, which was comparable to industrial units. This equipment allows impingement drying similar to industrial impingement air drying of coated paper, and a variable delay time after coating application, down to only 0.2 s. Other key features also include very rapid coating, only 0.01 s, and very fast drying; from 0.3-3.2 s. The schematic of the experimental setup is presented in Figure 7. The flow rate of air or superheated steam was measured with an orifice meter. The convection drying fluid impinges on the surface of a sheet clamped on a sheet holder. In the drying chamber, the pressure is atmospheric. Sheet insertion and retraction into and out of the drying chamber and drying time are controlled by computer.
Suspension Composition
Two suspensions with different compositions (Table 2) were used in order to assess the effect of solid type on the quality and drying rate of the coated paper.
Table 2: Suspension composition.
Suspension A Suspension B
Composition Component ComponentComposition
100 pph
Clay 100 Claypph
2 pph
Starch 10 Starch pph
0.8 pph
CMC 0.8 CMCpph
60
Solids% 60 Solids%
Coating Suspension Preparation
Binding material (suspending) was added to distilled water and the pH adjusted to 8. The suspen-sion was kept in a refrigerator overnight. Then CMC was added and the suspension agitated vigorously followed by latex (SB) addition. When the latex was added, the agitation was continued at a slow rate. At the end, by adding distilled water and sodium hy-droxide, the solids concentration was adjusted to 60% by weight at pH 8.
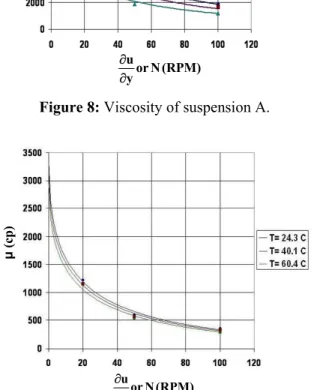
The viscosity of the coating suspensions was evaluated once per coating batch using a rotational viscometer (HAAKE Rotovisco) at different tem-peratures. The results are demonstrated in Figures 8 and 9.
Both suspensions A and B show shear thinning behavior, with the exception that the viscosity variation with temperature was greater in B.
Drying of Coated Paper
The coating formulation was changed only by using two different binders as shown. The minimum and maximum coating-drying delay time was used to determine the optimal effect of this parameter. The drying intensity, varied by controlling the drying air temperature in the range of 120-200 °C, was chosen to closely match the common industrial practices. The air jet velocity was kept constant at the average value of industrial practice of 40 m/s. The experimental study was conducted based on 6 combinations of these three parameters. For each combination of parameters, 6 to 12 drying times from 0.3 to 3.2 s were selected to obtain the complete drying history. For the preliminary experiments, 8 or 10 were chosen for each drying time, and this range of replicate experiment was confirmed to be reasonable and acceptable by subsequent error analysis. Thus, this plan gives a total number of 432 experiments.
μ
(c
p
)
u
or N (RPM) y
∂
∂
μ
(c
p
)
u
or N (RPM) y
∂
∂
Figure 8: Viscosity of suspension A.
u
or N (RPM) y
∂
∂
μ
(c
p
)
u
or N (RPM) y
∂
∂
μ
(c
p
)
Figure 9: Viscosity of suspension B.
This process was conducted at three temperatures, 120, 160 and 200 °C, and for both mixtures A and B, using two fluids, hot air and superheated vapor, with 0.2 and 0.4 s delay times and at 40 m/s speed. At the end of each test, the coated paper was kept inside an oven at 105 ºC for 24 hours and then weighted.
RESULTS AND DISCUSSION
drying fluid and the surface of the paper, so the drying is faster for a higher temperature drying fluid than for a low temperature one.
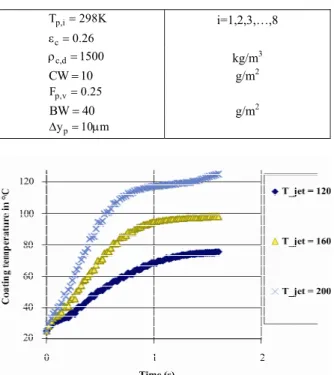
Table 3: Basic data for simulation.
p,i
T =298K i=1,2,3,…,8
c 0.26 ε =
c,d 1500
ρ = kg/m3
CW 10= g/m2
p,v
F =0.25
BW=40 g/m2
p
y 10 m Δ = μ
Figure 10: Coated layer temperature (drying fluid is air).
Figure 11: Average temperature of coated paper (drying fluid is air).
The moisture content in the coating layer and the total moisture content of the coated paper for drying with hot air are given in Figures 12, 13 and 14. Results show obvious reductions in the moisture content as well as sharp decreases in the drying rate with drying time, respectively. At time zero, there is a layer of coating suspension with 40% moisture on an almost completely dry base paper, gives an average coated paper moisture content of about 20%. At the end of drying, which is for this case 1.5 s, the
moisture content is reduced to about 2%. This indicates that drying time at this condition is very low. Similarly, the slope of the curve, representing the local drying rate, also decreases quite a lot with drying time, meaning that there is no constant drying rate period when coated paper is dried.
Figure 12: Moisture content of the coated layer against time.
Figure 13: Moisture content for the coated paper against time (drying fluid is air).
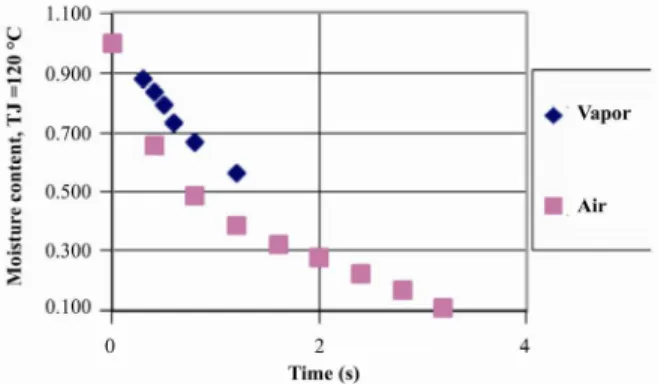
In Figure 15, the moisture contents of coated paper obtained by drying with hot air and superheated steam is compared. It is clearly shown that the drying rate (rate of decrease of the moisture content) with hot air at 120 ºC is higher than superheated steam because the effective temperature difference for heat convection is higher for air in this case. But if the drying fluid was increased, this difference decreases and, at higher temperatures, the drying rate with superheated steam can be greater.
In Figure 16, the moisture content of coated paper obtained from experimental measurements compared with the results of simulation. The difference between the relevant corresponding values is about 10%.
Figure 15: Moisture content for coated paper against time.
Figure 16: Moisture content for coated paper against time (drying fluid is air at 120 ºC).
Figure 17: Comparison between simulation results and experimental results.
Simulation results were in accordance with (Hashemi et al., 2003) and the difference between the experimental and simulation results is less than 10%, as shown in Figure 17. In their work, paper was formed as a stack of three plies. The local temperature profile across the sheet thickness was examined by inserting very fine thermocouples between the plies during sheet preparation.
CONCLUSION
A simulation model for coated paper drying was presented. In the model, paper was treated as three separate layers, properties of which could be
measured at each moment. Martin's method was
applied to obtain the heat convection coefficient. Radiation absorption was assumed to be exponential in the middle layers. In the stage of moisture disappearance from the surface and its penetration into the paper, the mass transfer mechanism was assumed to be a combination of molecular penetra-tion and laminar vapor flow. The simulapenetra-tion results matched well the experimental data.
The effects of changing the drying fluid, the delay time, and the composition of the coating mixture were also included in the model.
NOMENCLATURE
Cp Heat capacity J/kg.C
D coefficientdiffusion m2/s
t Time s
T Temperature °C
P Pressure Pa
R Universal gas constant J/kg.K
Nu Nusselt number
Re Reynolds number
Pr Prandtl number
Le Lewis number
X Moisture content, water/kg
dry solid
kg
m Mass flux kg water/ m2.s
h Convective Heat transfer
coefficient
W/m2.C
BW Grammage of base paper g/m2
CW Grammage of coated layer g/m2
K Heat Conductivity W/m.C
q Heat flux W/ m2
Greek Symbols
ε Porosity
λ Latent heat of evaporation J/kg
μ Viscosity kg/m.s
ψ Labyrinth factor
η Relative between two mass
coefficients
Subscripts
X Moisture content
T Time
C Coated layer
d Dry l Liquid v vapor
o Initial condition
J Jet condition
f Film condition
ex Exit condition
i layer i
REFERENCES
Alince, The effect of latex on flow behaviors and optical properties of pigment blends of clay and calcium carbonate. TAPPI, 70, No. 8, 95-99 (1987). Arpaci, V., Conduction Heat Transfer. Addison Wesley,
Reading (1966).
Engström, G. and Rigdahl, M., In-situ studies of water drainage from wet coating layers. TAPPI, 69, No. 1, 86-89 (1986).
Farkas, I., Lampinen, M. J., Ojala, K., Water flow and binder migration during drying of coated paper. Drying Technology, 9, 1019-1049 (1991). Garey, C., Leekley, R. and Hultman, J., Effect of
Mixed-Binder systems on the film volume and pore-size distribution of isolated clay coatings. TAPPI, 58, No. 5, 79-82 (1975).
Gutoff, E. B., Two-sided drying of coating on porous webs. Drying Technology, 17, 691-709 (1999). Hashemi, S. J., Roald, M., Murray Douglas, W. J.,
Mechanism of through air drying of paper application in hybrid drying. Drying Technology, 21, 349-368 (2003).
Heikkillae, P., A study on the drying process of pigment coated paper webs. Ph.D. Theses, ABO Academy, Finland (1992).
Kneule, F., Das Trocknen. Verlag Sauerländer AG, Aarau und Frankfurt/M. (1975). (In German). Lepourte, P. and Rezanowich, A., Optical properties
and structure of Clay-Latex coatings. TAPPI, 60, No. 11, 86-91 (1977).
Martin, H., Heat and Mass Transfer Between Impinging Gas Jets and Solid Surfaces. Advances in Heat Transfer, 13, Academic Press, New York (1977).
Masamune, S. and Smith, J., Pore diffusion in silver catalyst. AIChE Journal, 8, No. 2, 217-221 (1962). Pan, S. X., Davis, H. T. and Scriven, L. E., Modeling
moisture distribution and binder migration in drying paper coatings. TAPPI Journal, 78, No. 8, 127-143, MECE, 445-450 (1995).
Rajala, P. M. and Karlsson, M. A., A drying model for coated paper for improved printing properties. Proceedings of the ASME Heat Transfer Division, ASME HTD, 317, No. 2, 445-450 (1995).
Sennete, P., Drexel, R. and Morris, H., Appearance of anisometric pigment particles in paper coating. TAPPI, 51, No. 12, 567-569 (1968).
Toei, R., Drying mechanism of capillary porous bodies. In: Advances in Drying, vol. 2, Edited by: Mujumdar, A. S., Hemisphere Publishing, 269-297 (1983).