Adv. Sci. Res., 2, 99–105, 2008 www.adv-sci-res.net/2/99/2008/
©Author(s) 2008. This work is distributed under the Creative Commons Attribution 3.0 License.
Advances in
Science and
Research
EMS
Annual
Meeting
and
8th
Eur
opean
Confer
ence
on
Applications
of
Meteor
olo
gy
2007
Torrential rainfall in northeast of the Iberian Peninsula:
synoptic patterns and WeMO influence
J. Martin-Vide1, A. Sanchez-Lorenzo1, J. A. Lopez-Bustins1, M. J. Cordobilla1,2, A. Garcia-Manuel1, and J. M. Raso1
1Group of Climatology, University of Barcelona, Barcelona, Spain 2
Barcelona Regional, Barcelona, Spain
Received: 20 December 2007 – Revised: 7 April 2008 – Accepted: 24 April 2008 – Published: 4 June 2008
Abstract. This study presents a catalogue of synoptic patterns of torrential rainfall in northeast of the Iberian Peninsula (IP). These circulation patterns were obtained by applying a T-mode Principal Component Analysis (PCA) to a daily data grid (NCEP/NCAR reanalysis) at sea level pressure (SLP). The analysis made use of 304 days which recorded>100 mm in one or more stations in provinces of Barcelona, Girona and Tarragona (coastland area of Catalonia) throughout the 1950–2005 period. The catalogue comprises 7 circulation pat-terns showing a great variety of atmospheric conditions and seasonal or monthly distribution. Likewise, we computed the mean index value of the Western Mediterranean Oscillation index (WeMOi) for the synoptic pat-terns obtained by averaging all days grouped in each pattern. The results showed a clear association between the negative values of this teleconnection index and torrential rainfall in northeast of the IP. We therefore put forward the WeMO as an essential tool for forecasting heavy rainfall in northeast of Spain.
1 Introduction
Torrential rainfall constitutes the climatic, and even natural, risk which causes the highest number of victims in Catalo-nia. The biggest natural catastrophe in Spain during the XX century involved flooding, caused by torrential rainfall, on 25–26 September 1962, in the Vall`es Occidental region of Barcelona and the surrounding areas, with over 800 deaths and missing persons. The town of Rub´ı, with 5000 inhab-itants, lost 10% of its population in the catastrophe. Nu-merous studies analyze the climatic characteristics, and often the synoptic ones, of intense rainfall episodes in the region (Mart´ın Vide, 1994; Llasat, 1991; Mart´ın Vide and Llasat, 2000, among others), or the meteorological causes of some of these episodes (Tom´as Quevedo, 1963; Wheeler and Mart´ın Vide, 1988; Llasat and Rodr´ıguez, 1992; Ramis et al., 1994, 1997, among others).
The main climatic and meteorological characteristics of torrential rainfall in Catalonia can be summarized as fol-lows: 1) abundance of cases; 2) relative seasonality; 3) short duration or low level of persistence; 4) preferential spatial distribution on the litoral-prelitoral and in the Pyrenees; 5)
Correspondence to:J. Martin-Vide ([email protected])
common drought-torrential rainfall binomial; 6) high con-tribution to annual totals; 7) variety of synoptic situations; and 8) difficulty to forecast (Mart´ın Vide and Llasat, 2000; Mart´ın Vide, 2006). The aforementioned variety of synop-tic situations concurring in the origin of torrential rainfall in northeast of the Iberian Peninsula (IP) is somehow asso-ciated with its relationship with the Mediterranean climate, with the proximity to warm waters from the Mediterranean sea and with the orographic complexity of the territory. To date there has been no commonly used classification of the synoptic patterns associated with heavy rainfall in Mediter-ranean Spain, although different authors have identified po-tentially dangerous configurations that can give rise thereto, such as Levant advections with cold air at high tropospheric levels, upper-level depressions to the West or southwest of the region, the passing of a cold front from the West with a trough at 500 hPa, etc.
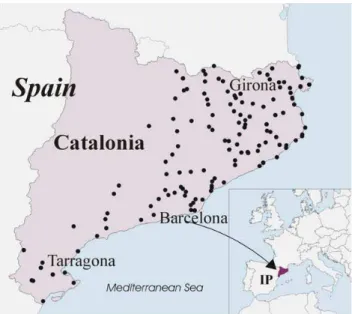
Figure 1.Map of location of the study area and of the points where torrential rainfall has been recorded.
these need to be “homologated” by contrasting their types with those recognized in subjective classifications. Although numerous methods have made use of objective or semi-automated techniques (Huth, 1996), the most currently used ones are those based upon multivariate statistics, such as the Principal Component Analysis and/or Cluster techniques (Esteban et al., 2006), which have been applied in the case of heavy rainfall on Spain’s Mediterranean fac¸ade (Romero et al., 1999), and upon automatic algorithms, such as the proce-dures used by Jenkinson and Collison, although the latter has certain limitations in the Mediterranean area (Martin-Vide, 2001).
2 Data and methodology
This study compiles the days of rainfall with an amount equal to or greater than 100 mm in any part of provinces of Barcelona, Girona and Tarragona, in the northeast of the IP (Fig. 1). The 100 mm in 24 h has been established as a thresh-old for identifying heavy rainfall events in Catalonia (Llasat, 2001), which are related to an increase in soil erosion pro-cesses (De Luis et al., 2003). To this end, we consulted different sources: the Spanish National Meteorology Insti-tute (INM), the Catalonia Meteorology Service (SMC), the Catalonia Water Agency (ACA) and other networks of ob-servation stations in Catalonia, as well as Barcelona’s Royal Academy of Sciences and Arts. The total series analysed are close to 300, i.e. 2 stations/100 km2. We detected and removed gross errors, and manually checked the spatial con-sistency of events date. The result is a list of 304 dates on which 100 mm of rainfall was reached or exceeded during the 1950–2005 period.
The values for atmospheric pressure at sea level were pro-vided by the NCEP-NCAR reanalysis (Kalnay et al., 1996), presenting a resolution of 2.5◦×
2.5◦
latitude and longitude. The domain selected for the classification of the synoptic pat-terns is that comprised between parallels 30◦
and 70◦
N, and between the meridians 30◦
W and 20◦
E. Thus, the number of grid points considered totals 357. Although similar arti-cles (Romero et al., 1999) opted for small windows focus-ing on the IP, in this paper we increased this scope havfocus-ing found that most patterns associated with torrential rainfall in northeast of the IP are linked to synoptic configurations in which the centers of action are located in relatively dis-tant sectors: the Atlantic ocean between 20◦
and 30◦
W, Cen-tral Europe between 10◦
and 20◦
E, due to the variability of the anticyclone on the central European plain (Martin-Vide and Lopez-Bustins, 2006), and between 50◦
and 60◦
N, due to the relationship between surface thermal anomalies in the North Atlantic and torrential rainfall episodes in the western Mediterranean (Quereda, 1989). Furthermore, although the influence of upper-levels configuration is decisive in the oc-currence of torrential rainfall episodes in the Mediterranean area, the principal ingredient for the development thereof is the input of humid winds, which is detected in the maritime isobar track (Azor´ın-Molina and Lopez-Bustins, 2004).
Table 1.Monthly distribution of the number of days with rainfall≥100 mm, according to the 7 selected synoptic patterns.
Patterns +1 +2 +3 +4 +5 -1 -2 All∗
January 2 8 2 2 0 5 0 19
February 4 7 1 0 0 2 0 14
March 3 1 6 1 1 2 1 15
April 1 1 4 2 1 0 3 12
May 2 1 2 6 1 0 0 13
June 10 1 3 2 0 0 2 18
July 3 1 1 4 0 0 1 10
August 10 3 2 1 0 0 1 17
September 26 10 4 3 2 0 0 50
October 16 31 7 3 3 2 0 65
November 9 7 6 1 8 3 1 37
December 6 6 6 2 3 6 4 34
Year 92 77 44 27 19 20 13 304
WeMOi∗∗ −
0.67 −1.51 −1.98 −0.48 −2.52 −2.41 −0.70 −1.33
∗
Includes the 12 unclassified days in the 7 patterns finally selected.
∗∗
Mean WeMOi values. Data available up to 2000, the period comprising 281 of the 304 days (92.4%).
3 Results
3.1 Temporal characteristics of days with rainfall equal to or greater than 100 mm in northeast of the Iberian Peninsula
Table 1 and Fig. 2 show that October is the month with the highest frequency of days with daily rainfall equal to or greater than 100 mm, a total of 65 days being recorded (21.4%). The month with the second largest amount of cases is September, with 50 days (16.4%), followed by the months of November and December, with 37 (12.2%) and 34 (11.2%) days, respectively. The remaining months present an absolute frequency of below 20, with a minimum frequency in July, with only 10 cases (3.3%).
Grouping according to seasons presents a clear maximum in autumn, with exactly half the cases (50.0%), followed by winter (22.1%). Spring and summer show similar percent-ages (13.1 and 14.8%, respectively). We should highlight the fact that over 20% of the cases occur in winter, a season that is traditionally considered to present little risk in Catalonia with regard to the occurrence of torrential rainfall, although it is true that the contribution of December plays a decisive role in the relatively high value. The average annual number of days with rainfall greater than or equal to 100 mm is 5.4.
3.2 Synoptic patterns associated with days presenting torrential rainfall in northeast of the Iberian Peninsula
3.2.1 Catalogue
We selected 6 components or EOFs that presented eigenval-ues higher than 10, and which account for 87.13% of total
Figure 2.Monthly relative frequencies of the days with daily rain-fall equal to or greater than 100 mm in northeast of the IP.
variance. There are 9 other components with eigenvalues higher than 1 (they account for more variance than the orig-inal variables), but these were discarded as they account for a low percentage of total variance and they do not provide any additional information. Likewise, prior to component 7, the Scree Test shows a jump, which confirms the suitabil-ity of retaining the first 6 components. Subsequent rotation redistributes the variance explained among the rotated com-ponents.
PC +1
PC +2
PC +3
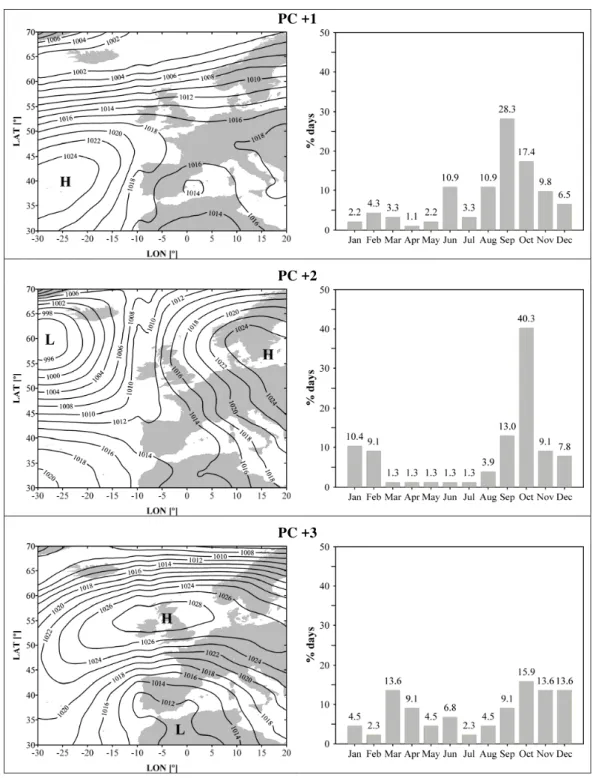
Figure 3.Synoptic patterns (left) and calendars (right) of the situations with torrential rainfall in northeast of the IP.
In order to obtain the average pattern of each of the classes, we calculated the arithmetic mean, cell by cell, of each of the days making up the class considered. For each one of the patterns, we then interpolated the average value of each cell (357) using thekrigingmethod. The final result is shown in Fig. 3.
PC +4
PC+5
PC -1
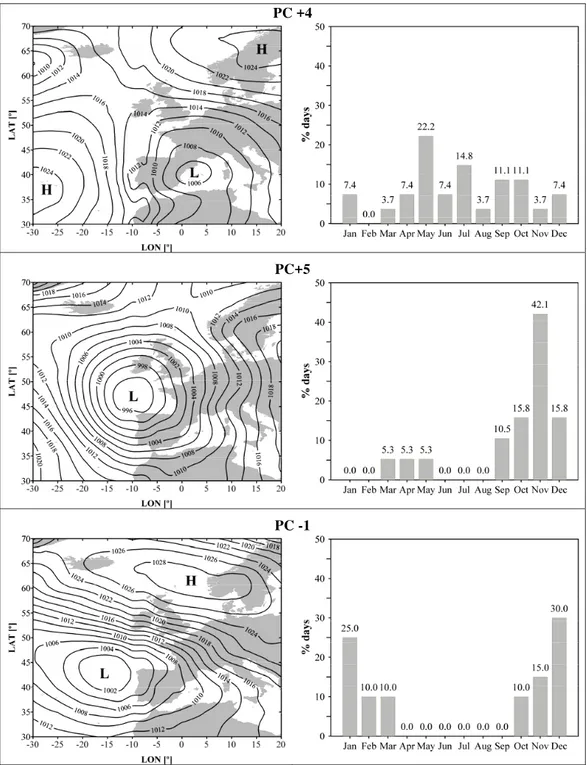
Figure 3.Continued.
The most noteworthy general synoptic features are: 1) pre-dominant surface flows from second quadrant in the broad sense, and therefore maritime ones, which is consistent with the great amount of water required by torrential rainfall; and 2) the existence of depressions or low-pressure areas close to or at West/northwest of the IP, or the presence of blocking configurations. Although autumn presents the highest fre-quency of dates in 4 of the patterns, the calendars can be
considered to be significantly varied, with notable difference in the autumn months presenting the maximum.
PC -2
Figure 3.Continued.
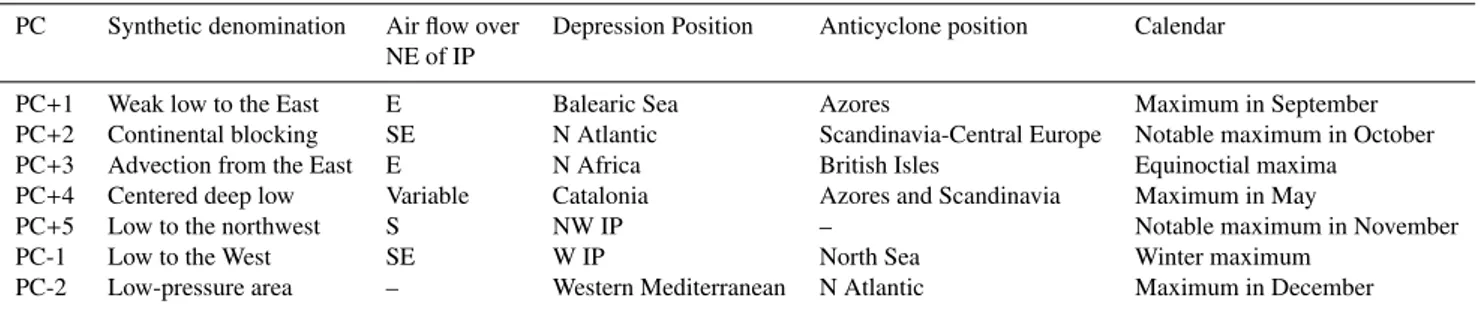
Table 2.Synoptic and temporal characteristics of the 7 most frequent patterns producing rainfall equal to or greater than 100 mm in northeast of the IP.
PC Synthetic denomination Air flow over Depression Position Anticyclone position Calendar
NE of IP
PC+1 Weak low to the East E Balearic Sea Azores Maximum in September
PC+2 Continental blocking SE N Atlantic Scandinavia-Central Europe Notable maximum in October
PC+3 Advection from the East E N Africa British Isles Equinoctial maxima
PC+4 Centered deep low Variable Catalonia Azores and Scandinavia Maximum in May
PC+5 Low to the northwest S NW IP – Notable maximum in November
PC-1 Low to the West SE W IP North Sea Winter maximum
PC-2 Low-pressure area – Western Mediterranean N Atlantic Maximum in December
which is often associated with isolated depressions at mid or high tropospheric levels (cut-off low, “gota fr´ıa” or DANA in Spanish) at IP latitudes (Llasat, 1991). The September, 1962 extreme event has been included in this pattern. Like-wise, the “advection from the East” pattern is associated with a situation of diffluent blocking, with a broad calendar of oc-currence.
The “centered deep low”, albeit not the most represented situation, contains quite a high number of cases. The “low to the northwest” pattern obtained appears to be identical to the situation that led to serious flooding in November, 1982 in the Catalonian Pyrenees, with surface flows between the S and the SE, and intense circulation from the SW at high levels. Finally, the “low to the West” pattern has certain links to the previous one.
3.2.2 Synoptic patterns of torrential rainfall and the WeMO index
The synoptic patterns of the catalogue are representative of the negative phase of the WeMO, a pattern of low-frequency variability (Martin-Vide and Lopez-Bustins, 2006) defined as
an alternative to the NAO for explaining the pluviometic be-havior on the East coast of the IP. Indeed, the average value of the WeMO index of the dates with rainfall>100 mm for the 1950–2000 period is clearly negative,−1.33 (Table 1). The number of days with torrential rainfall with a positive index is less than 15% and just less than 5% occurred with an in-dex higher than+1. It can be said that in a day with a WeMO index higher than+2 it is practically impossible to exceed 100 mm in 24 h in coastland of Catalonia. Finally, the aver-age values of the WeMO index of the dates with torrential rainfall classified in each of the 7 patterns are negative (Ta-ble 1). Indeed, the Western Mediterranean Oscillation Index (WeMOi), which correlates satisfactorily with rainfall on the East coast of the IP, reaches its absolute minimum in October (Martin-Vide and Lopez-Bustins, 2006).
4 Conclusions and future work
the final four-month period of the year, which confirms the preference of torrential rainfall in the region for autumn and for the month of December.
Using a Principal Component Analysis of surface pres-sure, extracted from the NCEP-NCAR reanalysis, of the aforementioned 304 dates for the grid made up of the 357 points of the 30◦
N–70◦
N and 30◦
W–20◦
E domain, we con-structed a catalogue of synoptic patterns with 7 types, which highlights the variety of synoptic situations producing tor-rential rainfall in northeast of the IP.
The most noteworthy synoptic characteristics of the 7 pat-terns (Table 3) are the predominance of surface flows of the second quadrant, maritime ones, and the existence of depres-sions or low-pressure areas close to or at West/northwest of the IP, or the presence of blocking configurations. Moreover, there is a notable predominance of negative WeMOi values in all the patterns and on all the dates considered.
In the future, the torrential rainfall database will be further improved and an attempt will be made to homogenize the resulting time series. The latter will enable us to test an anal-ysis of the tendencies of the frequency of intense rainfall, a theme of particular interest in the context of current an-thropic climate change. Other aspects to be developed in the future are: study of the spatial distribution of torrential rain-fall associated with the different synoptic patterns detected; consideration of other levels, aside from surface level, in the classification proposal; and synoptic analysis of the whole Mediterranean fac¸ade of the IP.
Acknowledgements. We wish to thank the NCEP-NCAR reanalysis project, for providing the surface pressure data. The data for the 1959-2005 period were provided by the Climatic Research Unit (CRU), whereas those for the previous years were the courtesy of Ian Harris. Our thanks to the Spanish National Meteorology Institute, Catalonia Meteorology Service, Catalonia Water Agency and to the Barcelona’s Royal Academy of Sciences and Arts for the pluviometry data. This research project is framed within the RIMARC network (CGL2004-21663-E), the IPIBEX project (CGL2005-07664-C02-01), the COST-733 Action, of the Institut de l’Aigua (UB) and in the Acci´on Integrada (Integrated Action) CGL2004-21441-E of the Spanish Committee of the WCRP, to which the first co-author belongs.
Edited by: F. Stel and D. B. Giaiotti Reviewed by: two anonymous referees
References
Azor´ın-Molina, C. and L´opez-Bustins, J. A.: Cat´alogo sin´optico manual y causas atmosf´ericas de la precipitaci´on en la provincia de Alicante, Bolet´ın de la AGE, 38, 279–310, 2004.
De Luis, M., Gonz´alez-Hidalgo, J. C., and Ravent´os, J.: Effects of
fire and torrential rainfall on erosion in a Mediterranean gorse community, Land Degrad. Dev., 14, 203–213, 2003.
Esteban, P., Martin-Vide, J., and Mases, M.: Daily atmospheric cir-culation catalogue for western Europe using multivariate tech-niques, Int. J. Climatol., 26, 1501–1515, 2006.
Huth, R.: An intercomparison of computer-assisted circulation clas-sification methods, Int. J. Climatol., 16, 893–992, 1996. Huth, R.: A circulation classification scheme applicable in GCM
studies, Theor. Appl. Climatol., 67, 1–18, 2000.
Kalnay, E., Kanamitsu, M., Kistler, R., Collins, W., Deaven, D., Gandin, L., Iredell, M., Saha, S., White, G., Woollen, J., Zhu, Y., Chelliah, M., Ebisuzaki, W., Higgins, W., Janowiak, J., Mo, K. C., Ropelewski, C., Wang, J., Leetma, A., Reynolds, R., Jeene,
R., and Joseph, D.: NCEP/NCAR 40-year reanalysis project, B.
Am. Meteorol. Soc., 77, 437–471, 1996.
Llasat, M. C.: Gota fr´ıa, Marcombo, Barcelona, 165 pp., 1991. Llasat, M. C.: An objective classification of rainfall events on the
basis of their convective features: application to rainfall intensity in the northeast of Spain, Int. J. Climatol., 21, 1385–1400, 2001. Llasat, M. C. and Rodr´ıguez, R.: Extreme rainfall events in Catalo-nia: the case of 12 November 1988, Nat. Hazards, 5, 133–151, 1992.
Lopez-Bustins, J. A., Martin-Vide, J., and Sanchez-Lorenzo, A.: “Iberia winter rainfall trends based upon changes in tele-connection and circulation patterns, Global Planet. Change,
doi:10.1016/j.gloplacha.2007.09.002, 2008.
Mart´ın Vide, J.: Geographical Factors in the Pluviometry of
Mediterranean Spain: Drought and Torrential Rainfall, in: U.S.-Spain Workshop on Natural Hazards, 9–25, The University of Iowa, Iowa Institute of Hydraulic Research, 1994.
Martin-Vide, J.: Limitations of an objective weather-typing system for the Iberian Peninsula, Weather, 56, 7, 248–250, 2001. Mart´ın Vide, J.: Valores pluviom´etricos extremos en la fachada
mediterr´anea espa˜nola, in: Chastagnaret y Gil Olcina, Riesgo de inundaciones en el Mediterr´aneo occidental, Madrid, Casa de Vel´azquez y Universidad de Alicante, 2006.
Mart´ın Vide, J. and Llasat, M. C.: Las precipitaciones torrenciales en Catalu˜na, Serie Geogr´afica, 9, 17–26, 2000.
Martin-Vide, J. and Lopez-Bustins, J. A.: The Western Mediter-ranean Oscillation and rainfall in the Iberian Peninsula, Int. J. Climatol., 26, 1455–1475, 2006.
Quereda, J.: La ciclog´enesis y las gotas fr´ıas del Mediterr´aneo Oc-cidental, Diputaci´o de Castell´o, 135 pp., 1989.
Ramis, C., Llasat, M. C., Genov´es, A., and Jans`a, A.: The October-87 Floods in Catalonia. Synoptic and Mesoscale Mechanisms, Meteorol. Appl., 1, 337–350, 1994.
Ramis, C., Ar´us, J., L´opez, L., and Mestre, A.: Two cases of severe weather in Catalonia (Spain). An observational study, Meteorol. Appl., 4, 207–217, 1997.
Richman, M. B.: Rotation of principal components, J. Climatol., 6, 293–335, 1986.
Romero, R., Sumner, G., Ramis, C., and Genov´es, A.: A classifica-tion of the atmospheric circulaclassifica-tion patterns producing significant daily rainfall in the Spanish Mediterranean area, Int. J. Climatol., 19, 765–785, 1999.
Tom´as Quevedo, A.: Causas meteorol´ogicas de las inundaciones del bajo Vall´es, Llano de Llobregat y el Maresme, Estudios Ge-ogr´aficos, 91, 137–146, 1963.