www.atmos-chem-phys.net/9/7361/2009/ © Author(s) 2009. This work is distributed under the Creative Commons Attribution 3.0 License.
Chemistry
and Physics
Latitudinal variation in the multiphase chemical processing of
inorganic halogens and related species over the eastern North and
South Atlantic Oceans
W. C. Keene1, M. S. Long1, A. A. P. Pszenny2,3,*, R. Sander4, J. R. Maben1, A. J. Wall3,**, T. L. O’Halloran1,***, A. Kerkweg4,****, E. V. Fischer3,*****, and O. Schrems5
1Department of Environmental Sciences, University of Virginia, Charlottesville, VA 22904, USA
2Institute for the Study of Earth, Oceans, and Space, University of New Hampshire, Durham, NH, 03824, USA 3Mount Washington Observatory, North Conway, NH, 03860, USA
4Air Chemistry Department, Max-Planck Institute of Chemistry, 55020 Mainz, Germany 5Alfred Wegener Institute for Polar and Marine Research, 27515 Bremerhaven, Germany
*now at: Atmospheric Chemistry Program, National Science Foundation, Arlington, VA, 22230, USA **now at: Department of Geosciences, Pennsylvania State University, University Park, PA, 16802, USA ***now at: Department of Forest Ecosystems and Society, Oregon State University, Corvallis, OR, 97330, USA ****now at: Institute for Atmospheric Physics, University of Mainz, 55020 Mainz, Germany
*****now at: Department of Atmospheric Sciences, University of Washington, Seattle, WA 98195, USA
Received: 30 March 2009 – Published in Atmos. Chem. Phys. Discuss.: 14 May 2009 Revised: 4 September 2009 – Accepted: 9 September 2009 – Published: 2 October 2009
Abstract. Volatile inorganic and size-resolved particulate Cl- and Br-species were measured in near-surface air over a broad range of conditions within four distinct regimes (Eu-ropean – EURO, North African – N-AFR, the Intertropical Convergence Zone – ITCZ, and South Atlantic – S-ATL) along a latitudinal gradient from 51◦N to 18◦S through the eastern Atlantic Ocean. Median dry-deposition fluxes of sea salt, oxidized N, and oxidized non-sea-salt S var-ied by factors of 25, 17, and 9, respectively, among the regimes. Sea-salt production was the primary source for in-organic Cl and Br. Acidification and dechlorination of sea salt primarily by HNO3 sustained HCl mixing ratios
rang-ing from medians of 82 (ITCZ) to 682 (EURO) pmol mol−1. Median aerosol pHs inferred from HCl phase partitioning with super-µm size fractions ranged from ∼3.0 for EURO to ∼4.5 for ITCZ. Because SO2 solubility over this pH
range was low, S(IV) oxidation by hypohalous acids was unimportant under most conditions. Simulations with a de-tailed multiphase box model indicated that BrCl photoly-sis and ClO + NO were the major sources for atomic Cl in all regimes. Simulated midday concentrations of Cl atoms
Correspondence to:W. C. Keene
ranged from 2.1×10⁴to 7.8×104cm−3in the ITCZ and
N-AFR regimes, respectively. Measured particulate Br− (me-dian enrichment factor = 0.25) was greater and volatile in-organic Br less than simulated values, suggesting that the halogen activation mechanism in the model overestimated Br-radical production and processing. Reaction with atomic Br was an important sink for modeled O3(5% in EURO to
46% in N-AFR). Formation of halogen nitrates accelerated the oxidation of NOx(NO + NO2) primarily via hydrolysis
reactions involving S aerosol. Relative to simulations with no halogens, lower NOxcoupled with direct reactions
involv-ing halogens yielded lower steady state mixinvolv-ing ratios of OH (20% to 54%) and O3(22% to 62%) and lower midday ratios
of OH:HO2(3% to 32%) in all regimes.
1 Introduction
halogens significantly modifies conventional HOx/NOx
pho-tochemistry over Arctic and Antarctic sea ice (Foster et al., 2001; Simpson et al., 2007), salt flats (Matveev et al., 2001), coastal cities (Finley and Saltzman, 2006; Osthoff et al, 2008), polluted coastal regions (Pszenny et al., 2007; Pechtl and von Glasow, 2007), and coastal-marine macroalgal beds (Alicke et al., 1999). Modeling studies and observations sug-gest that transformations involving reactive halogens in the marine boundary layer (MBL) over the open ocean are po-tentially of much greater global significance in terms of the processing and lifetimes of climatically important gases (e.g., von Glasow et al., 2002a, b; Read et al., 2008; Lawler et al., 2009).
The primary source of reactive inorganic Cl and Br in ma-rine air is the production of sea-salt aerosols by waves break-ing at the sea surface (Keene et al., 1999; Sander et al., 2003; respectively) whereas the major sources of reactive I include emission of biogenic iodocarbons from the ocean surface and, in coastal regions, from exposed macroalgae at low tide (Carpenter, 2003); direct emissions of I2 from macroalgae
(Saiz-Lopez and Plane, 2004) and from the surface micro-layer of the ocean (Martino et al., 2009) may also be impor-tant. The multiphase photochemical processing of marine-derived halogens influences oxidation capacity through an interrelated set of reactions including catalytic O3
destruc-tion (Dickerson et al., 1999; Nagao et al., 1999; Galbally et al., 2000; Read et al., 2008); net O3production in polluted
regions (Tanaka et al., 2003; Osthoff et al., 2008); oxida-tion of CH4(Platt et al., 2004), non-methane hydrocarbons
(NMHCs; Wingenter et al., 1996; Pszenny et al., 2007), and (CH3)2S (Toumi, 1994; Keene et al., 1996; Saiz-Lopez et
al., 2004) in the gas phase; oxidation of S(IV) in aerosol so-lutions (Vogt et al., 1996); and modification of HOx(Stutz et
al., 1999; Bloss et al., 2005) and NOxcycles (Sander et al.,
1999; Pszenny et al., 2004). The associated production of soluble reaction products contributes to aerosol growth. Re-actions involving iodine oxides have also been linked to sig-nificant nucleation of new particles in some coastal regions (e.g., O’Dowd et al., 2002) but not in others (Russell et al., 2007). The potential importance of these pathways over the open ocean is unknown. Finally, the phase partitioning of HCl regulates the pH of marine aerosol solutions and impor-tant associated pH-dependent pathways including halogen activation and S(IV) oxidation (Keene et al., 1998; 2004). Despite the potential importance of reactive halogen chem-istry, comprehensive multiphase observations over a broad range of tropospheric conditions, and particularly over the open ocean, are scarce thereby constraining our ability to re-liably predict associated influences on O3cycling, oxidation
processes, aerosol evolution, and radiative transfer region-ally and globregion-ally. This limitation motivated the investigation reported herein.
2 Methods
2.1 Cruise track and shipboard sampling
During an October and November 2003 cruise of the Ger-man research shipPolarsternfrom Bremerhaven, Germany to Cape Town, South Africa (designated cruise number ANT XXI/1), a suite of reactive trace gases, size-resolved and bulk aerosol composition, and related meteorological con-ditions was measured in near-surface air over the eastern Atlantic Ocean along a latitudinal transect from 51.4◦N to 17.8◦S (Fig. 1). Air was sampled from the top of a walk-up aluminum scaffold mounted above the navigation bridge approximately 5 m port of the ship’s center line (schemat-ics of the ship are available on the web at http://www.awi. de/en/infrastructure/ships/polarstern/; also see supplemen-tary material, Fig. S1, http://www.atmos-chem-phys.net/9/ 7361/2009/acp-9-7361-2009-supplement.pdf). Inlets were positioned approximately 23 m above the water line. All sampling was suspended during two large, multi-day storm events (from 43.4◦N to 32.8◦N and from 17.8◦S to the end of the cruise) during which strong winds, bow spray, and/or heavy rain precluded contamination-free sampling. Aerosol sampling was also suspended intermittently during periods of scattered precipitation.
2.2 Measurements 2.2.1 Reactive trace gases
Water-soluble, volatile inorganic chlorine and oxidized ni-trogen (dominated by and hereafter referred to as HCl and HNO3, respectively), NH3, HCOOH, and CH3COOH
Fig. 1.Five-day HYSPLIT back trajectories initiated at 500-m ele-vation along the cruise track. Start times correspond to the midpoint of each aerosol and filter-pack sampling interval. Trajectories for the EURO regime are plotted in black, N-AFR in red, ITCZ in light blue, and S-ATL in green.
averaged±10% to ±25%. Average detection limits (DLs; estimated following Keene et al. (1989) for both mist cham-ber and aerosol samples) for HCl, HNO3, NH3, HCOOH,
and CH3COOH were 23, 2, 19, 13, and 19 pmol mol−1,
re-spectively.
Inorganic Cl gases were sampled in parallel through an identical inlet with two sets of similar tandem mist chamber samplers (Keene et al., 1993; Maben et al., 1995; Pszenny et al., 2004; Keene et al., 2007a). One sampler was con-figured with an upstream chamber containing acidic solu-tion [37.5 mM H2SO4and 0.042 mM (NH4)2SO4], which
re-moved HCl quantitatively but efficiently passed other forms of volatile Cl, and a downstream chamber containing alka-line solution [30.0 mM NaHCO3and 0.408 mM NaHSO3],
which sampled Cl* (including Cl2, HOCl, and probably
con-tributions from ClNO3, ClNO2, BrCl, ClO, and Cl). The
other sampler was configured with tandem chambers, both of which contained alkaline solution to sample total volatile inorganic Cl (Clt). Available evidence (Keene et al., 1993;
Maben et al., 1995) indicates that this sampling technique reliably discriminates volatile inorganic Cl from Cl associ-ated with both particles and organic gases and that it quantita-tively differentiates between HCl and other forms of volatile inorganic Cl. However, the speciation of Cl* cannot be
deter-mined unequivocally. Mist solutions were analyzed on site by IC. The average relative precision for both Cl* and Clt
was approximately±15% or±12 pmol Cl mol−1, whichever was the greater absolute value, and the corresponding aver-age DL for both analytes was 24 pmol Cl mol−1.
Total volatile inorganic Br (Brt) and SO2 were sampled
at a nominal rate of 80 L min−1 over discrete daytime and nighttime periods using a filterpack technique (Pszenny et al., 2004). An open-face, three-stage, 47-mm-diameter, polycarbonate filterpack housing was loaded with a quartz-fiber (Pallflex 2500 QAT-UP) particle filter followed by tan-dem rayon filters (Schleicher and Schuell, 8 S) impregnated with a solution of 10% K2CO3 and 10% glycerol
(Bard-well et al., 1990). Based on independent analysis of the tandem filters, both analytes were sampled at 98% effi-ciency. Filterpacks were cleaned, dried, loaded, and un-loaded in a class 100 clean bench configured with impreg-nated filters on the inlet to remove alkaline- and acidic-reactive trace gases. Exposed filters were transferred to polypropylene tubes, stored in glass jars, frozen, and express shipped from Cape Town to Mount Washington Observatory (MWO) where they were analyzed by IC. The average pre-cision for Brtwas±5% or±0.05 pmol Br mol−1, whichever
was the greater absolute value, and the corresponding DL was 0.10 pmol Br mol−1. The average precision for SO
2was ±8% or±0.5 pmol mol−1, whichever was greater, and the
corresponding DL was 1.0 pmol mol−1. 2.2.2 Aerosols
Ambient aerosols were sampled over discrete daytime and nighttime intervals using a modified Graseby-Anderson Model 235 cascade impactor configured with a Liu-Pui type inlet, precleaned polycarbonate substrates, and quartz-fiber backup filters (Pallflex 2500 QAT-UP) (Pszenny et al., 2004; Keene et al., 2007a). At an average sampling rate of 0.78 m3min−1, the average 50% aerodynamic cut
diameters for the impaction stages were 20, 11, 4.3, 2.5, 1.2, and 0.65µm yielding average geometric mean diame-ters (GMDs) for the size-resolved samples of 29, 15, 7.0, 3.3, 1.8, 0.89, and 0.46µm. Bulk aerosol was sampled in parallel on quartz-fiber filters at an average flow rate of 1.1 m3min−1. Impactors and bulk-filter cassettes were cleaned, dried, loaded, and unloaded in a Class 100 clean bench configured as described above. Exposed substrates and filters were halved, transferred to polypropylene tubes, sealed in glass mason jars, frozen, and express shipped from Cape Town to MWO for analysis.
Half sections of each substrate were extracted in 13 ml deionized water using a mini vortexer and sonication; half sections of exposed backup and bulk filters were similarly extracted in 40 ml deionized water. Substrate and filter ex-tracts were analyzed by IC for total (ionized + undissociated) Cl−, Br−, SO24−, CH3SO−3, HCOO−, CH3COO−, C2O24−,
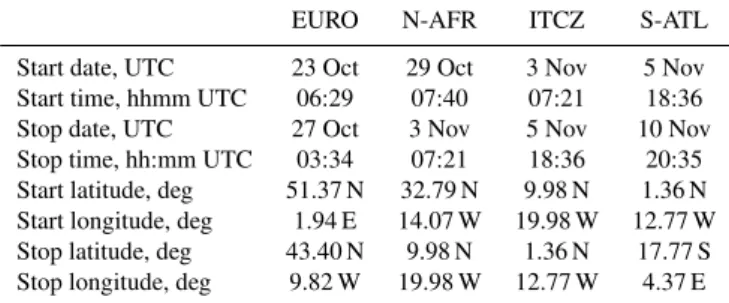
Table 1.Start and stop dates, times, and positions for the four trans-port regimes.
EURO N-AFR ITCZ S-ATL
Start date, UTC 23 Oct 29 Oct 3 Nov 5 Nov Start time, hhmm UTC 06:29 07:40 07:21 18:36 Stop date, UTC 27 Oct 3 Nov 5 Nov 10 Nov Stop time, hh:mm UTC 03:34 07:21 18:36 20:35 Start latitude, deg 51.37 N 32.79 N 9.98 N 1.36 N Start longitude, deg 1.94 E 14.07 W 19.98 W 12.77 W Stop latitude, deg 43.40 N 9.98 N 1.36 N 17.77 S Stop longitude, deg 9.82 W 19.98 W 12.77 W 4.37 E
The corresponding average DLs for bulk samples were 0.8, 0.002, 0.1, 0.02, 0.4, 0.1, 0.006, 0.04, 1.1, 2.6, 0.6, and 0.2 nmol m−3, respectively; those for the GMD 0.46-µm size fraction were 1.0, 0.002, 0.2, 0.03, 0.6, 0.2, 0.009, 0.05, 0.5, 3.5, 0.8, 0.3 nmol m−3, respectively; and those for the larger
individual size fractions were 0.09, 0.001, 0.01, 0.007, 0.07, 0.09, 0.006, 0.01, 0.001, 0.1, 0.06, and 0.01 nmol m−3, re-spectively.
Internal losses of super-µm aerosols within slotted cas-cade impactors of this type average about 25% to 30% (e.g. Willeke et al., 1975); other sources of bias for size-resolved particulate analytes based on the above procedures are gener-ally unimportant (Keene et al., 1990). Sea-salt and non-sea-salt (nss) constituents were differentiated using Na+as the reference species (Keene et al., 1986). Departures from sea-salt composition are reported as both absolute deficits and enrichment factors (EFs) relative to sea salt (e.g., Sander et al., 2003). Reported concentrations of total particulate Br−, Na+, and nss SO24− are based on aerosol sampled in bulk. Because they are not conservative in bulk samples, reported concentrations of total particulate Cl−, NO−3, and NH+4 are based on values summed over all size fractions sampled with the cascade impactor.
2.2.3 Meteorological conditions and ancillary data Air and sea-surface temperature, relative humidity (RH), pressure, and wind speed and direction were measured con-tinuously with instruments maintained by the ship’s crew and compiled as one-minute averages (posted at http://dship.awi. de/polarstern/index.htm). Temperature and RH were periodi-cally measured in parallel with a sling psychrometer operated adjacent to the inlets for our samplers; results were statisti-cally indistinguishable from those reported by the ship. O3
and CO were measured continuously by the University of York and compiled as 10-min averages (L. Carpenter, Uni-versity of York, unpublished data, 2008). MBL depth was estimated from 1) profiles of virtual potential temperature de-rived from rawinsondes launched from the ship at 12:00 UTC on most days and at other times on some days, 2) the lowest
cloud base measured by a ceilometer operated by the ship’s crew, and 3) either the first significant drop in back scatter or the lowest cloud layer detected with a lidar operated during the cruise (Immler and Schrems, 2006).
2.3 Atmospheric transport
Large-scale atmospheric transport was evaluated using both HYbrid Single-Particle Lagrangian Integrated Trajectories (HYSPLIT, Fig. 1) (Draxler et al., 2005) and Lagrangian particle dispersion (FLEXPART) retroplumes (Stohl et al., 2005). Trajectories were initialized at 500 and 1000 m above the sea surface. Samples were classified into four major transport regimes (described in more detail below) based on visual inspection of the back trajectories, the correspond-ing column and footprint residence time components of the retroplumes, and local meteorology (Fischer et al., 2006). Samples collected at transitions between regimes were as-signed to the regime that corresponded to the greater fraction of sampling time. The regimes are broadly characterized as European influenced (hereafter referred to as EURO), North African influenced (N-AFR), the inter-tropical convergence zone (ITCZ), and South-Atlantic influenced (S-ATL). Start and stop dates, times, and positions for each regime are listed in Table 1.
2.4 Calculations
Aerosol pH was inferred based on the measured phase par-titioning and associated thermodynamic properties (Henry’s Law and dissociation constants) of HCl, meteorological conditions (RH and temperature), and hygroscopicity mod-els of aerosol liquid water content (LWC) (Keene et al., 2004). Dry-deposition fluxes of size-resolved particulate-phase species to the surface ocean were calculated based on the measured chemical composition and GMD for each size fraction, wind velocity, air temperature, and RH following Hummelshøj et al. (1992). The laminar sublayer was as-sumed to be at 98% RH (Lewis and Schwartz, 2004) and the corresponding GMD for each size fraction within the sublayer was based on the measured ionic composition and hygroscopicity models (the same as those used to estimate aerosol LWC in the overlying air; see above). At steady state in the absence of precipitation, dry-deposition fluxes of sea-salt aerosol are balanced by the corresponding emission fluxes. Emission fluxes of particulate Cl− and Br−
associ-ated with sea-salt aerosol were inferred from the calculassoci-ated dry-deposition fluxes of sea-salt Na+ and the correspond-ing concentration ratios in surface seawater (Keene et al., 2007a). Dry-deposition fluxes of HCl, Brt, HNO3, NH3,
and SO2to the surface ocean were calculated based on the
does not limit corresponding dry-deposition fluxes. We also assume no vertical gradients in particulate- and gas-phase species between the reference height for these approaches (10 m) and the measurement height. As described in de-tail below, the dry-deposition fluxes of size-resolved aerosols and soluble gases calculated from measurements based on the above approaches were used to parameterize turnover rates for aerosols and exogenous source strengths for N and S gases in the model.
2.5 Photochemical-box-model simulations
Multiphase chemical processes involving inorganic halogens within each of the four major transport regimes were simu-lated with the photochemical box model MECCA (Model Ef-ficiently Calculating Chemistry of the Atmosphere) using the Rosenbrock 3 positive-definite solver (Sander et al., 2005; Sandu and Sander, 2006). The principal goal of this compo-nent of the analysis was to evaluate our current understanding of the underlying processes as described in the model based on the degree of consistency between measured and simu-lated characteristics of the system. MECCA contains a com-prehensive atmospheric reaction mechanism that includes transformations involving: 1) O3, CH4, HOx, and NOx; 2)
non-methane hydrocarbons (NMHCs); 3) halogens (Cl, Br, I); and 4) sulfur. Because iodine and NMHC species were not measured during the cruise, their reactions were switched off for these simulations. In addition to gas-phase reactions, the scheme includes fully integrated multiphase transformations involving both aqueous-phase and heterogeneous pathways. Unlike previous versions of MECCA which considered only two aerosol size bins, a recent model version (Sander et al., 2009) was used in this study to simulate multiple aerosol size bins. Mass transfer is calculated dynamically and does not assume Henry’s Law equilibrium conditions (see sup-plementary material, Table S1 for a complete description of the chemical scheme, http://www.atmos-chem-phys.net/9/ 7361/2009/acp-9-7361-2009-supplement.pdf). Photochem-ical reaction rates vary as a function of solar zenith angle under clear-sky conditions. For each simulation, the model was parameterized and initialized based on median values for measurements associated with the corresponding trans-port regime (Table 2). To minimize sources of variabil-ity among results for different regimes, the MBL depth for each simulation was set to the median value for the en-tire cruise (Table 2). For species that were not measured, reasonable initial conditions were assumed. In all simula-tions, we assumed a constant O3 entrainment flux from the
free troposphere of 5×10¹⁰molecules cm−2s−1(Thompson and Zafiriou, 1983). Mixing ratios of CH4were held
con-stant (i.e., exogenous sources were assumed equal to internal sinks).
The model was initialized with externally mixed popula-tions of unreacted sea salt and pre-existing nss S aerosols. The number (N = 7) and sizes of sea-salt bins in the model
(Table 2) corresponded to the size fractions sampled by the impactor. A single additional bin (diameter = 0.18µm) con-tained all preexisting nss S. The liquid water content, salinity, and lifetime against dry deposition for each aerosol size bin were calculated off-line. Dry-deposition velocities for gas-phase species were also calculated off-line. Size-resolved emission fluxes of sea salt for each regime were set equal to the corresponding median values for size-resolved dry-deposition fluxes thereby maintaining constant concentra-tions and size distribuconcentra-tions of conservative particulate-phase constituents during each simulation. At each time step, re-acted aerosol was removed from, and an equivalent amount of fresh aerosol was added to, each bin in proportion to the corresponding lifetime of aerosol within that bin.
Vertical profiles of sea salt within the MBL vary as a func-tion of particle size and, thus, the atmospheric lifetimes of sea-salt aerosol within each size bin varied as a function of the corresponding vertical mixing potential (e.g., Lewis and Schwartz, 2004). Consequently, the height to which par-ticles are mixed must be considered explicitly to properly parameterize turnover rates of size-resolved aerosols within the 0-D domain. For each regime, the steady-state vertical profiles of size-resolved sea salt mass within each size bin were estimated assuming neutrally stable conditions based on a power-law relationship (Lewis and Schwartz, 2004) parameterized for the corresponding median meteorologi-cal conditions and size-resolved concentrations measured at 23 m (Table 2). Coefficients were calculated to scale near-surface measurements of size-resolved aerosols to mean con-centrations over the vertical profiles (Table 2). The liq-uid water content of each size bin at 23 m was multiplied by the corresponding scaling coefficient to yield a column-averaged value. The atmospheric lifetime against dry de-position for each bin was then calculated directly (column-averaged value/dry-deposition rate). The atmospheric life-time of the size bin containing preexisting nss SO24− was assumed equal to that of the smallest sea-salt size bin. We note that, relative to predictions based on theoretical consid-erations (Lewis and Schwartz, 2004), the limited available measurements of vertical profiles in bulk sea-salt mass (Blan-chard et al., 1984; Maring et al., 2003) indicate substantially greater vertical gradients within the MBL. If these measured profiles are generally representative of conditions within the MBL along the cruise track, turnover rates for sea salt and associated reaction products in the model calculations were underestimated.
At each time step, a mixture of HNO3 and NO2 was
added to the system at a combined rate equal to the corre-sponding median loss rate of oxidized N (HNO3+ particulate
NO−3, hereafter referred to as total NO3) via dry deposition
(calculated from measurements as described in Sect. 2.4). Although the total exogenous source flux of oxidized N was reasonably well constrained by the corresponding dry-deposition fluxes, the relative amounts of HNO3to NOx in
Table 2.Model parameterization and initialization. Unless otherwise noted, the model was parameterized and initialized based on median values for measured and calculated results from the cruise.
Parameter Units EURO N-AFR ITCZ S-ATL
Date dd-mmm-yy 25-Oct-03 31-Oct-03 4-Nov-03 8-Nov-03
Latitude Degrees 48 N 21 N 6 N 9 S
Temperature ◦C 11.4 23.2 27.0 22.5
RH % 56.1 67.6 78.4 77.3
Wind Velocity m s−1 7.3 8.5 3.5 8.1
MBL Heighta m 912 912 912 912
Aerosol size binsb
Bin 1 Na+at 23 m nmol m−3 30.4 74.0 4.4 6.8
Bin 2 Na+at 23 m nmol m−3 45.8 132.0 7.0 12.4
Bin 3 Na+at 23 m nmol m−3 44.3 106.0 16.1 27.9
Bin 4 Na+at 23 m nmol m−3 12.7 42.9 11.3 21.9
Bin 5 Na+at 23 m nmol m−3 10.9 29.7 7.7 17.0
Bin 6 Na+at 23 m nmol m−3 3.5 9.3 1.9 4.5
Bin 7 Na+at 23 m nmol m−3 1.4 3.2 1.8 1.3
Bin 8 nss SO24−at 23 m nmol m−3 15.1 13.4 8.4 9.6
Bin 1 Vertical Scaling Coeff.c 0.46 0.52 0.19 0.50
Bin 2 Vertical Scaling Coeff.c 0.79 0.82 0.61 0.81
Bin 3 Vertical Scaling Coeff.c 0.93 0.94 0.88 0.94
Bin 4 Vertical Scaling Coeff.c 0.97 0.97 0.95 0.97
Bin 5 Vertical Scaling Coeff.c 0.97 0.97 0.97 0.97
Bin 6 Vertical Scaling Coeff.c 0.97 0.97 0.97 0.97
Bin 7 Vertical Scaling Coeff.c 0.98 0.98 0.97 0.97
Bin 8 Vertical Scaling Coeff.c 1.00 1.00 1.00 1.00
Bin 1 Dry-Deposition Velocity cm s−1 6.1 E+000 5.7 E+000 5.9 E+000 5.2 E+000 Bin 2 Dry-Deposition Velocity cm s−1 2.0 E+000 2.1 E+000 1.4 E+000 2.0 E+000 Bin 3 Dry-Deposition Velocity cm s−1 1.1 E+000 1.3 E+000 5.2 E−001 1.2 E+000 Bin 4 Dry-Deposition Velocity cm s−1 8.9 E−001 1.1 E+000 3.2 E−001 1.0 E+000 Bin 5 Dry-Deposition Velocity cm s−1 8.0 E−001 1.0 E+000 5.5 E−002 9.7 E−001 Bin 6 Dry-Deposition Velocity cm s−1 1.7 E−001 5.7 E−001 1.9 E−002 4.1 E−001 Bin 7 Dry-Deposition Velocity cm s−1 1.6 E−002 2.0 E−002 1.2 E−002 1.8 E−002 Bin 8 Dry-Deposition Velocity cm s−1 1.6 E−002 2.0 E−002 1.2 E−002 1.8 E−002 Gas Dry-Deposition Velocity cm s−1 1.1 E+000 1.1 E+000 6.8 E−001 1.0 E+000 Inputs from Exogenous Sources
O3 molec cm−2s−1 5.0 E+010 5.0 E+010 5.0 E+010 5.0 E+010
NO2 molec cm−2s−1 1.7 E+010 3.0 E+009 1.0 E+009 1.6 E+009
HNO3 molec cm−2s−1 1.7 E+010 1.5 E+010 1.0 E+009 6.5 E+009
(CH3)2S+SO2 molec cm−2s−1 8.5 E+009 6.5 E+009 2.0 E+009 2.4 E+009
NH3 molec cm−2s−1 6.3 E+009 1.5 E+009 3.0 E+009 1.6 E+009
Initial Conditionsd
NOe2 mol mol−1 2.0 E−011 2.0 E−011 2.0 E−011 2.0 E−011
CHe4,f mol mol−1 1.8 E−006 1.8 E−006 1.8 E−006 1.8 E−006
HCHOe mol mol−1 3.0 E−010 3.0 E−010 3.0 E−010 3.0 E−010
CO mol mol−1 1.4 E−007 1.1 E−007 9.9 E−008 7.7 E−008
(CH3)2Se mol mol−1 6.0 E−011 6.0 E−011 6.0 E−011 6.0 E−011
H2Oe2 mol mol−1 6.0 E−010 6.0 E−010 6.0 E−010 6.0 E−010
CH3OHe mol mol−1 3.0 E−010 3.0 E−010 3.0 E−010 3.0 E−010
aThe actual median MBL depths for EURO, N-AFR, ITCZ, and S-AFR regimes were 1224, 951, 658, and 873 m, respectively (see Sect. 2.5). bThe ambient geometric mean diameters for aerosol size bins 1 through 8 were 28.8, 15.2, 7.08, 3.32, 1.75, 0.89, 0.46, and 0.18µm, respectively. cBased on Lewis and Schwartz (2004) (see text).
dHCl, HNO
3, SO2, NH3, and O3for each regime were initialized based on the median measured mixing ratios (Table 3). eAssumed value.
to variability in the relative importance of distinct and poorly characterized processes. NOx and HNO3 within the MBL
have relatively short lifetimes (less than one to two days) against oxidation and deposition, respectively, and, conse-quently, the importance of transport within the MBL as a source for oxidized N from continental sources decreases rapidly with distance from coasts (e.g., Neuman et al., 2006). Potentially important sources for oxidized N in the more re-mote open-ocean MBL along the cruise track include entrain-ment of a time-varying mixture of combustion-and lightning-derived HNO3and NOxfrom the free troposphere (Neuman
et al., 2006, Shepon et al., 2007), direct emissions of NO from ships at sea (Corbett et al., 1999), transport and ther-mal decomposition of NOxreservoir species such as
peroxy-acetyl nitrate (PAN; Jacobi et al., 1999), and chemical degra-dation of alkyl nitrates emitted from the surface ocean (Dahl et al., 2005). Because spatial variability in the speciation and relative importance of different sources along the cruise track could not be evaluated explicitly, the model was param-eterized by adjusting the HNO3:NO2ratio in the oxidized N
source term for each regime such that corresponding simu-lated steady-state mixing ratios of NOx in the model runs
that included transformations involving halogens fell within the range of available measurements in the eastern Atlantic MBL (e.g., Carsey et al., 1997; Leser et al., 2003; Lawler et al., 2009; Lee et al., 2009). Resulting HNO3:NO2ratios
in the source terms for the EURO (1:1), N-AFR (5:1), ITCZ (1:1), and S-ATL (4:1) regimes yielded steady-state mixing ratios of NOxaveraging 171, 31, 8, and 20 pmol mol−1,
re-spectively. The implications of this parameterization scheme are discussed below.
(CH3)2S emissions were based on the WCRP/IGAC
emis-sions inventory (Roelofs, et al., 1998). SO2 was added
at rates such that SO2+ (CH3)2S inputs equaled the
corre-sponding median losses of total nss S (SO2+ nss SO24−) via
dry deposition for each regime. For the ITCZ, the calcu-lated median dry-deposition flux of total nss S was less than the corresponding (CH3)2S emissions predicted by the
in-ventory. For this regime, the source term was set equal to the inventory prediction (i.e., the flux of SO2from other
exoge-nous sources was assumed to be zero). NH3was added to the
system at rates equal to the corresponding median losses of total reduced N (NH3+ particulate NH+4) via dry deposition
for each regime. Inputs of N and S from exogenous sources for each regime are summarized in Table 2. The above ap-proach sustained essentially constant steady-state concentra-tions of total reactive N and S during each simulation.
Our analysis focused primarily on two sets of conditions that were simulated for each of the four regimes. One set (hereafter referred to as “with halogens”) included the full suite of transformations involving inorganic Cl and Br species. For the other set (hereafter referred to as “no halo-gens”), each regime was parameterized and initialized with the same conditions employed for the corresponding “with halogens” run but all transformations involving halogens
were switched off (i.e., Cl−and Br−associated with nascent
marine aerosols were chemically inert). To achieve steady state conditions for each simulation, the model was run over a period of 110 days preceding the end point of the correspond-ing observation period within that flow regime. Results from the last several days of each simulation were interpreted. In addition to the primary simulations described above, the model was run over ranges of conditions to evaluate the sen-sitivity of results to (1) the approach employed to vertically scale size-resolve aerosols and (2) variability in the ratio of HNO3to NO2in the source term. Results of these runs are
briefly discussed where appropriate below. The simulations provide useful insight concerning the underlying processes. As discussed in more detail below, however, some impor-tant aspects of the MBL system (including entrainment rates, the sources and photochemical ages of oxidized N, and mix-ing ratios of halogen radicals and precursors in ambient air) were poorly constrained by observation. In addition, current models do not reproduce some measured characteristics of the multiphase system, which suggests that they are missing some important processes. Finally, these box model calcu-lations do not consider physicochemical dynamics driven by transformations involving iodine compounds, vertical mix-ing, non-steady-state conditions, or cloud processing. Con-sequently, the simulated results may not be representative of ambient conditions in some respects.
3 Results and discussion
3.1 Atmospheric-transport regimes
The EURO regime was associated with northwesterly flow that had recently (less than one day prior to sampling) passed over Western Europe (Fig. 1), variable near-surface wind velocities (median = 7.3 m s−1), and relatively low tempera-tures (median = 11.4◦C) and RHs (median = 56.1%) (Fig. 2). The N-AFR regime was characterized by more northerly transport with a long (several day) fetch over the eastern North Atlantic Ocean before passing near or over west-ern North Africa prior to sampling, the highest median wind velocity (8.5 m s−1), and increasing temperatures
(me-dian = 23.2◦C) and RHs (median = 67.6%). The transition
from the Northern to Southern Hemisphere through the ITCZ was characterized by shifting air flow from northerly to southerly, low wind velocities (median = 3.5 m s−1), widely scattered showers, and relatively high temperatures (me-dian = 27.0◦C) and RHs (median = 78.4%). The S-ATL regime was characterized by persistent southeasterly flow with long fetch over the eastern South Atlantic Ocean roughly parallel to the coast of southern Africa, moderate wind velocities (median = 8.1 m s−1), and decreasing temper-atures (median = 22.5◦C) and RHs (median = 77.3%).
R H , % 50 60 70 80 90 T em p , o C ; W in d V el , m s ec -1 0 5 10 15 20 25 30 Temp Wind vel RH N a +, n m o l m -3 0 200 400 600 E F 0.0 0.2 0.4 0.6 0.8 1.0
EF(Br-)
EF(Cl -) Na+ H C l; C l
- d
ef ic it , p m o l m o l -1 0 200 400 600 800 1000 1200 1400 C l* , p m o l m o l -1 0 100 200 300 400 HCl Cl def (day)
Cl- def (night)
Cl
def (24 hr) Cl* p m o l m o l -1 0 5 10 15 20 25 30
Brt (day)
Brt (night)
Brt (24 hr)
Br
def (day)
Br
def (night)
Br
def (24 hr)
p m o l m o l -1 0 200 400 600 800 HNO3 NO3 (day) NO3 (night) NO3 (24 hr) p m o l m o l -1 0 200 400 600
800 SO2 (day)
SO2 (night)
SO2 (24 hr)
nss SO4
(day)
nss SO4
(night)
nss SO4
(24 hr) Latitude N -15 -10 -5 0 5 10 15 20 25 30 35 40 45 50 p H 0 1 2 3 4
5 GMD 7.1 µm
GMD 0.46 µm
a b c d e f g EURO Storm N-AFR ITCZ S-ATL
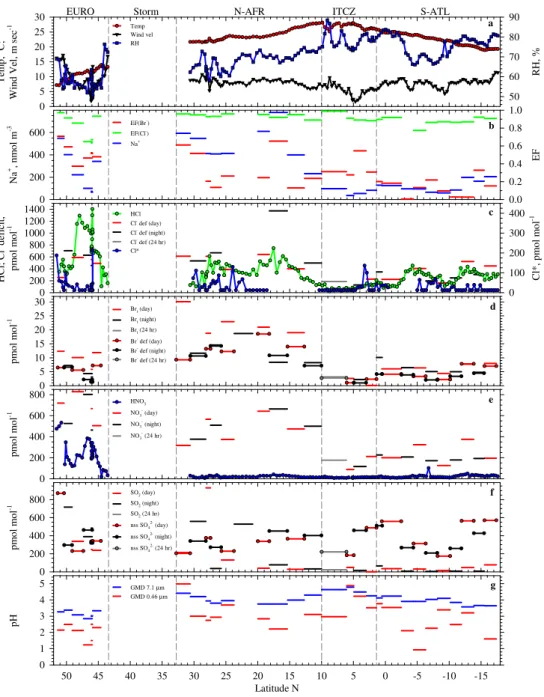
Fig. 2.Latitudinal variability in measured and directly calculated characteristics of near-surface air including(a)temperature, RH, and wind velocity averaged over each mist-chamber sampling interval;(b)particulate Na+, EF(Cl−), and EF(Br−);(c)HCl, Cl*, and particulate Cl− deficit;(d)Brt and particulate Br−deficit;(e)HNO3and particulate NO−3;(f)SO2and particulate nss SO24−; and(g)pH of GMD 7.1-µm and GMD 0.46-µm aerosol size fractions inferred from the measured HCl phase partitioning. In panel f, SO2during the first sampling interval (2277 pmol mol−1) is off scale. Values below DLs are plotted as 0.5*DLs. Vertical dashed lines partition major transport regimes.
varied substantially both within and among transport regimes as functions of upwind emissions of precursors, length and duration of fetch over the ocean, associated meteorological drivers (primarily wind velocity and RH), and chemical pro-cessing. In the following sections we evaluate the relative influences of these factors on the cycling of inorganic halo-gens and related species for each regime.
3.2 European influenced 3.2.1 Measured characteristics
The relatively high concentrations of HNO3, particulate
NO−3, and SO2 (Figs. 2e, f, 3n, Table 3) measured in
the EURO regime reflect NO and SO2 emissions from
N a +, n m o l m -3 0 40 80 120 160 C l -, n m o l m -3 0 50 100 150 E F ( C l -) 0.1 1 B r -, n m o l m -3 0.00 0.05 0.10 0.15 0.20 n ss S O4 2 -, n m o l m -3 0 5 10 15 20 N O3 -, n m o l m -3 0 2 4 6 8 10 E F ( B r -) 0.01 0.1 1 10
GMD, µm
1 10 p H 2.0 2.5 3.0 3.5 4.0 4.5 N a + , n m o l m -3 0 40 80 120 160 EURO N-AFR ITCZ S-ATL C l
- , n
m o l m -3 0 50 100 150 E F ( C l - ) 0.1 1 B r
- , n
m o l m -3 0.00 0.05 0.10 0.15 0.20 E F ( B r - ) 0.01 0.1 1 10 N O3 - , n m o l m -3 0 2 4 6 8 10 n ss S O4 2 - , n m o l m -3 0 5 10 15 20
GMD, µm
1 10 p H 2.0 2.5 3.0 3.5 4.0 4.5 a b c d e f g h i j k l m n o p
Fig. 3.Left: Box and whisker plots depicting measured and directly calculated particle size distributions (90th, 75th, 50th, 25th, and 10th percentiles) based on all data for(a)Na+,(b)Cl−,(c)EF(Cl-),(d)Br−,(e)EF(Br−),(f)NO−3,(g)nss SO24−, and(h)aerosol pH inferred from the measured HCl phase partitioning. Right: Corresponding median size distributions of(i)Na+,(j)Cl−,(k)EF(Cl−),(l)Br−,(m) EF(Br−),(n)NO−3,(o)nss SO24−, and(p)aerosol pH for each transport regime.
concentrations within this regime varied by a factor of 10 (Fig. 2b) in response to the combined influences of variable wind velocity (Fig. 2a), sea state, and fetch (Fig. 1). The acidification of sea-salt aerosol and associated displacement of HCl resulted in the highest HCl mixing ratios (Figs. 2c, 4a, Table 3), lowest EF(Cl−)s (Fig. 2b, Table 3), and low-est aerosol pHs inferred from measurements (Figs. 2g, 3p) during the cruise. HCl concentrations were generally greater than the corresponding deficits relative to sea salt (Fig. 2c), which assuming that sea-salt Cl− was the primary
precur-sor for HCl (addressed below), indicates that HCl had longer
atmospheric lifetimes against deposition than the parent aerosol. All size fractions were significantly dechlorinated; median EF(Cl−) decreased with decreasing size (Fig. 3k).
Median size distributions of Na+, NO−3, nss SO24−, and pH (Fig. 3i, n, o, and p, respectively), indicate that HNO3
Table 3.Median values and ranges (in parentheses) for measured characteristics in each regime.
Analyte Units EURO N-AFR ITCZ S-ATL
HCl pmol mol−1 682 (106–1404) 348 (91–746) 82 (<23–207) 267 (81–453) Cl* pmol mol−1 27 (<24–213) <24 (<24–129) <24 (<24–136) <24 (<24–67) Brt pmol mol−1 7.2 (3.1–12.3) 18.8 (8.2–30.1) 2.4 (<0.1–3.1) 6.2 (4.4–10.1)
HNO3 pmol mol−1 210 (17–532) 19 (5–40) 12 (6–40) 21 (8–101)
SO2 pmol mol−1 289 (238–2276) 104 (28–930) 19 (<1–48) 23 (5–77)
O3 nmol mol−1 35 (5.4–47) 38 (20–45) 22 (12–35) 23 (14–35)
Na+a nmol m−3 221 (67–548) 413 (232–779) 69 (36–97) 111 (60–205)
Cl−b nmol m−3 156 (42–395) 404 (180–703) 62 (30–77) 91 (49–197)
EF(Cl−)b 0.86 (0.63–0.97) 0.94 (0.89–0.96) 0.90 (0.88–0.99) 0.87 (0.77–0.93) Br−a nmol m−3 0.15 (0.06–0.70) 0.20 (0.09–0.92) 0.05 (0.02–0.05) 0.02 (<0.01–0.10) EF(Br−)a 0.51 (0.37–0.71) 0.25 (0.13–0.55) 0.31 (0.28–0.55) 0.14 (<0.01–0.33) NO−3b nmol m−3 30.0 (20.8–37.3) 22.5 (14.2–29.9) 6.6 (3.9–9.5) 8.9 (5.7–16.8) nss SO24−a nmol m−3 15.1 (10.3–39.2) 15.3 (9.2–20.3) 15.3 (8.2–22.0) 16.6 (7.8–25.6)
aBased on aerosol sampled in bulk.bBased on summed concentrations for aerosol size fractions sampled with cascade impactor.
n
m
o
l
m
-3
0 100 200 300 400 500
Sea-salt Cl- Measured Cl -HCl
Regime
EURO N-AFR ITCZ S-ATL
n
m
o
l
m
-3
0.0 0.2 0.4 0.6
0.8 Sea-salt Br
-Measured Br -Brt
a
b
Fig. 4. Median measured concentrations of(a)ss Cl−, measured Cl−, and HCl,(b)ss Br−, measured Br−, and Brtfor each regime.
over the eastern North Atlantic Ocean (e.g., Huebert et al., 1996) and elsewhere. Low concentrations of nss SO24− com-pared to NO−3 in super-µm size fractions (Fig. 3n, o) indi-cate that H2SO4was a relatively minor source of acidity for
super-µm marine aerosols. Due in part to the rapid turnover of super-µm aerosol and associated NO−3, the median dry-deposition flux of total NO3 was approximately four times
greater than that of total nss S (Fig. 5).
µ
m
o
l
m
-2 d
ay
-1
0 10 20 30 40 50
Regime
EURO N-AFR ITCZ S-ATL
µ
m
o
l
m
-2 d
ay
-1
0 2 4 6 8 10 12
a
b
NO3 -HNO3
nss SO4 2-SO2
Fig. 5. Median dry-deposition fluxes of(a)HNO3and particulate NO−3, and(b)SO2and particulate nss SO24−for each regime cal-culated from measurements as described in Sect. 2.4.
Bulk aerosol was significantly depleted in Br−relative to
seawater (Fig. 2b, Table 3) but the smallest size fraction was highly enriched (Fig. 3l, m). The enrichment of Br−in sub-µm aerosol in marine regions has been widely reported (e.g., Sander et al., 2003) but the major cause is not understood. Nascent marine aerosols are not enriched in Br when ini-tially injected into the atmosphere from the ocean surface (Keene et al., 2007b) and, as detailed below, model calcula-tions based on the halogen activation mechanism (e.g., Vogt et al., 1996) do not predict the significant retention of Br− in sea-salt aerosol or the accumulation of Br− in sub-µm aerosol size fractions. These results suggest the possibility that significant concentrations of Br associated with marine aerosol in the EURO region (and elsewhere) may be present as relatively unreactive, perhaps organic compounds that ei-ther originate from non-marine sources or are produced by chemical pathways not considered in current models. How-ever, the median estimated emission fluxes of sea-salt Br− (and Cl−) were approximately balanced by the correspond-ing dry-deposition fluxes of total Br (Brtand particulate Br−)
(and total Cl, HCl + particulate Cl−, Fig. 6), which suggests that the production of sea salt was the primary source for inorganic Br and Cl in this regime. Similar relationships were observed in polluted air along the northeastern US coast (Keene et al., 2007a). In addition, available evidence indi-cates that the analytical technique used here (ion chromatog-raphy) is specific for Br− and it is unlikely that simple di-lution during extraction or exposure to eluent sodi-lutions or separator column resins would convert bromine sequestered in the chemical lattice of relatively inert compounds to Br−.
Regardless of speciation, the net effect of retaining and/or accumulating significant marine-derived Br−in the particu-late phase would be to slow production rates of Br-radical precursors and to modify the importance of different path-ways in the cycle relative to those predicated by current mod-els. For example, as EF(Br−) decreases, the importance of HOBr + Cl−+ H+→BrCl + H2O and subsequent
transfor-mations increases relative to HOBr + Br−+ H+→Br2+ H2O
(e.g., Vogt et al., 1996; Fickert et al., 1999). Consequently, the nature of this characteristic of the system must be re-solved in order to develop a reliable predictive capability for Br-radical chemistry and the associated influences on the evolution of marine air.
Brt was present at higher concentrations than the
corre-sponding particulate-Br−deficit relative to sea salt (Figs. 2d,
7b), which assuming that sea salt was the primary source for total Br, indicates that Brthad a longer atmospheric lifetime
than the parent aerosol. In addition, Brtvaried systematically
over diel cycles with daytime mixing ratios approximately two times greater than those at night (Fig. 2d). In contrast, the corresponding Br−deficits in bulk aerosol exhibited rel-atively less day-night variability (Fig. 2d).
ss
C
l
- P
roduc
ti
on,
μ
mo
l m
-2 day
-1
0 200 400 600 800 1000
a
Cl
De
posi
ti
on,
μ
mo
l m
-2 day
-1
0 200 400 600 800 1000 c
Regime
EUR
O
N-AFR ITCZ S-ATL
ss Br
- P
rod
ucti
on,
μ
mo
l m
-2 day
-1
0.0 0.4 0.8 1.2
1.6 b
EUR
O
N-AFR ITCZ S-ATL
Br
D
eposi
ti
on,
μ
mo
l m
-2 day
-1
0.0 0.4 0.8 1.2 1.6 d
Figure 6.
Cl-HCl
Br-Brt
Fig. 6.Median emission fluxes of(a)sea-salt Cl−and(b)sea-salt Br−inferred from dry-deposition fluxes of particulate Na+versus median dry-deposition fluxes of(c)HCl and particulate Cl−, and (d)Brt and particulate Br−for each regime calculated from
mea-surements as described in Sect. 2.4.
3.2.2 Simulated characteristics
The simulated steady-state mixing ratios of NOx in the
EURO regime for the “with halogens” run averaged 171 pmol mol−1over diel cycles (Fig. 8, Table 4). The cor-responding simulated NO2(163 pmol mol−1) was within the
broad range of daily averages for NO2measured in this
re-gion by Leser et al. (2003) (∼20 to 1160 pmol mol−1). Sim-ulated size distributions of particulate NO−3, nss SO24−, and Cl−for the “with halogen” run (Fig. 9) were similar to those based on median values for the measured near-surface con-centrations (Fig. 3n, o, j, respectively). The simulated mixing ratios of HNO3 (495 to 575 pmol mol−1, not shown)
over-lapped the upper limit for mixing ratios measured within this regime (Fig. 2e, Table 3). Simulated SO2 (456 to
501 pmol mol−1, not shown) fell within the upper range of
observations (Fig. 2f, Table 3) and simulated HCl (Fig. 8, 251 to 293 pmol mol−1) was less than most observations (Fig. 2c, Table 3). The differences between simulated and observed HNO3and HCl both in this and other regimes resulted in part
from the scaling approach employed to parameterize average aerosol concentrations and turnover rates for the simulations. The relatively lower HNO3and higher HCl measured in
near-surface air reflect local phase partitioning with the greater near-surface aerosol volumes whereas the simulated results correspond to column-averaged conditions.
Table 4.Simulated characteristics of each flow regime.
EUROa N-AFRa ITCZa S-ATLa
Cl* (24-h mean), pmol mol−1 78 19 26 14
HOCl (daytime max.), pmol mol−1 51 11 21 8.8
ClNO3(daytime max.), pmol mol−1 21 1.8 2.2 0.9 Cl2(nighttime, max.), pmol mol−1 36 2.8 5.3 2.0 BrCl (nighttime, max.), pmol mol−1 15 16 7.0 10 ClNO2(nighttime, max), pmol mol−1 4.6 0.06 0.01 0.01 Cl-atom conc. (daytime max.), cm−3 4.3×10⁴ 7.8×10⁴ 2.1×10⁴ 4.1×10⁴ Primary Sources for atomic Clb
ClO + NO, % 36 24 16 22
BrCl photolysis, % 25 66 62 64
Cl2photolysis, % 24 3 7 1
HOCl photolysis, % 12 6 15 11
ClNO2photolysis, % 0.4 0.01 <0.01 <0.01
Brt(24-h mean), pmol mol−1 15 37 8.3 23
BrNO3(daytime max.), pmol mol−1 14 18 3.2 9.5 HOBr (daytime max.), pmol mol−1 2.5 11 3.2 7.4
HBr (daytime max.), pmol mol−1 1.6 18 1.2 12
BrO (daytime max.), pmol mol−1 1.0 7.8 3.0 6.5 BrCl (nighttime max.), pmol mol−1 15 16 7.0 10 Br2(nightime max.), pmol mol−1 1.0 13 0.7 6.9 Primary Sources for atomic Brb
BrO + NO, % 50 31 15 26
BrCl photolysis, % 26 18 38 19
HOBr photolysis, % 10 19 24 29
Br2photolysis, % <1 21 7 16
NOx(24-h mean), pmol mol−1 171 31 8.3 20
NOx(24-h mean, “no halogens”), pmol mol−1 237 62 27 37
NO (daytime max.), pmol mol−1 28 10 1.7 7.6
NO (daytime max., “no halogens”), pmol mol−1 42 16 6.0 12 Primary Heterogeneous sinks for NObx
S aerosol, % heterogeneousc 91 69 86 79
ClNO3hydrolysis, % heterogeneousd 53 14 54 16 BrNO3hydrolysis, % heterogeneousd 27 54 33 59 N2O5hydrolysis, % heterogeneousd 11 <1 <1 <1
BrNO3+ Cl−, % heterogeneousd 3 19 3 12
OH (daytime max.), pmol mol−1 0.11 0.10 0.022 0.15 OH (daytime max., “no halogens”), pmol mol−1 0.13 0.22 0.031 0.25 Primary sources for OHb
HO2+ NO, % 58 36 9 34
HO2+ O3, % 29 13 41 16
HOBr +hv, % 4 35 27 29
Primary sinks for OHb
OH + CO, % 31 39 47 31
OH + CH4+ O2, % 23 24 20 25
OH + H2, % 13 14 12 15
HO2(daytime max.), pmol mol−1 9.2 12 4.4 14
HO2(daytime max., “no halogens”), pmol mol−1 8.2 17 6.0 18 Primary sources for HOb
2
H + O2+{M}, % 46 56 61 56
NO + CH3O2, % 25 18 9 16
Primary sinks for HOb2
HO2+ NO, % 47 22 6 19
HO2+ O3, % 24 8 27 9
HO2+ HO2, % 9 16 8 23
HO2+ BrO, % 6 35 32 23
HO2+ CH3O2, % 6 13 16 21
O3(24-h mean), nmol mol−1 49 14 29 14
O3(24-h mean, “no halogen”), nmol mol−1 64 37 41 28 Primary chemical sinks for Ob3
O3+ NO, % 66 15 11 11
O3+hv, % 20 35 45 55
O3+ Br, % 5 46 35 30
O3+ Cl, % 3 2 5 1
Primary sources for particulate nss SO24−b
H2SO4scavenging, % 96 81 50 92
HOCl + S(IV), % 3 11 39 3
aUnless otherwise noted, results correspond to “with halogens” runs.bIntegrated over 24 h.cPercentage of total heterogeneous NO
Particulate Na+, nmol m-3
0 200 400 600 800
Pa
rticulate Br
- D
ef
icit
, nm
ol
m
-3
0.0 0.2 0.4 0.6
0.8 EURO Day EURO Night N-AFR Day N-AFR Night ITCZ Day ITCZ Night S-ATL Day S-ATL Night
a
Particulate Br- Deficit, pmol mol-1
0 10 20 30
Br
t
, pmol m
o
l
-1
0 10 20 30
EURO Day EURO Night N-AFR Day N-AFR Night ITCZ Day ITCZ Night S-ATL Day S-ATL Night
b
Fig. 7. (a)Measured absolute particulate Br− deficit relative to sea salt versus particulate Na+ within the four regimes. The line depicts the ratio of particulate Br− to Na+ in seawater (0.001798 mol mol−1). (b)Measured Brt versus absolute
partic-ulate Br−deficit relative to sea salt within the four regimes. Lines depict reduced major axis regressions (Keene et al., 1986) for day-time (dashed, slope = 1.66, Y intercept =−0.3, andr2= 0.64) and nighttime (solid, slope = 0.88, Y intercept = 2.1, andr2= 0.77).
and calculated pHs for largest and smallest size fractions in this and other regimes. The relatively higher simulated pH for the largest size fraction reflects the rapid turnover rates of large aerosols relative to the kinetics of phase change. Freshly produced and aged aerosols were not simulated as external mixtures. The instantaneous mixing of fresh with
chemically aged aerosols during each time step sustained substantial undersaturation of the largest size fraction with respect to acidic gases and, thus, higher solution pH rela-tive to smaller super-µm size fractions (e.g., Pszenny et al., 2004). In contrast, pHs inferred from the measured phase partitioning of HCl were based on the assumption of ther-modynamic equilibrium and, consequently, inferred pHs for the larger, undersaturated size fractions represent lower lim-its (Keene et al., 2004). Cl−concentrations associated with the smallest aerosol size fraction in the EURO regime (me-dian of 0.8 nmol m−3; Fig. 3j) were near the average detec-tion limit (1.0 nmol m−3), which contributed to large uncer-tainties in estimating pHs for this size fraction based on HCl partitioning. In addition, as described below, the model failed to reproduce some features of sub-µm aerosol composition suggesting that it may be missing some important processes. Both factors may contribute to the relatively large differences between inferred versus simulated pHs for the smaller size fractions.
The higher simulated pHs (and associated differences in the phase partitioning of HNO3) in the “with halogens”
rel-ative to the “no halogens” runs for this and other regimes (Figs. 8 and 9) reflect the influences of HCl phase parti-tioning on aerosol solution acidity in the former versus lack thereof in the latter. Acid displacement of HCl by more solu-ble acids (primarily HNO3) transfers acidity from the aerosol
solution to the gas phase thereby sustaining relatively higher solution pH in the “with halogens” run (e.g., Keene et al., 1998).
Simulated Cl* (defined here as the sum of volatile in-organic Cl species other than HCl) varied from 52 to 100 pmol mol−1over diel cycles (Fig. 8). Although the Cl* measurements did not indicate systematic diel variability, the simulated values were within the range of observations (Fig., 2c, Table 3). In the model, Cl* was dominated dur-ing the daytime by HOCl and ClNO3 and at night by Cl2
and BrCl (Fig. 8, Table 4). In close proximity to large urban and industrial emission sources for NOx, ClNO2 produced
via the nocturnal reaction N2O5+ Cl−→ClNO2+ NO−3 may
accumulate in the dark to mixing ratios>1000 pmol mol−1 (Osthoff et al., 2008). However, NOx is efficiently
oxi-dized to HNO3 and particulate NO−3 in marine air and
de-posited to the surface. Consequently, NOx mixing ratios
(e.g., Neuman et al., 2006) and the associated nocturnal pro-duction of ClNO2decrease rapidly over the ocean with
dis-tance from sources, consistent with the simulated values re-ported herein. For example, relative to the EURO runs in which depositional losses of oxidized N were replaced by an aged mixture of HNO3 and NO2 in a ratio of 1:1, a
sensi-tivity run in which losses were replaced entirely by freshly emitted NO yielded steady-state NOxmixing ratios
averag-ing 237 pmol mol−1and a maximum ClNO2mixing ratio of
0 150 300
EURO
pmol mol
−1
N−AFR ITCZ S−ATL
HCl
0 20 40
EURO
pmol mol
−1
N−AFR ITCZ S−ATL
Brt
0 50 100
pmol mol
−1 Cl*
0 10 20
pmol mol
−1 HBr
0 20 40
pmol mol
−1 Cl2
0 5 10
pmol mol
−1 Br2
0 25 50
pmol mol
−1 HOCl
0 5 10
pmol mol
−1 HOBr
0 2 4
pmol mol
−1 ClO
0 5 10
pmol mol
−1 BrO
0.0 2.5 5.0
pmol mol
−1 ClNO2
0 10 20
pmol mol
−1 BrNO3
0 10 20
pmol mol
−1 ClNO3
0 150 300
pmol mol
−1 NOx
0.000 0.002 0.004
pmol mol
−1 Cl
0.00 0.01 0.02
pmol mol
−1 OH:HO
2
06 18 0
10 20
pmol mol
−1
06 18 06 18 06 18
BrCl
06 18 0
35 70
nmol mol
−1
06 18 06 18 06 18
O 3
Time, hh UTC Time, hh UTC
Fig. 8. Simulated diel cycles in mixing ratios of gas-phase species for the four flow regimes; values for runs “with halogens” are in black and those with “no halogens” are in red.
Integrated over 24 h, Cl-atom production was dominated by ClO + NO and the photolysis of BrCl and Cl2 whereas ClNO2accounted for only 0.4% of the total (Table 4) but the
relative importance of different pathways varied over diel cy-cles. Following sunrise, the photolysis of Cl2and BrCl
(pro-duced primarily via heterogeneous reactions of hypohalous acids and halide ions) dominated (49% and 32%, respec-tively). Photolysis of ClNO2 accounted for less than 1%
of Cl-atom production during this period. During midday, ClO + NO was the most important single pathway (48%) with photolysis of HOCl (19%), BrCl (19%) and Cl2(10%)
ac-counting for most of the balance. Cl-atom concentrations peaked following sunrise at 4.3×104cm−3, remained high through midday, and declined in the late afternoon (Fig. 8). Although the Cl-atom production pathways under
steady-state conditions in the EURO regime were not dominated by the autocatalytic recycling of Cl2 as simulated in aging
pollution plumes elsewhere (Pechtl and von Glasow, 2007; Lawler et al., 2009), the absolute concentrations during day-time were similar. At these levels, oxidation by Cl would have been a significant sink for alkanes (e.g., Wingenter et al., 1996; Pszenny et al., 2007) and accounted for 24% of simulated CH4oxidation within the EURO MBL.
0.0 0.1 0.2
EURO
Br−
N−AFR
nmol m
3
ITCZ S−ATL
0 50 100 Cl−
nmol m
3
0 5 10 NO3
−
nmol m
3
0 10
20 nss SO42−
nmol m
3
1 10
0 4 8
1 10
pH
1 10 1 10
Diameter, µm
Fig. 9. Simulated average size distributions of particulate-phase species for the four flow regimes; values for runs “with halogens” are in black and those with “no halogens” are in red. To facilitate direct comparison with measured size distributions, constituents associated with the S size bin have been added to those associated with the smallest sea-salt size bin.
accumulation of significant Br−in the ambient aerosol (me-dian EF(Br−) = 0.52) implies that volatile inorganic Br in the model is overestimated, which is consistent with the factor of two higher mixing ratios of simulated Brt (daily
aver-age = 15 pmol mol−1, Fig. 8, Table 4) relative to measured Brt (Fig. 2d, Table 3) in this regime. In addition, simulated
Brt exhibited little diel variability (Fig. 8) whereas that in
measured Brt was marked (Fig. 2d). Causes for these
dif-ferences in diel behavior are not known. In the model, Brt
was dominated by BrCl at night and BrNO3during the day
(Fig. 8, Table 4). The primary sources for atomic Br were BrO + NO and BrCl photolysis (Table 4).
Destruction of O3 by atomic Br (O3+ Br→BrO + O2) in
the model accounted for 5% of the total O3sink associated
with all major chemical pathways (including photolysis and reaction with NO, NO2, OH, HO2, and atomic Cl).
Reac-tion with atomic Cl accounted for 3% of the total. Simu-lated mixing ratios of product BrO (maximum and midday averages of 1.0 and 0.83 pmol mol−1, respectively, Fig. 8),
were consistent with measurements of BrO (upper limit of
∼1 pmol mol−1) in this region during a previous cruise of the Polarstern (Leser et al., 2003). At the high NOx
mix-ing ratios in this regime, halogen radical recyclmix-ing in the gas phase and associated O3destruction was slowed by the
for-mation of halogen nitrates (i.e., BrO + NO2→BrNO3
com-peted with BrO + HO2→HOBr), which accumulated to
sig-nificant concentrations (Fig. 8, Table 4.). Reactions involv-ing S aerosol accounted for 91% of the total heterogenous NOxsinks (Fig. 10). Hydrolysis reactions involving ClNO3
and BrNO3 to produce hypohalous acids and hydrolysis of
N2O5 to produce HNO3 were the most important of these
pathways (Table 4). Of those involving sea salt, the reac-tion of ClNO3(41%) and BrNO3(26%) with Cl−to produce
Cl2and BrCl, respectively, were most important.
Compar-isons between rates of NOxprocessing (Fig. 10) and
corre-sponding differences in simulated NOxmixing ratios in the
0 500 1000 1500
pmol mol
−1
day
−1
EURO
0 100 200 300 400 500
N−AFR
0 20 40 60 80 100 120
ITCZ
0 50 100 150 200
S−ATL
00 05 10 15 20 24 0
500 1000 1500
pmol mol
−1
day
−1
Time, hh UTC
00 05 10 15 20 24 0
100 200 300 400 500
Time, hh UTC
00 05 10 15 20 24 0
20 40 60 80 100 120
Time, hh UTC
00 05 10 15 20 24 0
50 100 150 200
Time, hh UTC
Fig. 10.Simulated diel cycles in selected NOxsinks for the four flow regimes. Values for runs “with halogens” are depicted in the top row of panels and those for “no halogens” are in the bottom row. Gas-phase sinks are in red, heterogeneous reactions involving sea salt are in blue, and those involving S aerosol are in green. Gas-phase reactions include NO2+ O3, NO2+ OH, and NO3+ (CH3)2S; HNO3photolysis is evaluated as a negative sink. Heterogeneous pathways include hydrolysis and reactions with particulate Cl−and Br−involving ClNO3, BrNO3, and N2O5.
that under the polluted conditions in the EURO regime, the overall influences of halogens on NOxcycling was
signifi-cant. Although the peak simulated mixing ratios of OH and HO2 were similar in the “with halogens” versus “no
halo-gens” runs, lower simulated NOxin the “with halogens” run
led to net O3destruction resulting in simulated average daily
O3 mixing ratios that were 23% lower relative to the “no
halogens” run (Fig. 8, Table 4). We note that simulated O3
mixing ratios (Table 4) were greater than measured values within the EURO regime (Table 3). Several methodological factors may have contributed to these differences. Chemi-cal transformations involving I-containing compounds were not considered in the simulations but may have contributed to net O3destruction in ambient air (e.g., Read et al., 2008).
In addition, both the entrainment flux of O3 and the ratio
of HNO3to NO2 used to replace depositional losses of
ox-idized N are poorly constrained. Sensitivity runs based on higher HNO3:NO2ratios than used in the model
parameteri-zation yielded steady state O3mixing ratios within the range
of observations.
3.3 North African influenced 3.3.1 Measured characteristics
Relative to EURO, the N-AFR regime was characterized by generally higher sea-salt concentrations (Figs. 2b, 3j),
sim-ilar ranges in particulate NO−3 and nss SO24− concentra-tions, lower HNO3and SO2mixing ratios (Figs. 2e, f, 3o,
p, Table 3) and higher pHs (Figs. 2g, 3q). We infer that the most of the oxidized N and S originated as primary or secondary combustion products that were transported from Western Europe, western Africa, and ships at sea. Acidifica-tion and associated dechlorinaAcidifica-tion of marine aerosol primar-ily by HNO3(Fig. 3n, o) sustained substantial HCl mixing
ratios (Fig. 2c, Table 3). EF(Cl−) decreased with decreasing particle size (Fig. 3k) and particulate Cl− deficits summed over all size fractions were generally greater than the corre-sponding HCl mixing ratios (Fig. 2c) suggesting that the at-mospheric lifetime of HCl within this regime was somewhat shorter than that of the parent aerosol.
Cl* was detected during most sampling intervals north of 22◦N (Fig. 2c). Higher mixing ratios during this period were generally observed at night although consistent diel variabil-ity was not evident. Between 22 and 18 N, Cl* was unde-tectable; an instrumental malfunction precluded quantifica-tion through the southern segment of this regime.
The highest concentrations of Brt, the greatest absolute
particulate Br− deficits (30.1 and 18.6 pmol mol−1, respec-tively, Fig. 2d), and the highest particulate Br− concen-trations, (Fig. 3l) along the cruise track were measured in the N-AFR region. During a previous cruise of the
to 3.6 pmol mol−1) over a 2-day period off North Africa
be-tween 37 and 30 N. BrO was generally<1 pmol mol−1to the north and south of this region. The maximum mixing ratio of Brt along the cruise track during 2003 was also measured
in this region (Fig. 2d). This coincidence in maxima for BrO (Leser et al., 2003) and Brt (Fig. 2d) suggests that during
October Br-radical chemistry in the eastern Atlantic peaks in this latitudinal band.
As in the EURO regime, bulk aerosol was significantly de-pleted in Br−relative to fresh sea salt (Fig. 2b, Table 3) but the smallest size fraction was highly enriched (Fig. 3l, m). Also, as in EURO, Brt was present in the N-AFR regime at
higher concentrations than particulate Br−(Fig. 2d), which
suggests that Brt had a longer atmospheric lifetime against
dry deposition than the parent aerosol. Brt varied
system-atically over diel cycles with mixing ratios during daytime systematically greater those at night (Fig. 2d). In contrast, Br− associated with bulk aerosol exhibited relatively less day-night variability.
Median estimated emission fluxes of sea-salt Br− and Cl−were approximately balanced by the corresponding dry-deposition fluxes of total Br (Brt+ particulate Br−) and total
Cl (HCl + particulate Cl−, Fig. 6), which implies that produc-tion of marine aerosol was the primary source for inorganic Cl and Br in this regime. Brt and particulate Br−accounted
for approximately equal fractions of the median dry flux of total Br whereas particulate Cl−dominated the median dry flux of total Cl.
3.3.2 Simulated characteristics
Simulated steady-state mixing ratios of NO and NO2in the
“with halogens” run for the N-AFR regime averaged 3.6 and 27 pmol mol−1, respectively, over diel cycles (Fig. 8), which were within the range of measurements in this region by Carsey et al. (1997) (NOx range: 17 to 69 pmol mol−1;
NOx median: 31 pmol mol−1), Leser et al. (2003) (NO2
range: <24 to 462 pmol mol−1), Read et al. (2008) (day-time average NO for October and November: 2.7 and 4.5 pmol mol−1, respectively), Lawler et al. (2009) (NOx
range: <14 to 51 pmol mol−1 during May and June), and Lee et al. (2009) (average NOx for October and
Novem-ber: 18.5 and 20.5 pmol mol−1, respectively). The simu-lated size distributions of NO−3, nss SO24−, and Cl− in the
“with halogens” runs (Fig. 9) were similar to the correspond-ing median values for measured distributions (Fig. 3n, o, j, respectively). The simulated mixing ratios of HNO3(92
to 108 pmol mol−1, not shown) were greater than measured mixing ratios (Fig. 2e, Table 3). Simulated SO2 (389 to
401 pmol mol−1, not shown) fell within the upper range of observations (Fig. 2f, Table 3), and simulated HCl (Fig. 8, 254 to 289 pmol mol−1) fell within the lower range of obser-vations (Fig. 2c, Table 3). With the exception of the largest and smallest size fractions, simulated aerosol pHs for the
“with halogens” run (Fig. 8, all 3.7) were similar to median values inferred from the measured phase partitioning of HCl (Fig. 3p, 3.8 to 3.9).
Simulated Cl* mixing ratios (11 to 26 pmol mol−1) were within the range of measured Cl* (Fig., 2c, Table 3) and were dominated during the daytime by HOCl and at night by BrCl (Fig. 8, Table 4). The simulated nocturnal mixing ratios of Cl2 (maximum of 2.8 pmol mol−1) were at the lower limit
and those of BrCl (maximum of 16 pmol mol−1) were greater than corresponding measured mixing ratios in aged polluted air at Cape Verde (maximum of 35 and<2 pmol mol−1, re-spectively; Lawler et al., 2009). These differences relate in part to the fact that our model calculations were based on steady-state conditions whereas Lawler et al. (2009) evaluated a chemically evolving pollutant plume. Cl-atom production in our model was dominated by BrCl photoly-sis and ClO + NO; ClNO2photolysis was insignificant
(Ta-ble 4). Atomic Cl peaked in early morning at concentra-tions of 7.8×104cm−3and remained high throughout the day (Fig. 8). Similar concentrations of atomic Cl were simulated by (Lawler et al., 2009) although the primary precursor under those conditions was Cl2sustained by autocatalytic cycling.
At these concentrations, atomic Cl was an important oxidant for alkanes and (CH3)2S and accounted for 36% of simulated
CH4oxidation in this regime.
The simulated size distribution of Br− (Fig. 8) differed considerably from measured distributions (Fig. 3l). All sim-ulated size fractions except the largest two were almost com-pletely debrominated. In contrast, measured distributions re-veal large enrichment relative to sea salt in the finest size fraction and retention of significant Br− in all super-µm
size fractions (Fig. 3l, m). As discussed above, causes for these differences are unknown. The median measured EF(Br−) for bulk aerosol (0.25) implies that volatile inor-ganic Br in the model is overestimated. The retention of Br in the aerosol coupled with the high concentrations and rapid turnover of sea salt and the longer lifetime against deposition of Brt relative to the parent aerosol contributed to the
fac-tor of two higher mixing ratios of simulated Brt (averaging
37 pmol mol−1over diel cycles, Fig. 8, Table 4) compared to measured values (Fig. 2d, Table 3). In the model, BrCl and Br2dominated Brtat night and HBr, BrNO3, and HOBr
dominated during the day (Fig. 6, Table 4). The dominant sources for atomic Br were BrO + NO and the photolysis of HOBr, Br2, and BrCl (Table 4).
Reaction with atomic Br and Cl accounted for 46% and 2%, respectively, of the total modeled O3 sink.