12
THE OPTIMIZATION OF WOOD TRUSSES CONNECTED WITH METAL PLATES
USING ANSYS
İbrahim Halil BAŞBOĞA*
Research Ast.- Kahramanmaras Sutcu Imam University Faculty of Forestry, Forest Industry Engineering
Address: Kahramanmaras Sutcu Imam University 46100, Kahramanmaras-Turkey Email: [email protected]
Ergün GÜNTEKİN
Assoc. Prof. Dr – Suleyman Demirel University Faculty of Forestry, Forest Industry Engineering Address: Suleyman Demirel University 32100, Isparta-Turkey
Email: [email protected]
Abstract:
The rapid growth of the world population causes an increasing demand for wood materials. As one of the most common problems seen in today's forest destructions may be able to avoided by means of the rational use of forests and processing of trees cut with optimal level and also it helps to fulfill demand of wood materials. In this study, ANSYS software has been used in order to optimize wood usage in metal plate connected wood trusses which save 25% or higher rates of wood raw material comparing to massive beams. Three different types of flat- wood truss systems have been considered in the study. The first cross sectional dimension of the truss elements was accepted as 5 x 10 nominal dimensions as can be found in the market. The elements of the truss systems have been modeled using Link1 ANSYS element. The parameters used in modeling of the link1 element were; modulus elasticity and Poisson’s ratio. First order optimization method was chosen for the optimization process. The constraints of the truss systems in optimization process were deformation and stress. The optimized trusses were manufactured in laboratory in order to check the methods appropriateness. Turkish red pine (Pinus brutia Ten.) lumber and metal plate connectors were used in the construction of the optimized truss systems. The obtained values of deformation in the laboratory were similar to the calculated values of deformation in the ANSYS software. Results show that metal plate connected wood truss systems optimization can be achieved by the ANSYS software. Optimization process proves that more than 25% or higher in wood usage can be gained.
Key words: ANSYS; optimization; stress and deformation constraints; wood trusses.
INTRODUCTION
The natural events such as earthquakes, floods, landslides and avalanches have occurred since the world's creation and also they may happen in the future. The main thing is that to avoid natural events before turning into a disaster. If there is death in the earthquake, there is lack of precautions. In order to prevent casualties in such events, the science and engineering application should be applied (UCGE 2013).
The huge earthquake which had happened in the north-west of Turkey in 17th August 1999 caused the loss of many lives. As a result of that catastrophe, many of companies in the construction industry have tended to build more safe, durable and buildings with light construction. Metal plate connectors (MPC or truss plates) were introduced by Carroll Sanford in 1952 and changed the wood construction industry (Wang et al. 2007). Roofs and floors wood trusses produced with MPC are
commonly used for building residential, industrial, and commercial construction in the United States, Canada and Northern European countries. In the 90s, 90% of the roof and floor trusses which used in residential construction in the USA were MPC wood trusses (Gupta et al. 1996). Wood trusses save more than 25% of wood raw material in comparison with massive beams. In addition, wood trusses are suitable for larger spans. MPCs are the most economical and easy applicable connectors that can be found in the wood truss industry, today. They are suitable for the mass production, and that is the reason why their use is increasing (Callahan 1993).
13
MPC wood trusses have been used in Turkey since the earthquake which happened in 1999 (Güntekin 2008). Fir, Scotch pine and spruce were usually used in the manufacturing of these trusses. However, Turkish red pine which has a significant spread has not been used so far (Güntekin 2008). In this study, Turkish red pine lumbers were used for MPC wood truss manufacturing.
The demand for wood which has high technological properties is increasing parallel with the rapid world population growth. To meet this demand, the forests should be used in a rational way and felled trees should be processed with the most efficient. The behavior of MPC wood joints is highly complex and several variables such as orientation of plates, wood species, size and properties of the plates, wood moisture contents, etc may affects their properties (Liu 2013). Last thirty years, many special and general purpose programs such as ANSYS, ABACUS etc have been developed and used in the analysis of wood trusses. These programs could be used for analysis of wood trusses and it has also shown that laboratory results were found to be consistent with the result of programs (Gupta et al.
2004).
Design and topological optimization processes are frequently used in the field of civil and mechanical engineering. Topological optimization involves determination of optimal material in surface or volume, while design optimization deals with application of numerical programming methods in solving practical problems (Fedorik 2013). Applicability of different optimization techniques in the field of wood systems including timber beams (Bru et al. 2015), furniture joints (Ke et al. 2016), sofa frames
(Rundgren and Wörmke 2011) and wood-based sandwich panels (Kawasaki et al. 2006) have been
successfully proven.
The purpose of this study was optimization of trusses made with red pine wood. Thus, the rational usage of the wood raw material in wood trusses manufacturing can be ensured. With this study, a method is developed for the rational use of material in the production of wood trusses. The target of the optimization was minimum weight for wood element of truss system under design loads. In this regard, ANSYS was used for optimization. Three different types of commercially used truss system was designed and produced in the laboratory. Deformations of the trusses were determined and compared with ANSYS results.
MATERIAL AND METHODS Materials
Red pine (Pinus brutia Ten.) lumber was supplied from a local lumber company. The lumber
specimens were 3000mm long and 50 by 100mm in cross section. Two different sizes of metal plates (76 by 100mm (S), and 76 by 152mm (L)) used in the study were supplied by a commercial plate manufacturer. Some properties of the plates are summarized in Table 1.
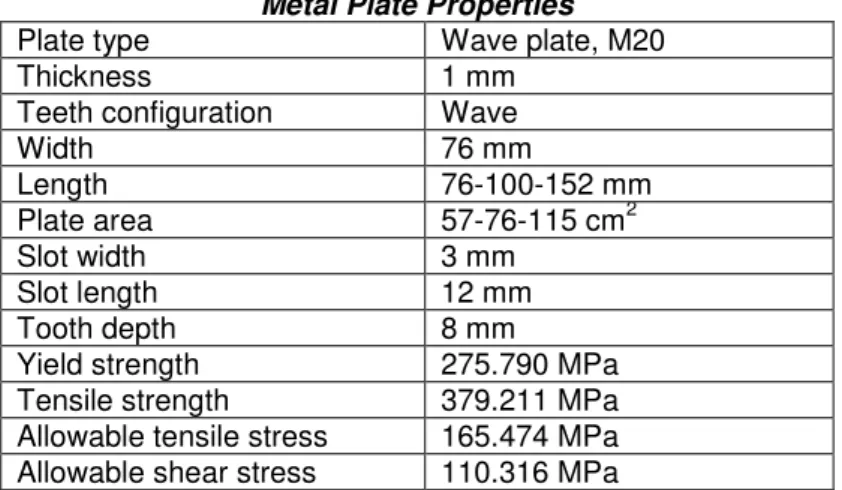
Table 1 Metal Plate Properties
Plate type Wave plate, M20 Thickness 1 mm
Teeth configuration Wave
Width 76 mm
Length 76-100-152 mm Plate area 57-76-115 cm2 Slot width 3 mm
Slot length 12 mm Tooth depth 8 mm
Yield strength 275.790 MPa Tensile strength 379.211 MPa Allowable tensile stress 165.474 MPa Allowable shear stress 110.316 MPa
Design of Trusses and Determination of the Truss Elements’ Load
14
a. b.
c. d.
Fig. 1. Design of Trusses:
a - Model I; b - Model II; c - Model III; d - Example of the Commercial PCT
First, Models were analyzed under 2500 N load which was applied to trusses at the top midpoint using MD Solid program. Compression or tension loads occurred in the truss elements were given in Fig. 2, Fig. 3 and Fig. 4, respectively.
Fig. 2.
15 Fig. 3.
Load graph of Model II.
Fig. 4.
Load graph of Model III.
All models have one top and one bottom chord. The chords of model I were separated four different elements (top chord; BD, DF, FH, HJ and bottom chord; AC, CE, EG, GI). Furthermore, the top chord of model II was separated two elements (BD, DG) while bottom chord was separated three (AC, CE, EF). Moreover, four different elements were assigned to model III (BD, DF for top and AC, CE for bottom chord). However, model I has five vertical (AB, CD, EF, GH, IJ) and four horizontal webs (BC, CF, FG, GJ), while model II has two vertical (AB, FG) and four horizontal (BC, CD, DE, EG). In addition, model III has three vertical (AB, CD, EF) and two horizontal webs (AD, DE).
A1 was designated for cross sectional area of all the top and bottom chord elements. A2 and A3 were designated for cross sectional area of all vertical and horizontal webs, respectively. Maximum load was observed from bottom chord elements for model I (CE, EG) and model II (CE), while horizontal webs for model III (AD, DE). It was understood from load graphs of trusses, determination of optimal cross sectional areas for A1 satisfied all elements of trusses for model I and model II. However, maximum load was observed horizontal webs. Thus, determination of optimal cross sectional areas for A3 satisfied all elements of trusses for model III.
Optimization of Cross Sectional Area
16
2500N load was applied to trusses at the midpoint of top chord. Maximum 5000mm2 and minimum 1000mm2 cross sectional area values were used in 0.1 tolerances. In addition, Maximum 1.71MPa and minimum -1.71MPa allowable stress values were used in 0.01 tolerances. Maximum iterations were 50. The results of the ANSYS optimization were presented in Table 2.
Table 2 The Results of the ANSYS Optimization
Model I
SIGMA48 (SV) 1.7024 (MPa)
FEASIBLE *SET 9* (BEST)
A1 (DV) 3583.2 (mm2)
A2 (DV) 1000.0 (mm2)
A3 (DV) 1000.0 (mm2)
V (OBJ) 0.21373E+07 (mm3)
Model II
SIGMA46 (SV) 1.7141 (MPa)
FEASIBLE *SET 33* (BEST)
A1 (DV) 3558.8 (mm2)
A2 (DV) 1000.0 (mm2)
A3 (DV) 1000.0 (mm2)
A4 (DV) 1000.0 (mm2)
V (OBJ) 0.11139E+07 (mm3)
Model III
SIGMA23 (SV) -1.7093 (MPa)
FEASIBLE *SET 50* (BEST) A1 (DV) 1000.0 (mm2)
A2 (DV) 1000.0 (mm2)
A3 (DV) 3642.8 (mm2)
V (OBJ) 0.14703E+07 (mm3)
The best result was obtained from 9th, 33th and 50th iteration for model I, model II and model III, respectively (Table 2). In ţable 2, V was represented to total system volume. It was observed from table, minimum wooden material was used in model II. A was also cross sectional area of elements. A1 was represented to cross sectional area of chords. In addition, A2 and A3 were represented to cross sectional area of all vertical and horizontal webs, respectively. There were three different area for model I and model II, while there were four for model II. There were four different element lengths in model II while three for model I and model III. That was caused to obtaining four different area results after the optimization for model II. A4 was represented to short elements of bottom chord which had no load on it for model II. A1 was optimized for model I and model II while A3 for model III. Moreover, SIGMA48, SIGMA46 and SIGMA23 were showed allowable stress values for model I, model II and model III, respectively.
Manufacturing of Trusses
It was obtained that total cross section area was 3600mm2 after optimization. The lumber specimens were resized to 40 by 90mm in cross section in accordance with the optimization. Thickness planer and miter saw was used for resizing. All trusses elements sizes were given in Table 3.
Table 3 The Element Size of Trusses
Top & Bottom chords (mm) Vertical Webs (mm) Horizontal Webs (mm) Angle of Horizontal Webs
Model 1 2490 200 604,0695324 20° – 70°
Model 2 2490 200 1-) 622,9767251 2-) 641,9501538 19° – 71°
Model 3 2490 200 1196,829144 10° – 80°
Only one plate was pressed each time, using a C hydraulic press. Large metal plates were used for more than two elements assembling, while small plates for two elements. Five truss systems for each model were manufactured.
Deformation Testing
17
Load-deformation graphs were created by using data which obtained from DataTaker and UTM. Average load-deformation values were determined for all trusses and sample 5, sample 6 and sample 11 were represented for model I, model II and model III, respectively.
Small bending samples were also tested in order to determine bending strength and stiffness. Bending Modulus of Elasticity (MOE) and Modulus of Rupture (MOR) were calculated using the following formulas shown in Eqs. (1) - (2), respectively.
(MOE) 3
3
4
xbxh
Δdx
ΔFxL
E
=
(1)(MOR) 2
2
3
bh
PL
E
=
σ
(2)RESULTS AND DISCUSSIONS
Mechanical and physical properties of red pine lumbers which used in our study were presented in Table 4. Model verifications can be done including deflection, truss member internal force and truss strength (Li 1998). In this study deflection was used as model validation parameter since it is comparable simple to measure.
Table 4 Some Mechanical and Physical Properties of the Lumber Used in the Study
Property Mean Maximum Minimum Standard
Deviation
Specific Gravity (g/cm3) 0.53 0.67 0.44 0.05 Moisture Content (%) 10.05 11.32 9.47 0.31 MOE (MPa) 10647 13651 7422 1779
MOR (MPa) 112 123 100 5.52
MOE values of wood samples taken from manufactured trusses were given in Table 5.
Table 5 MOE Values
MOE (MPa)
Sample ID Sample 5 Sample 6 Sample 11
1 8272,9 12446,9 11348,9 2 9012,6 11545,4 12231,8 3 8280,5 10767,3 10598,6 4 7501,2 13651,1 11634,0 5 8886,6 11143,1 12192,5 6 7422,2 12602,6 11684,5 7 8753,9 11082,6 10919,3 8 8114,1 12404,9 10675,4
Mean 8280,5 11955,5 11410,6
Standard Deviation 597,5 917,8 597,5
18 Fig. 5.
Load-Deformation graph.
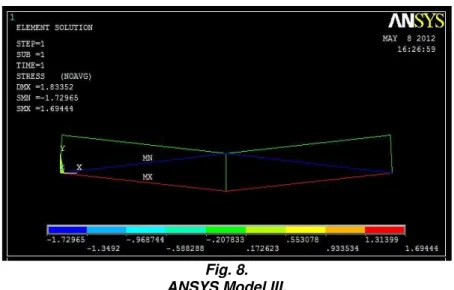
ANSYS models for model I, model II and model III were presented in Fig. 6, Fig. 7 and Fig. 8, respectively.
Fig. 6. ANSYS Model I.
19 Fig. 8. ANSYS Model III.
Deformations obtained with LVDT and ANSYS program were presented in Table 6. The average deformation was given for LVDT data in Table 6. In addition, ANSYS results deviation from real results which obtained in laboratory conditions was also presented in Table 6.
Table 6 Summarize of the Results
Sample ID LVDT (mm) ANSYS (mm)
Load (N) Deformation (mm) Load (N) Deformation (mm) Deviation (%)
Model I 2491.7 1,9 2500 1,31467 30.8
Model II 2452,5 1,2 2500 0,91053 24.1
Model III 2511,4 3,2 2500 1,83352 42.7
Maximum deformation and deviation were observed from model III. Model III has lower stiffness than other two trusses. In model III, maximum load was observed in horizontal webs with increasing of horizontal webs’ length (Fig. 4). Equation of deformation was given in Eq. (3).
Deformation = n*N*L/A*E (mm) (3)
where: n - Virtual load on element N - Load on element L - length of element A - Cross sectional area E - Modulus of elasticity
It was understood from Eq. 3, there is a linear relationship between element's length and deformation. If compared to model I and model II, model I has more deformation than model II under the same load. The elements of Model I has MOE of 8280MPa, while the elements of Model II has 11955MPa. This is one of the main reasons why the model I was more deformable than model II. When the Eq. 3 was examined, it was expected the truss which has low modulus elasticity has high deformation and the opposite was also true. The differences can also be expected due to the nature of wood which is non-homogenous material.
In theoretical analysis of trusses, joints are assumed to be pinned and elements have no bending forces. Thus theoretical analysis and FEM will yield lower values in both stresses and deformations. The analysis method also ignores connection semi-rigidity and joint eccentricity which may contribute significantly to the total deformation of the trusses tested. As indicated by Gupta et al.
20 CONCLUSION
In this study, three different wood trusses with metal plate connectors were successfully manufactured. Deformation of trusses was measured in laboratory conditions and compared with ANSYS program. As results of this study, the following conclusions were reached:
The best result was obtained from model II for deformation and material (red pine lumber and metal plate) usage,
Approximate deformation results can be achieved using ANSYS program,
No-force elements can also be determined with ANSYS program,
Using optimization process, 27% or more wood materials can be saved for all models.
As a result, although ANSYS program might be used in design and analysis of metal plate connected wood trusses; prototype of trusses should be tested in laboratory.
Acknowledgements
This research was supported by SDU Scientific Research Fund (BAP) (Project number: 3057-YL-12).
REFERENCES
Bru D, Varona FB, Ivorra S, Baeza FJ (2015) Structural optimization of timber beams with composite materials. WIT Transactions on The Built Environment, 168:595-606.
Callahan EE (1993) Metal plate connected wood truss handbook. Wood Truss Council of America Madison, Wisconsin.
Fedorik F (2013) Using optimization’s algorithms by designing of structures. Unpublished PhD thesis. Brno University of Technology, Faculty of Structural Engineering, Brno, Czech Republic.
Güntekin E (2008) Kızılçam (Pinus brutia Ten.) Kerestesi ile Yapılmış Metal Plakalı Kafes Kiriş Birleştirmeleri İçin Emniyet Yükleri. “Allowable Lateral Resistance Design Values for Metal Plate Connections Constructed with Turkish Calabrian Pine (Pinus Brutia Ten.) Lumber” Süleyman Demirel Üniversitesi Orman Fakültesi Dergisi Seri :A, Sayı: 1:134-142.
Gupta R, Gebremedhin KG, Cooke JR (1992) Analysis of metal plate connected wood trusses with semi-rigid joints. American Society of Agricultural Engineers, 35(3):1011-1018.
Gupta R, Vatovec M, Miller TH (1996) Metal-plate connected wood joints: A Literature Review. Oregon State University Forest Research Laboratory Research Contribution 13.
Gupta R, Miller TH, Redlinger MJ (2004) Behavior of metal-plate-connected wood truss joints under wind and impact loads. Forest Products Journal 54(3):76-84.
Kawasaki T, Zhang M, Wang Q, Komatsu K, Kawai S (2006) Elastic moduli and stiffness optimization in four point bending of wood based sandwich panel for use as structural insulated walls and floors. Journal of Wood Science, 52(4):302-310.
Ke Q, Lin L, Chen S, Zhang F, Zhang Y (2016) Optimization of L-shaped corner dowel joint in pine using finite element analysis with taguchi method. Wood Research, 61(2):243-254.
Li Z, Gupta R, Miller TH (1998) Practical approach to modeling of wood truss roof assemblies. Practice Periodical on Structural Design and Construction, (August):119-124.
Liu X (2013) Three-dimensional modeling of metal plate connected wood truss joints. Unpublished PhD Thesis. The University of British Columbia, Canada.
Rundgren A, Wörmke F (2011) Optimization of the Ektrop sofa frame through the use of finite element analysis. Unpublished MSc thesis, Malardalen University, School of Innovation, Design and Engineering, Sweden.
UCGE (2013) Press release from UCTEA CHAMBER OF GEOPHYSICAL ENGINEERS. Eskişehir, TURKEY. http://www.jeofizik.org.tr/genel/bizden_detay.php?kod=4324&tipi=17&sube=0#.V-uCQ4iLSHs. htm, consulted 3 July 2016.