ISSN 2179-8087 (online)
Original Article
Forest Management
Creative Commons License. All the contents of this journal, except where otherwise noted, is licensed under a Creative Commons Attribution License.
Operational Analysis of Forestry Transportation Using
Self-loading Trucks in a Mountainous Region
Edson Lachini
1, Nilton Fiedler
1, Gilson Silva
1, Christiano Pinheiro
1,
Flávio Carmo
21Universidade Federal do Espírito Santo – UFES, Jerônimo Monteiro/ES, Brasil 2Universidade Federal de Campina Grande – UFCG, Patos/PB, Brasil
ABSTRACT
This research was conducted in wood harvesting and transportation areas in the mountainous region of Espírito Santo, Brazil, aiming to analyze the road transportation of forestry wood operations with self-loading trucks. The study identified and evaluated the times, average speed, mechanical availability, level of use and operating efficiency of three different designs of self-loading trucks. According to the results, there was no statistical difference between the vehicles regarding average speed. The highest mechanical availability was found in truck A (93.2%), followed by B (84.3%) and C (79.8%). The greater degree of utilization was found in truck B (91.8%), with little variation between vehicles C (90.0%) and A (89.9%). The highest operating efficiency was observed in truck A (83.9%), followed by B (77.4%) and C (71.8%). We concluded that self-loading truck A was the most efficient.
1. INTRODUCTION
Loading transportation in Brazil is mainly done by road due to its history and national trends. In 2013, the Brazilian transportation system was represented by the following proportions: roads (61%), railway (21%) and waterway (14%). Other transportation means represented 4% of the national transportation matrix (CNT, 2013).
The roads in Brazil have a high acceptance rate due to diverse factors such as an extensive highway network, high offering of different vehicles and low-cost installation when compared to other kinds of transportation (Machado et al., 2009).
The transportation cost in the lumber industry represents 60% of logistics expenses on average and varies from 4% to 25% of gross billing, in many cases, exceeding operating profits. However, in the forestry sector, roads are more emphasized because they are flexible, and fast wood transportation is necessary (Rodrigues, 2010).
Forestry transportation operations consist in moving wood and its derivates from the forest or the industry plants to local consumption in commercial spaces. Wood transportation costs in Brazil are one of the main factors that lead to forestry projects becoming economically unfeasible, since a large part of reforestation areas are located far from consumer centers. Therefore, the harvesting and transportation stages are extremely important activities, accounting for more than 50% of the total costs of wood put into the industry (Machado & Lopes, 2000).
One significant limitation found by professionals working in the forestry industry is a lack of studies to evaluate performance and logistics optimization and forestry transport (Alves, 2011). In this way and according to Tromborg et al. (2009), the higher the average speed of the transport per hour, the lower the cost, which demonstrates the need to adopt optimization and logistics forecasting for transportation.
The lack of planning and professionalism in companies’ transportation systems creates disturbances related to the maintenance of replacing inventory parts and maintenance items, which are necessary to compensate for uncertainties in supplies, and which ends up being reflected in the costs and the final price of the products, thereby diminishing forestry companies’ overall competitiveness.
Transportation planning/logistics takes the choice of the most recommended vehicles into consideration to determine characteristics of the roads, the numbers of more economical roads and those which are adequate for vehicle flow, taking into account loading and unloading (Seixas, 1992).
This study aimed to analyze the technical and operational factors of forestry timber transportation with self-loading trucks of a sawmill located in the municipality of Domingos Martins, Espírito Santo state, Brazil.
2. MATERIAL AND METHODS
2.1. Description of the study area
The research data was collected from a sawmill in a mountainous region of Espirito Santo in the city of Domingos Martins (Latitude S: 20° 18’ 30”, Longitude W: 40° 43’ 30”) at an altitude of 1050m, with slopes close to or higher than 30%. There is a predominantly sloping topography with rugged forms usually consisting of hills, mountains and mountainous massifs, presenting relatively significant unevenness, predominantly variable from 45 to 75% (EMBRAPA, 2006).
The loading area designated for the trucks did not have any kind of paving. In addition, almost all the access roads to these loading areas are one way and unpaved. Paved two-way roads were present in rural areas close to cities, where a flow of trucks is always present due to the outflow of food production. However, there are two-way asphalt roads to get to the unloading areas (the sawmill).
Primarily eucalyptus plantations are managed to feed the sawmills in the regions. The trees were felled with a chainsaw and cut to 2.5m of length and then moved to the edges of the road by manual tipping technique. A self-loading truck was used for wood loading, after which the wood was transported to the sawmill.
2.2. Activities description
by the trip from the sawmill to the plantation once the loading is done. After the load transportation, the wood was unloaded onto the loading dock. The liquid load on each truck was on average 21 cubic meters of eucalyptus wood transported to the sawmill.
The distances from the loading point to the planting area varied from 15km in the region closer to the sawmill (Venda Nova do Immigrant) to 70km in the farthest locations (Castelo, Afonso Claudio and Alfredo Chaves). The average distance traveled per trip by the three trucks was about 45km.
2.3. Characterization of the vehicles used
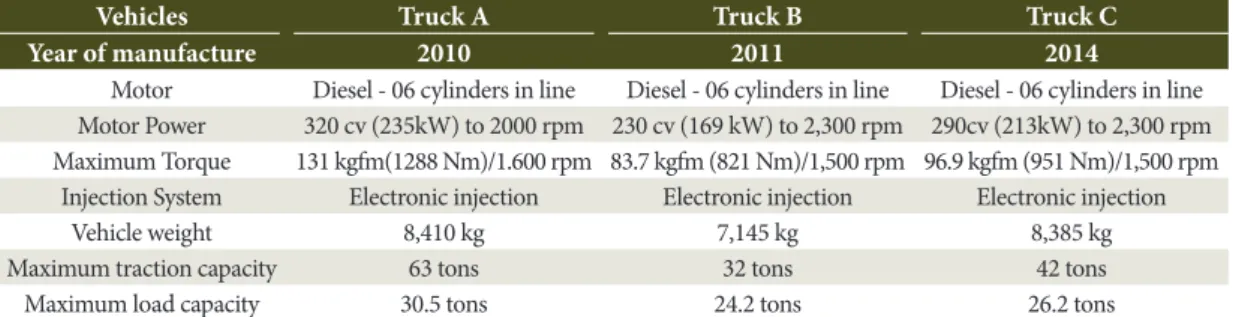
This study evaluated three self-loading truck models with 2-axes, and the main characteristics of these vehicles are shown in Table 1.
2.4. Technical analyses
To perform the technical analyses of the forestry transportation operation, the transportation cycle was divided into:
a) Empty trip: corresponds to the spent time and distance travelled between the sawmill and the loading area;
b) Wood load: corresponds to the time spent loading each vehicle in the field;
c) Load trip: Time spent and distance from the loading area to the sawmill;
d) Unload: Time spent unloading the wood from the truck.
2.4.1. Average speed analyses
Using the data from the time and movement analyses, it was possible to calculate the time spent on each trip. Therefore, it was possible to obtain the average speed
of the trip in Km/h, dividing the distance traveled in km by the time spent in hours (Equation 1):
D AS
T
= (1)
Where: AS = Average speed (km h-1); D= distance
traveled (km); T= time spent (H)
2.4.2. Mechanical availability
Mechanical availability was determined using the relation between the total work time allocated to the activities when the vehicle was fit for performing its functions and the period when it was interrupted by maintenance work (Equation 2):
ET
MA= *100
(ET + MT) (2)
Where: MA = Mechanical availability (%); ET = Effective work time (hours) and MT = Maintenance time (hours).
2.4.3. Utilization degree
The utilization degree is the percentage of time effectively worked by the vehicle in proportion to the total time programmed for work (Equation 3):
ET
UD = *100
(ET + IT) (3)
Where: UD: utilization degree (%); ET = effective work time (h) and IT = interruption in operational time.
2.4.4. Operational efficiency
The operational efficiency is the product of the mechanical availability and the utilization degree (Equation 4):
(MA * UD) OE=
100 (4)
Table 1. Characterization of the trucks used in the study.
Vehicles Truck A Truck B Truck C
Year of manufacture 2010 2011 2014
Motor Diesel - 06 cylinders in line Diesel - 06 cylinders in line Diesel - 06 cylinders in line Motor Power 320 cv (235kW) to 2000 rpm 230 cv (169 kW) to 2,300 rpm 290cv (213kW) to 2,300 rpm Maximum Torque 131 kgfm(1288 Nm)/1.600 rpm 83.7 kgfm (821 Nm)/1,500 rpm 96.9 kgfm (951 Nm)/1,500 rpm
Injection System Electronic injection Electronic injection Electronic injection
Vehicle weight 8,410 kg 7,145 kg 8,385 kg
Maximum traction capacity 63 tons 32 tons 42 tons
Where: OE = operational efficiency (%); MA = mechanical availability (%) and UD = utilization degree (%).
2.5. Statistical analysis
Data collection was carried out in the field of forestry transportation operational activities. A time and movement study was performed by the method of continuous times using a digital timer and form for data recording, along with a minimum number of samples established according to the methodology proposed by Barnes (1977). The sample was defined based on a pilot study performed to define the minimum samples to be used in the research (Equation 5):
2 2
(t * s ) n=
e² (5)
Where: n = samples required; t = value at 5% probability (Student’s t distribution); s = standard deviation of the pilot sample; and e = acceptable errors (5%).
The minimum number of samples needed for each one of the phases that encompasses the load transport was considered (empty trip, loading, loaded trip and unloading).
During the data collection period, 40 samples were collected for the self-loading trucks A, B, and C, with it being necessary to represent 26, 19 and 30 samples respectively for each truck. The results for each operational phase of the study were analyzed by Student’s t-test for independent samples at 5% probability.
3. RESULTS AND DISCUSSION
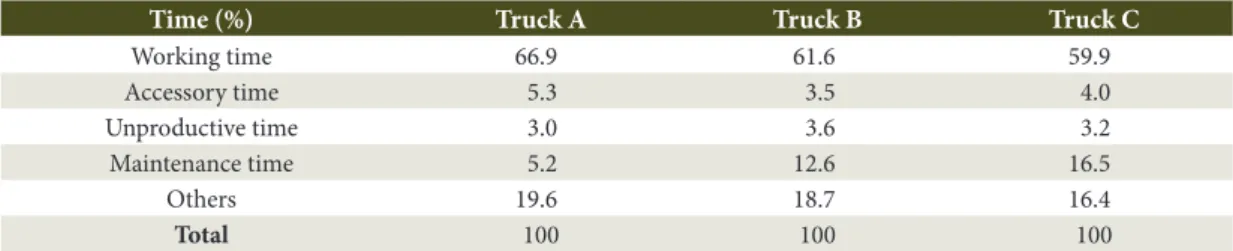
For the time and movement study, the results for each cycle were evaluated to obtain samples for the study aims, responding to 95% of the actual and normal operation (Table 2).
In relation to the productive time for the operations performed, Truck A presented a higher percentage
when compared to the other trucks, followed by Trucks B and C. Therefore, Truck A showed better effective working time usage.
For accessory time, there are some measures that must be improved, such as the time spent maneuvering, which the driver must perform due to inadequate wood stacking by workers responsible for harvesting and stacking logs.
The unproductive time totaled 3% of the total observed time. Therefore, if this limitation was totally or partially reduced, the next steps would be partially optimized and operational efficiency would be gained. 2.5% of the wasted time came from pauses without any operational justification.
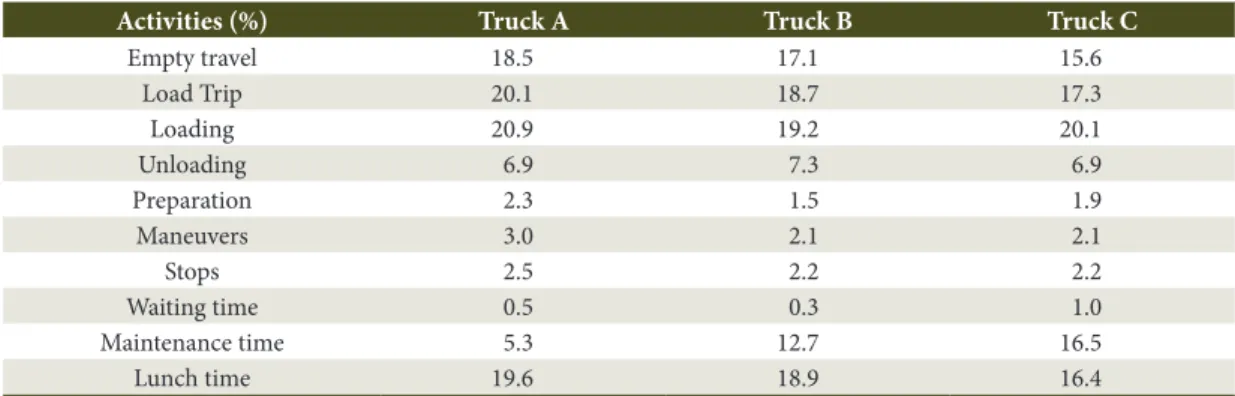
The operational times were subdivided to be able to observe the time spent in each operational phase to better understand the results and analyses (Table 3).
The loading time was one of the main limiting points during the effective operation. Proper stacking of the logs to facilitate loading is not usually realized, making work more difficult.
Loading time consumed a higher percentage of time when compared to the other phases, consuming on average 20.1% of the total trip time. Waiting time only represented 0.4% of the total time. This shows an optimized process, which was due to the operator’s ability and experience, stacking the logs in an adequate manner on the truck, as the evaluated drivers. The logs in the loading areas were organized in a way that facilitated loading, which helps the crane operator achieve greater efficiency. Also, there were stops without operational justification within the unproductive times, totaling 2.2% of total time.
In a study performed by Nurminen & Heinonen (2007) on forest road transportation in Finland, the loaded (33%) and empty (19%) travel times obtained, totaled approximately half the operational cycle. In forestry
Table 2. Distribution of the times for the trucks analyzed in the study.
Time (%) Truck A Truck B Truck C
Working time 66.9 61.6 59.9
Accessory time 5.3 3.5 4.0
Unproductive time 3.0 3.6 3.2
Maintenance time 5.2 12.6 16.5
Others 19.6 18.7 16.4
road transportation in Austria, Holzleitner et al. (2011) observed 21% in the loading phase and 7% for the unloading phase.
The unproductive or wasted time totaled 3.2% of the total observed time. If this limitation was totally or partially eliminated, operational efficiency would be obtained in theory, given that 2.2% of wasted time had no operational justification.
Preventive maintenance performed on trucks included oil changes and oil filters every 10 thousand km, and at most, corrective maintenance was performed due to a problem with the truck (differential, engine, gearbox, turbine) because wood activity in mountainous regions requires the maximum load of the truck.
After evaluating the times and movements, it is possible to confirm that Truck A was the most efficient, and Truck C was the least efficient, mainly due to longer maintenance times.
3.1. Average speed
Table 4 presents the average speed from loading to unloading the vehicle.
The liquid wood load transported was 20 tons on average. Truck C had the highest average speed, which can be explained due to it having a larger gearbox and a lower differential when compared to the other trucks, which allows it to attain a faster speed. In a study done to characterize wood road transportation in Southern Austria, Holzleitner et al. (2011) verified an average speed of 13.5 km.h-1 when travelling 51km
average distance (14.2% of the roads were not paved). This value was lower than the one found in this study.
According to a Student’s t-test with 5% probability, the average speed was similar for all the trucks, as shown in Table 5.
Table 5 shows that the average speed of the trucks evaluated in this study did not differ statistically, probably because the poor road conditions did not allow for better performance of the trucks, which meant that no truck was able to perform better than the rest.
3.2. Comparison among the truck models
Based on the studies performed individually for each truck, it is possible to establish a comparison between the main impact factors of the wood transportation operation (Table 6).
The highest mechanical availability was found for Truck A (93.2%) with an 89.9% utilization degree and 83.9% operation efficiency.
An increase in mechanical availability implies a reduction in the number of occurred failures and their faster repair, improving work procedures and
Table 3. Stratification of time in percentages.
Activities (%) Truck A Truck B Truck C
Empty travel 18.5 17.1 15.6
Load Trip 20.1 18.7 17.3
Loading 20.9 19.2 20.1
Unloading 6.9 7.3 6.9
Preparation 2.3 1.5 1.9
Maneuvers 3.0 2.1 2.1
Stops 2.5 2.2 2.2
Waiting time 0.5 0.3 1.0
Maintenance time 5.3 12.7 16.5
Lunch time 19.6 18.9 16.4
Table 4. Average operating speed (km.h-1) of vehicles analyzed in the study.
Vehicles Empty (km.h-1)
Load (km.h-1)
Average (km.h-1)
Truck A 37.2 32.2 34.7
Truck B 34.2 30.8 32.5
Truck C 38.2 34.2 36.2
Table 5. Average speed (Km.h-1) of the analyzed vehicles.
Statistical interaction
Average 1 (km.h-1)
Average 2
(km.h-1) P-value
Truck A x B 34.70 32.50 0.245ns
Truck A x C 34.70 36.20 0.485ns
Truck B x C 32.50 36.20 0.069ns
logistics, as well as the interdependence factor (Fontes & Machado, 2014).
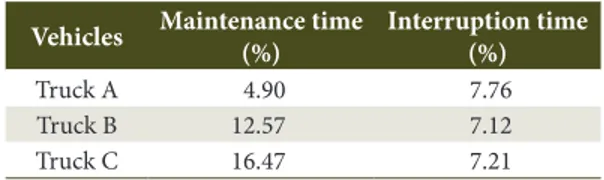
The maintenance time for Truck C had a higher impact on the total trip time, followed by Trucks B and A (Table 7).
Higher mechanical availability and operational efficiency were shown by Truck A, as it had lower maintenance time than the other trucks. Truck C presented the highest maintenance time.
Due to its being relatively new in comparison with the other trucks (produced in 2014), Truck C should have presented more adequate outcomes in the forest transportation activity. However, tts design and design conditions were probably not adapted to the conditions of forestry work.
Conducting studies that aim to reduce unproductive time and maintenance time can optimize the logistics for every process, since it was observed that the trucks were idle due to a lack of broader planning by sawmill management, and for corrective maintenance that could be minimized if preventive measures were taken.
4. CONCLUSIONS
According to the results found, it is possible to conclude that:
- The long maintenance time seriously hampered the operation performance of Truck C, with it being the least effective;
- Despite the fact that the Truck C had a slightly faster average speed than the others (36.2km/h), there was no statistical difference;
- Higher mechanical availability was found for Truck A (93.2%), followed by B (84.3%) and C (79.8%);
- Truck B had a higher utilization degree (91.8%), with a low variation in Trucks C (90%) and A (89.9%);
- The highest operational efficiency was found in Truck A (83.9%), followed by B (77.4%) and C (71.8%).
Thus, the most suitable self-loading truck for operations in mountainous regions is model A due to its higher load capacity and better performance indicators.
ACKNOWLEDGEMENTS
The Federal University of Espírito Santo (UFES) and the Founding of Support for the Research and Innovation of the Espírito Santo (FAPES) for the granting of scholarships and for acquisition of the necessary subjects for research.
SUBMISSION STATUS
Received: 3 aug., 2017 Accepted: 12 sep., 2017
CORRESPONDENCE TO
Nilton Fiedler
Departamento de Ciências Florestais e da Madeira, Universidade Federal do Espírito Santo – UFES
Av. Gov. Lindemberg, 316, Centro,
CEP 29550-000, Jerônimo Monteiro, ES, Brasil e-mail: [email protected]
FINANCIAL SUPPORT
Founding of Support for the Research and Innovation of the Espírito Santo (FAPES).
REFERENCES
Alves RT. Análise técnica e de custos do transporte florestal rodoviário (dissertação). Jerônimo Monteiro: Universidade Federal do Espírito Santo; 2011.
Table 6. Comparison of the trucks used in transportation (%).
Vehicles
Mechanical Availability
(%)
Utilization Degree
(%)
Operational efficiency
(%)
Truck A 93.2 89.9 83.9
Truck B 84.3 91.8 77.4
Truck C 79.8 90.0 71.8
Table 7. Comparison of transportation vehicles according to the maintenance and interruption times.
Vehicles Maintenance time (%)
Interruption time (%)
Truck A 4.90 7.76
Truck B 12.57 7.12
Barnes RM. Estudo de movimentos e de tempos: projeto e medida do trabalho. São Paulo: Editora Blucher; 1977. 635 p.
Confederação Nacional dos Transportes – CNT. Plano CNT de transporte e logística. Brasília: CNT; 2013.
Empresa Brasileira de Pesquisa Agropecuária – EMBRAPA.
Sistema Brasileiro de Classificação de Solos. Rio de Janeiro: Embrapa - Solos; 2006. 306 p.
Fontes JM, Machado CC. Manutenção mecânica. In: Machado CC, editor. Colheita florestal. Viçosa: UFV; 2014. p. 261-309.
Holzleitner F, Kanzian C, Stampfer K. Analyzing time and fuel consumption in road transport of round wood with an onboard fleet manager. European Journal of Forest Research 2011; 130(2): 293-301. http://dx.doi.org/10.1007/ s10342-010-0431-y.
Machado CC, Lopes ES, Birro MH. Elementos básicos do transporte florestal rodoviário. 2. ed. Viçosa: UFV; 2009. 167 p.
Machado CC, Lopes ES. Análise da influência do comprimento de toras de eucalipto na produtividade e custo da colheita e transporte florestal. Cerne 2000; 6(2), 124-129.
Nurminen T, Heinonen J. Characteristics and time consumption of timber trucking in Finland. Silva Fennica
2007; 41(3): 471-487. http://dx.doi.org/10.14214/sf.284.
Rodrigues, P. Introdução aos sistemas de transporte no Brasil e à logística internacional. 4. ed. São Paulo: Aduaneiras; 2010. 243 p.
Seixas F. Uma metodologia de seleção e dimensionamento da frota de veículos rodoviários para o transporte principal de madeira (tese). São Carlos: Universidade de São Paulo; 1992.
Tromborg E, Sjolie H, Solberg B, Hovi IB, Madslien A, Veisten K. Economic and environmental impacts of transport cost changes on timber and forest product markets in Norway.