the Excised Genomic Island PPHGI-1 from
Pseudomonas
syringae
pv.
phaseolicola
Scott A. C. Godfrey1, Helen C. Lovell1, John W. Mansfield2, David S. Corry1, Robert W. Jackson3, Dawn L. Arnold1*
1Faculty of Health and Life Sciences, University of the West of England, Bristol, United Kingdom,2Department of Life Sciences, Imperial College London, London, United Kingdom,3School of Biological Sciences, University of Reading, Reading, United Kingdom
Abstract
Pseudomonas syringaepv.phaseolicolais the causative agent of halo blight in the common bean, Phaseolus vulgaris.P. syringaepv.phaseolicolarace 4 strain 1302A contains the avirulence geneavrPphB(syn.hopAR1), which resides on PPHGI-1, a 106 kb genomic island. Loss of PPHGI-1 fromP. syringaepv.phaseolicola1302A following exposure to the hypersensitive resistance response (HR) leads to the evolution of strains with altered virulence. Here we have used fluorescent protein reporter systems to gain insight into the mobility of PPHGI-1. Confocal imaging of dual-labelledP. syringaepv.phaseolicola 1302A strain, F532 (dsRFP in chromosome and eGFP in PPHGI-1), revealed loss of PPHGI-1::eGFP encoded fluorescence during plant infection and when grownin vitroon extracted leaf apoplastic fluids. Fluorescence-activated cell sorting (FACS) of fluorescent and non-fluorescent PPHGI-1::eGFP F532 populations showed that cells lost fluorescence not only when the GI was deleted, but also when it had excised and was present as a circular episome. In addition to reduced expression of eGFP, quantitative PCR on sub-populations separated by FACS showed that transcription of other genes on PPHGI-1 (avrPphBandxerC) was also greatly reduced in F532 cells harbouring the excised PPHGI-1::eGFP episome. Our results show how virulence determinants located on mobile pathogenicity islands may be hidden from detection by host surveillance systems through the suppression of gene expression in the episomal state.
Citation:Godfrey SAC, Lovell HC, Mansfield JW, Corry DS, Jackson RW, et al. (2011) The Stealth Episome: Suppression of Gene Expression on the Excised Genomic Island PPHGI-1 fromPseudomonas syringaepv.phaseolicola. PLoS Pathog 7(3): e1002010. doi:10.1371/journal.ppat.1002010
Editor:David Guttman, University of Toronto, Canada
ReceivedOctober 1, 2010;AcceptedJanuary 29, 2011;PublishedMarch 31, 2011
Copyright:ß2011 Godfrey et al. This is an open-access article distributed under the terms of the Creative Commons Attribution License, which permits unrestricted use, distribution, and reproduction in any medium, provided the original author and source are credited.
Funding:This research was funded by the Biotechnology and Biological Sciences Research Council of the United Kingdom Grant (BB/E001998/1). The funders had no role in study design, data collection and analysis, decision to publish, or preparation of the manuscript.
Competing Interests:The authors have declared that no competing interests exist. * E-mail: [email protected]
Introduction
The exchange of genomic pathogenicity islands by horizontal gene transfer is recognised as a key factor in the development of new more virulent bacterial pathogens of both animals and plants [1,2,3,4].Pseudomonas syringaeis a bacterial species sub-divided into pathovars based on host range. Infection of a wide variety of plants results in necrotic symptoms in leaves, stems, and fruit [5]. P. syringaepv.phaseolicolacauses halo-blight of common bean and has emerged as a model bacterial pathogen for the analysis of the evolution of pathogenicity [6,7,8,9].
The primary mechanism of plant resistance againstP. syringaeis a basal defense response that is induced upon detection of conserved microbe associated molecular patterns (MAMPS) [10]. Pathovars of P. syringae are able to overcome MAMP triggered defense by delivering into the plant cytoplasm an array of effector proteins that inactivate surveillance mechanisms and signal transduction pathways, thereby allowing bacterial multiplication [11,12,13]. Many plants have evolved resistance proteins that recognise a subset of these effector proteins, termed avirulence (Avr) proteins, which trigger a hypersensitive resistance response (HR) leading to programmed cell death at infection sites and the restriction of colonisation [14,10].
Molecular analysis of genetic interactions betweenP. syringaepv. phaseolicola and its host bean has led to the identification and characterization of a number of bacterialavr genes and plantR genes [7]. One of theseavrgenes,avrPphB(syn.hopAR1), encodes an effector protein that induces an HR in bean cultivar (cv.) Tendergreen (TG) which carries the R3 resistance gene. In P. syringaepv.phaseolicolastrain 1302A,avrPphBis located on a 106 kb genomic island (GI) designated PPHGI-1 [6]. The similarity of PPHGI-1 to other integrative and conjugative elements (ICElands) suggests that the island integrates and excises atattsites within the tRNA locus found at its borders, via an episomal circular intermediate [15,16]. PPHGI-1 can be acquired by transformation between strains ofP. syringaepv.phaseolicola[17] and is physically lost from cells ofP. syringaepv.phaseolicoladuring infection of TG undergoing the R3-AvrPphB mediated HR [18,6]. Following excision from the chromosome, a critical step in the mobilization of PPHGI-1 is formation of the circular episome that is capable of limited replication [17,19].
fluid forin plantasurvival and multiplication. We have previously shown that complete PPHGI-1 transfer can occur between P. syringaepv.phaseolicola1302A andP. syringaepv.phaseolicola1448A, both in the leaf apoplast and in extracted P. vulgaris TG and Canadian Wonder (CW) apoplastic fluids [17]. We hypothesized that such a transfer requires four distinct processes: excision of the island from the chromosome, release of the circular episome from the bacterium, relocation into competent bacterial cells and finally integration into a specificattsite within the genome.
As GI movement is responsible for major evolution inP. syringae pv. phaseolicola [21,8], understanding the stages involved in GI transfer between bacterial strains will greatly aid our understand-ing of the evolutionary process. Although we know that exposure to the plant’s immune response activates excision and transfer of the PPHGI-1, there is no information available on the dynamics of island loss from colonies of bacteria within infected tissues. In order to address the spatial dynamics of excision in the context of the emergence of new strains of P. syringae pv. phaseolicola at microsites within infected tissues, we developed fluorescent protein-based systems to monitor the movement of PPHGI-1 in and out of the genome. In addition, using a combination of fluorescence-activated cell sorting and quantitative PCR, we found that gene expression from the excised PPHGI-1 episome was reduced so that absence of fluorescence did not reflect loss of the GI, but its excision and circularization. Switching off gene expression after excision of pathogenicity islands may be a widespread phenomenon allowing bacterial products to be hidden from host defenses and thereby facilitating ‘‘stealthy’’ transfer of genes encoding virulence factors that may be of benefit under new infection conditions.
Results and Discussion
Creation of dual-labelled fluorescentP. syringae pv. phaseolicolastrains
We aimed to visualise PPHGI-1 dynamics in the plant andin vitrousing constitutively expressed fluorescent markers. Strains of
P. syringae pv. phaseolicola 1302A were generated expressing fluorescent proteins encoded from 1 (e.g. PPHGI-1::eGFP) and also from other regions of the chromosome as illustrated in Figure 1A.P. syringaepv.phaseolicolaF341 contained chromosomal eYFP and PPHGI-1::eCFP (Figure 1B) and P. syringae pv. phaseolicola F532 chromosomal dsRFP and PPHGI-1::eGFP (Figure 1C). Loss of PPHGI-1 was expected to lead to loss of the GI encoded fluorescence but retention of emission from the other fluorophore (Figure 1D, E).P. syringaepv.phaseolicola F341 and P. syringae pv. phaseolicola F532 also displayed wildtype P. syringaepv.phaseolicola1302A phenotypes; for examplein vitroand in plantagrowth rates, plasmid profiles, and equal rates of PPHGI-1 loss when passaged through TG (data not shown).
Confocal microscopy of dual-labelled fluorescent P. syringaepv.phaseolicolastrains in leaves
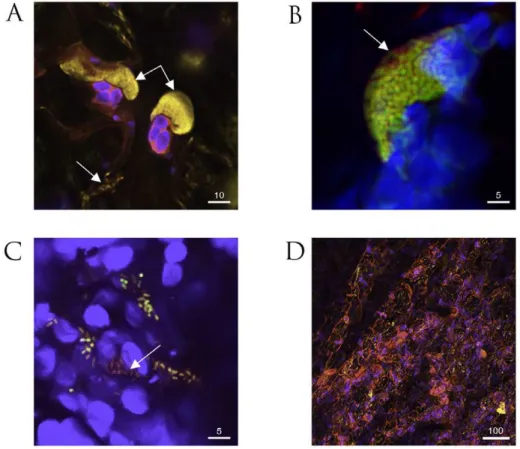
We have previously described the use of bacteria separately labeled with fluorophores for confocal microscopy of infected leaves [22]. With the strains constructed to express two fluorophores, we planned to follow loss of PPHGI-1 occurring at microsites within challenged leaves and in particular during the HR in TG. Colonies of P. syringaepv.phaseolicola develop in the intercellular spaces, typically attached to leaf mesophyll cells. A feature of tissue undergoing the HR in TG was the dispersal of colonies to reveal individual bacterial cells as illustrated in Fig. 2A. WhenP. syringae pv.phaseolicola F532 was infiltrated into TG or CW leaves, colonies frequently showed peripheral loss of PPHGI-1::eGFP fluorescence (Figure 2B). Dispersed bacterial cells of F532 in TG and around the cut edges of leaf samples in both cultivars also displayed mixed fluorescence (Fig. 2C). The loss of fluorescence from colonies was more easily detected in the susceptible variety CW, rather than resistant TG, because imaging whole colonies after the HR was partly compromised by the accumulation of autofluorescent plant-derived metabolites (Figure 2D, [22]). Limiting initial P. syringae pv. phaseolicola inoculum concentrations in TG was effective in minimizing the spread of the HR and was necessary to avoid spectral overlap of dsRFP and HR autofluorescence.
Our observations with F532 highlighted that the outer layer(s) of bacteria within established colonies (in both TG and CW leaves) preferentially exhibit loss of PPHGI-1::eGFP fluorescence. Such colony differentiation may be due to the activities of diffusion mediated gradients similar to those proposed in biofilm models [23], where the colony periphery receives higher concentrations of diffused substrates (e.g. nutrients, oxygen, environmental stimuli, and/or antimicrobial compounds) and therefore exhibits differing metabolic activity compared with the colony centre [24]. Higher rates of in planta loss of PPHGI-1::eGFP fluorescence from the periphery of F532 colonies may be due to higher levels of environmental cue(s) from theP. vulgarisapoplast and/or due to a higher metabolic activity due to enhanced nutrient acquisition. Significantly, loss of PPHGI-1 derived fluorescence appeared to be as frequent in the susceptible CW leaves as in the resistant TG which underwent the HR. By contrast, previous work had shown that cells that have lost PPHGI-1 are more readily selected during the HR than during the development of infection in susceptible tissues such as CW leaves [6,19].
Loss of eGFP fluorescence from F532 is observed in apoplastic fluids
Lovell et al. [17] demonstrated that apoplastic fluids extracted from leaves provide a medium that promotes the mobility of PPHGI-1. To determine if PPHGI-1::eGFP fluorescence was lost
Author Summary
Bacterial pathogens evolve rapidly through the transfer of large segments, or genomic islands (GIs), of DNA. We study the mobility of an island named PPHGI-1 inPseudomonas syringaepv.phaseolicolathat causes halo-blight disease of bean. The exposure ofP. syringaepv.phaseolicolato plant defenses triggers the excision of PPHGI-1, creation of a circular episomal form and finally deletion of the GI or its transfer to other bacteria. We planned to examine deletion of PPHGI-1 within infected leaves, and we generated strains that expressed differently coloured fluorescent proteins from genes in the island or elsewhere on the chromosome. Loss of the specific fluorescence derived from the GI was expected to show deletion of PPHGI-1. However, collecting fluorescent and non-fluorescent bac-teria showed that PPHGI-1 was usually not lost, but expressed its component genes very poorly when in the circularized state. Bacteria were therefore able to carry a hidden suite of genes that become activated when re-inserted into the chromosome. The ‘‘stealthy’’ movement of the island is beneficial to P. syringae pv. phaseolicola because genes on PPHGI-1 encode proteins that activate plant defenses. Similar gene silencing on episomes may occur in other pathogens and contribute to the evolution of microbial pathogenicity to animals and plants.
from F532 in vitro, the strain was grown on apoplastic fluids extracted from leaves of CW and TG, mixed with agarose and coated on microscope slides to facilitate microscopy. Fluorescence was lost rapidly from colonies grown on apoplastic fluids but not from M9-based media (Figure 3). Increasing the concentration of either CW or TG apoplastic fluid in the agarose slide medium caused a corresponding increase in the frequency of loss of fluorescence due to PPHGI-1::eGFP (Figure 3A). To confirm that loss of PPHGI-1 encoded fluorescence was not specific to strain F532, P. syringaepv.phaseolicola F341 was examined in the same way and rates of loss of PPHGI-1::eCFP were comparable to those found for PPHGI::eGFP in F532 (data not shown). Clearly, some component(s) of apoplastic fluid from either cultivar promoted loss of fluorescence of respectively labeled PPHGI-1 constructs, suggesting that the occurrence of the HR is not required for the release of inducing metabolites from plant cells.
Loss of PPHGI-1::eGFP fluorescence is not always due to loss of the GI from the bacterial cell
To determine whether or not changes in PPHGI-1::eGFP fluorescence were due to cellular loss of PPHGI::eGFP, F532 cells
were first grown on M9/TG agarose slides. Following confocal imaging to confirm loss of PPHGI-1::eGFP fluorescence from some cells but positive dsRFP fluorescence, bacteria from the imaged agarose slide were resuspended in J Ringers and cultured to individual colonies on KB agar. All resulting colonies were found to express eGFP. Furthermore, 200 colonies were analysed for the presence ofavrPphBby the TG pod-stab pathogenicity assay and all colonies were found to cause the HR. This suggested that, despite the temporary loss of expression of the PPHGI-1::eGFP construct after growth on apoplastic fluids, PPHGI-1 was retained and functional.
FACS separation ofP. syringaepv.phaseolicolaF532 populations based on eGFP fluorescence
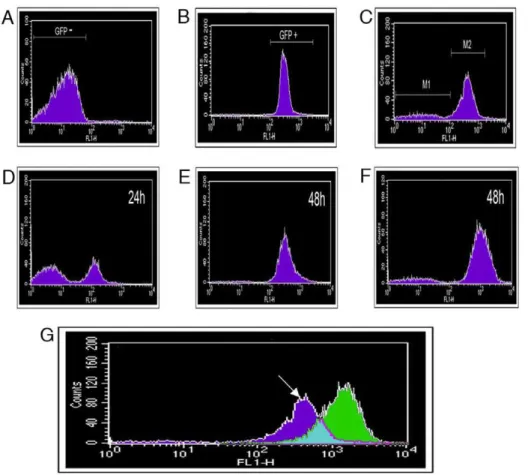
To investigate the apparent silencing of eGFP, fluorescence-activated cell sorting (FACS) was employed to obtain pure populations of F532 with or without eGFP fluorescence; F532/ GFP+and F532/GFP-, respectively (Figure 4). We first tested the suitability of FACs to differentiate the fluorescent Pseudomonads. Low background was recorded in 1302A without added fluorophores (Fig. 4A) but this did not compromise the strong signal from eGFP (Fig. 4B).
Figure 1. Generation of strains ofP. syringaepv.phaseolicola1302A tagged with fluorescent proteins. A. Introduction of constitutive fluorescent reporter genes separately into theP. syringaepv.phaseolicola1302A chromosome and PPHGI-1 genomic island to createB.P. syringaepv.
phaseolicolaF341 containing eYFP introduced into the chromosome upstream ofglmSusing a Tn7delivery system and eCFP within the non-coding region of PPHGI-1 andC.P. syringaepv.phaseolicolaF532 with dsRFP in the chromosome and eGFP in PPHGI-1.D. Schematic depiction of PPHGI-1 excision (with loss of GFP expression) fromP. syringaepv.phaseolicolaF532 within the plant environment withE. fluorescence detectable in channels R, dsRFP; G, eGFP and O, with overlapping channels. Loss of eGFP fuorescence would also report the deletion of PPHGI-1 from bacteria. Abbreviations are as follows: FP-1, fluorescent protein either eYFP or dsRFP; FP-2, fluorescent protein either eGFP or eCFP; TT, transcriptional terminators; NCR, non-coding region in PPHGI-1; ‘*’ denotes constitutive reporter expression.SpeI -AsiSI region is a secondary rare-cloning site. The position on PPHGI-1 of genes used in this study are avrPphB 17,471–18,274 bp and xerC 105,384–106,805 bp [6]. The genes for the fluorescent proteins have been inserted in non-coding region at position 55,660–56, 299 bp.
To collect eGFP fluorescing and non-fluorescent bacteria, F532 cultures were grown (48 h) in stationary M9/TG apoplastic fluid (1:1) broths and 200,000 particles (events) were collected for both F532/GFP+and F532/GFP- cells. Sub-populations were serially diluted and grown on KB+Gm and the viable cells recovered were: F532/GFP+ (2.646104CFU/ml) and F532/GFP- (1.066
104CFU/ml). The decrease in viable CFU/ml from F532/GFP-events compared to F532/GFP+ was likely due to detection of non-fluorescent particles, from either non-viable F532 cells and/or plant debris from apoplastic fluid.
The separated sub-populations of F532/GFP- and F532/GFP+
cells were monitored for further changes in PPHGI-1::eGFP fluorescence over a 48 h period (in LB, static at 25uC, Figs. 4C–F). If PPHGI-1::eGFP excision and re-insertion into the chromosome was a dynamic process, we expected to see a reversion of the F532/GFP- (Figure 4 C, M1) sample to form a major population of F532/GFP+cells, with a minor population of F532/GFP- cells. As predicted, F532/GFP- cells were observed to revert to a population of predominantly F532/GFP+cells (Figure 4D, E) over a 48 h period. Also, F532/GFP+cells from gated population M2 (Figure 4C) formed a sub-population of F532/GFP- cells (M1-like, Figure 4F) indicating the continued mobility of PPHGI-1::eGFP in F532. It is interesting that after 48 h both FACS sub-populations reverted back to the same general population structure (as in
Figures 4E and 4F) suggesting that there may be an equilibrium between F532 cells containing PPHGI-1 in the chromosome (expressing eGFP) and F532 cells containing the excised PPHGI-1 (not expressing eGFP).
Figure 4G illustrates the changes in patterns of sorted fluorescent particles comparing F532 grown in apoplastic fluid which produces a broader GFP detection spectrum than F532 grown in LB broth. This result correlates with different levels of PPHGI-1::eGFP fluorescence (whilst dsRFP remained constant) observed in F532 cells examined by confocal microscopy (e.g. Figure 3C).
qPCR reveals correlation between increased production of the circular episome of PPHGI-1 and decreased gene expression in F532/GFP- cells
We had shown that loss of PPHGI-1::eGFP fluorescence was often not due to the deletion of PPHGI-1 from F532. Therefore, we investigated whether down-regulation of gene expression occurs after GI excision and circularization, thereby accounting for loss of PPHGI-1::eGFP fluorescence. qPCR was performed on FACS separated F532 populations to determine differences between F532/GFP- and F532/GFP+cells by comparison of: a) the amount of PPHGI-1 forming a circular PPHGI-1 episome
Figure 2. Confocal microscopy of fluorescently labeledP. syringaepv.phaseolicola1302A strains in bean leaf tissue. A. Colonies ofP. syringaepv.phaseolicolaF341 expressing eYFP attached to mesophyll cells undergoing the HR (double arrow) and also dispersed individual bacteria (single arrow) in cv. Tendergreen (TG).B. Colony ofP. syringaepv.phaseolicolaF532 containing chromosomally expressed dsRFP and eGFP in the mobile GI, PPHGI-1, exhibit peripheral loss of eGFP fluorescence (arrow) in TG.C. Dispersed cells fromP. syringaepv.phaseolicolaF532 colonies in cv. Canadian Wonder (non-HR) include individuals without eGFP, but expressing chromosomally encoded dsRFP (arrowed). D. Severe R3-AvrPphB mediated hypersensitive response (HR) in TG in the presence ofP. syringaepv.phaseolicolaF341 (high inoculum, 86107CFU/ml) causes the release of numerous autofluorescent compounds (pink coloration). The autofluorescence of the HR compromises visualization of introduced fluorophores. All images were assigned false colours to represent selective emission detection (pink, auto fluorescence emission from collapsed plant tissue; blue, plant mesophyll cell chloroplast fluorescence; yellow, eYFP; green/yellow, overlay of co-expressingP. syringaepv.phaseolicolaF532 dsRFP and eGFP; and red, dsRFP emission only). All images were taken 72 h after inoculation. Size bars are given inmm.
doi:10.1371/journal.ppat.1002010.g002
(CE); and b) the expression levels of two genes contained within PPHGI-1 (avrPphBandxerC). Results reveal that there is increased formation of CE in F532/GFP- cells, but greatly reduced expression ofavrPphBandxerC(Figure 5). We conclude that loss of fluorescence from F532 does not, therefore, usually indicate loss of PPHGI-1, but is in fact reporting creation of the excisedCE from which gene expression is greatly reduced. Such reduced expression of GI genes could be explained by transcriptional and translational down-regulation due to supercoiling of DNA (Figures 1D & E) [25,26] and/or possible association of histone-like proteins influencing gene expression [27,28].
Frequency of occurrence of the circular episome
It is well established that PPHGI-1 is lost from 1302A cells during the HR in bean leaves. The antimicrobial conditions generated by the HR appear to select for bacteria lacking the avirulence gene avrPphB [6,21,19]. The first stage in deletion of PPHGI-1 is its excision from the chromosome and the formation of theCEthat was first detected by PCR in bacteria grown in LB [6,21,19]. Here we applied the more stringent method of qPCR to confirm the presence ofCEin F532/GFP- cells (Fig. 5). The high frequency of occurrence of bacteria down-regulating gene expression on PPHGI-1 detected in vitro in apoplastic fluids suggested that bacteria harbouring the excised episome might be far more common in certain environments. We therefore used qPCR to examine the levels of PPHGI-1 CE in bacteria grown under various conditions for 5 h (Fig. 6).
The experiment revealed strikingly higher levels ofCEin bacteria inoculated into bean leaves than grown in LB or minimal media. At the 5 h time point, however, there was no difference in CE concentration in resistant TG, or susceptible CW leaves. As expected,CE was present at high levels in bacteria incubated in apoplastic fluids. The highest amounts were found after growth in fluids recovered from leaves undergoing the HR and the lowest from susceptible, diseased tissue. The addition of whole leaf extracts to M9 also created conditions favouring formation of theCE.
Taken together these results suggest that excision of PPHGI-1 is promoted by a plant factor(s) but there is little differentiation between susceptible and resistant plant tissues before infection. The occurrence of the HR does appear to enhance excision and formation of the circular intermediate, but not to such an extent that would explain the high frequency of loss of PPHGI-1 during the HR [6]. We conclude thatP. syringaepv.phaseolicolaPPHGI-1 excision, circularisation and re-insertion is a very dynamic process necessary to maintain PPHGI-1 replication withinP. syringae pv. phaseolicola populations. This would explain the variance in detectable levels of PPHGI-1::eGFP fluorescence from adjacent cells during confocal imaging (e.g. Figure 3C) where images obtained are most likely ‘snapshots’ of F532 cells at different stages of PPHGI-1::eGFP excision. It is highly likely that the excision of PPHGI-1 may interfere with the timeline of eGFP transcription, translation, protein folding, maturation and degradation – all ultimately affecting the levels of PPHGI-1::eGFP fluorescence.
The reduced expression of genes on theCE, notablyavrPphB, would provide a selective advantage for the bacterial cells allowing their increased multiplication in resistant TG tissues and favouring subsequent selection of bacteria that had lost PPHGI-1. Alterna-tively, the multiplication of bacteria maintaining the silenced PPHGI-1 may prove advantageous should they be spread to other plants lacking the R3 resistance gene. The re-integration of PPHGI-1 into the chromosome would lead to a return to normal levels of expression of genes encoded on the GI.
In our previous work on the mobility of PPHGI-1 we used failure to induce the HR as an indication of loss of the island and confirmed this result by PCR-based diagnostics [6]. Our results on the suppression of gene expression from the circularised episome show that there is a complex pattern of selection occurring within the infected plant. Because we have demonstrated movement of the island both out of and back into the chromosome, there must be a resultant fluctuation in levels of expression of avrPphB. It would only be those bacteria that have physically lost PPHGI-1 that would retain virulence during colonisation and presumably
Figure 3. Confocal monitoring of fluorescence from PPHGI-1::eGFP inP. syringaepv.phaseolicola in vitro.P. syringaepv.phaseolicola
F532 was grown for 48 h on extracted Tendergreen apoplastic fluid (TG-apo) in agarose (1.4%).A. After 48 h, eGFP loss occurs fromP. syringaepv.
phaseolicolaF532 only in high concentrations of TG-apo mixed with M9 minimal medium, % relates to the amount of apoplastic fluid in the medium.
B.P. syringaepv.phaseolicolaF532 shows no loss of PPHGI-1::eGFP when grown on 100% M9 (0% apo) for 144 h.C. Illustrates how images were produced by recording the: red channel; green channel; and then overlaying the two channels. Close up images with lines denote cells with varying eGFP emission quantum yields compared with cells expressing only eGFP in the upper panel (Y, denotes yellow cells with equal emission levels of eGFP and dsRFP; O, denotes orange cells with reduced eGFP emission; and R, denotes red cells which have no detectable eGFP emission). Note that all cells present expressed dsRFP at equal intensity as in Ci. All images were assigned false colour (red, dsRFP; green, eGFP; yellow, overlay of dsRFP and eGFP); size bars, 5mm.
Figure 4. Fluorescence-activated cell sorting (FACS) separation ofP. syringaepv.phaseolicolacells based on fluorescent protein expression.Histograms record fluorescence detected by the FL1-H detector after analysis of 200,000 particles (events). Analysis ofA.P. syringaepv.
phaseolicola1302A grown in M9, 48 h.B.P. syringaepv.phaseolicolaSG248 with constitutive eGFP introduced chromosomally, grown in M9, 48 h. andC.P. syringaepv.phaseolicolaF532 grown in M9/TG apoplastic fluid (1:1) for 48 h. Gating was performed to collect equal populations of (M1)P. syringaepv.phaseolicolaF532 that did not express eGFP and (M2) eGFP expressingP. syringaepv.phaseolicolaF532. Gated subpopulations were then grown in LB to investigate changes in PPHGI-1::eGFP expression.D. Population M1, after incubation for 24 h, note the presence of eGFP fluorescing bacteria,E. M1 after 48 h andF. Population M2 after 48 h.G. An overlay of GFP detection from F532 grown in LB (Green) and F532 grown in M9/TG apoplastic fluid (1:1) for 48 h (dark blue). Counts refer to fluorescence intensity. The arrow denotes region corresponding to F532 cells with reduced PPHGI-1::eGFP expression. Similar background fluorescence was observed in all media.
doi:10.1371/journal.ppat.1002010.g004
Figure 5. Gene expression and circular episome detection in sub-populations ofP. syringaepv.phaseolicola.Analysis of FACS-separated sub-populations of F532 expressing GFP (F532/GFP+) and F532 without GFP fluorescence (F532/GFP-) shows: A. F532/GFP- has effectively no expression ofavrPphB,B.xerCexpression is also reduced in F532/GFP-; andC. PPHGI-1 circular episome formation is significantly greater in F532/GFP-cells than F532/GFP+cells. All data were standardized by simultaneous qPCR analysis ofgyrBexpression and error bars represent standard error of the mean of three experimental replicates. Letters above bars indicate significant differences at p,0.05 assessed with Student’s t test.
doi:10.1371/journal.ppat.1002010.g005
break out from sites undergoing the effector-triggered HR. In order to dissect the dynamics further we need to investigate the mechanisms controlling deletion of the island in more detail.
The initial aim of our work was to use confocal microscopy to examine PPHGI-1 deletion at micro-sites within infected leaves. We were only partially successful because of the suppression of gene expression from the excised episome. However, our findings may be of more general significance to our understanding of microbial pathogenicity. Dynamic excision and reinsertion of GIs has been described in otherPseudomonasspecies [29,30]. We suggest that the silencing of genes carried on GIs following excision from their chromosomal location may be an important strategy utilized not only by P. syringae pv. phaseolicola but also by other bacterial pathogens of plants and animals. Switching off gene expression after GI excision is a novel mechanism with an enormous biological potential. It may, for example, represent a new way to modulate gene expression to the pathogen’s advantage and to facilitate GI transfer. The microbes may have evolved a means to facilitate the ‘‘stealthy’’ transfer of genes encoding virulence factors that may be of benefit under new infection conditions
Materials and Methods
Bacterial strains, plasmids and culture media
Bacterial strains and plasmids used in this study are listed in Table 1.Escherichia colistrains were grown at 37uC in Luria Bertani (LB, Difco) media andPseudomonasstrains were grown at 25uC on Kings medium B (KB) [31], in LB broth or M9 minimal medium (M9,[32]). Antibiotics were used at the following concentrations (mg/ml): gentamicin (Gm) 10, kanamycin (Km) 50, ampicillin (Ap) 100, nitrofurantoin (NF) 100, and rifampicin (Rif) 100.
DNA isolation, PCR and plasmid extractions
Plasmid DNA was isolated from a pure bacterial culture using the QIAprep Spin Miniprep Kit (Qiagen) and restriction enzymatic digests performed as per manufacturers protocols (NEB biolabs). Unless stated otherwise, standard PCR reactions were performed using Phusion TM polymerase (NEB biolabs)
using recommended cycling parameters with oligonucleotide primers (Table S1). Automated DNA sequencing was performed with an ABI 3130xl genetic analyser. P. syringae pv. phaseolicola plasmid profiles were determined by extracting total uncut plasmid DNA from overnight cultures as described previously [33].
Insertion of eGFP/eCFP into PPHGI-1
Strand overlapping extension PCR [34] was used to introduce the rare cutting restriction enzyme sitesPmeI andPacI into a non-coding-region (NCR; 55667 bp – 56577 bp, Genbank accession AJ870974) of DNA within PPHGI-1 for introduction of eGFP or eCFP (Figure 1A). Three transcriptional terminators (TTs) in each translational frame were introduced upstream of PmeI and downstream ofPacI (Figure 1A). Overlapped PCR products were cloned into pK18mobsacB [35] to create pSG028-1. Both eGFP and eCFP were PCR amplified from AKN100 and AKN033 respectively using primers (F-pEXFP-PmeI and R-pEXP-PacI, Table S1) that were designed to introduced PmeI and PacI restriction sites respectively at amplicon terminal ends. PCR products were cloned into Zero-Blunt-Topo (Invitrogen) to create pSG097 (eGFP) and pSG103 (eCFP). PmeI and PacI digests of pSG097 and pSG103 were respectively cloned into similarly digested pSG028-1 to create pSG111-eGFP and pSG114-eCFP. Introduction of the eGFP (pSG111-eGFP) and eCFP (pSG114-eCFP) into the NCR of PPHGI-1 was achieved by allelic exchange [36] withP. syringaepv.phaseolicola1302A to create KmRfirst cross-over construct strains,P. syringaepv.phaseolicolaSG120 (eGFP) and P. syringaepv.phaseolicolaSG126 (eCFP). P. syringaepv.phaseolicola SG120 and P. syringaepv. phaseolicola SG126 were confirmed to have P. syringae pv. phaseolicola 1302A wild type phenotypes as described previously [6].
Chromosomal introduction of fluorescent proteins
dsRFP (AKN132, Table 1) and eYFP (AKN069) were introduced respectively intoP. syringaepv.phaseolicolaSG120 andP. syringaepv. phaseolicolaSG126 via the Tn7 transposon delivery system kindly provided by Lambertsenet al. [36] as described previously [22] to createP. syringaepv.phaseolicolaF341 (P. syringaepv.phaseolicola1302A
Figure 6. Environmental effects on the detection of the PPHGI-1 circular episome determined by qPCR.Abbreviations are as follows: LB, Luria Bertani medium; M9, minimal medium; TG, apoplastic fluid extracted fromP. vulgariscv. Tendergreen (TG); CW, apoplastic fluid extracted from
P. vulgariscv. Canadian Wonder (CW); HR, apoplastic fluid extracted from TG leaf undergoingR3-AvrPphB mediated HR; Disease, apoplastic fluid extracted from CW leaf undergoingP. syringaepv.phaseolicola1302A induced disease; Plant extract, homogenised TG leaf in M9;in planta,within eitherP. vulgarisTG or CW leaf after infiltration. qPCR was performed after 5 h incubationin vitroor after plant inoculation. All data were standardized by simultaneous qPCR analysis ofgyrBexpression and error bars represent standard error of the mean of three experimental replicates. Letters above bars indicate significant differences at p,0.05 assessed with Student’s t test.
with chromosomal eYFP and PPHGI-1::eCFP, Figure 1B) andP. syringaepv.phaseolicolaF532 (P. syringaepv.phaseolicola1302A with chromosomal dsRFP and PPHGI-1::eGFP, Figure 1C).
In plantaconfocal imaging and data collection
P. syringae pv. phaseolicola inoculations and in planta confocal imaging ofP. syringaepv.phaseolicolafluorescence inP. vulgariswas performed essentially as described previously [22]. Confocal visualisation ofin plantainfiltration of dual-labelled strains (F532 and F341) was performed on the Leica TCS-SP2-DM IRE2 confocal laser scanning microscope (Leica Microsystems Wetzlar GmbH) at 256 or 406 (objective magnification) for colony morphology and 636or 1006for visualisation of individual cell dispersal. Variable AOTF filters were used for the following fluorophores (excitation/emission): eYFP (514 nm/525–600 nm); eCFP (440 nm/465–495 nm); eGFP (488 nm/516–539 nm); dsRFP (568 nm/600–644 nm); and for plant autofluorescence (440 nm, 650–785 nm). Z-series imaging was performed at intervals of 0.3mm (individual cells) and 1mm (colonies). All confocal images were assigned false colour in images (eCFP cyan, eGFP green, eYFP yellow, dsRFP red and plant tissue blue). 1mm z-section scan intervals were used to ensure all bacterial fluorescence was analysed. Three 5 mm2 leaf samples were analysed from each variable and each sample had at least 12 random areas confocal imaged to ensure representative data.
P. syringaepv.phaseolicolagrowth and visualisation on agarose slides
Glass slides were layered with approximately 0.17 mm of agarose (2.2% final volume) containing desired liquid (ddH2O,
M9, or apoplastic fluid) and used immediately. Apoplastic fluid was extracted from 10 day old TG or CW bean leaves, infiltrated CW leaves undergoing disease or TG leaves undergoing the HR as described previously [17]. All apoplastic fluids were used immediately after preparation following filter-sterilization (0.2mm). Overnight cultures were washed and serially diluted in JRingers solution to OD600equivalent of: 161022, 1024, 1026,
or 1028. Inoculum droplets (10ml) were placed onto respective agarose slides and incubated within a sterile sealed container (containing high humidity) at 25uC for 24 h–144 h as required. The optimal micro-colony development was usually observed at 161024OD600after 24 h on M9/TG (1:1) apoplastic fluid. Cover
slips were added immediately prior to confocal imaging using the Zeiss Axiovert 200 in conjunction with the Ultraview FRET H rapid confocal imaging system (Perkin Elmer Instruments Ltd) as described previously [22].
Agarose recovery ofP. syringae pv.phaseolicolaF532 cells with loss of PPHGI-1::eGFP fluorescence
Slide preparations of P. syringae pv. phaseolicola F532 were inoculated (161024OD600) onto M9/TG slides for 48 h. Agarose Table 1.Bacterial strains and plasmids.
Name Genotype Reference
E. coli
39R861 Contains four plasmids used as molecular size standards – 154 kb, 66.2 kb, 37.6 kb and 7.2 kb [37]
TOPO Top10 E. colicloning strain Invitrogen
P. syringaepv.phaseolicola
1302A Wild type strain containing PPHGI-1 [5]
SG120 1302A-PPHGI-1::eGFP, KmR This study
SG126 1302A-PPHGI-1::eCFP, KmR This study
SG248 1302A::Tn7-eGFP, GmR [22]
F341 SG126 plus chromosomal Tn7-eYFP, GmR, KmR This study
F532 SG122 plus chromosomal Tn7-dsRFP, GmR, KmR This study
Plasmids
pRK2013 Helper plasmid for conjugation, KmR [38]
AKN033 Vector containing Tn7containing eCFP, ApR, GmR [39]
AKN069 Vector containing Tn7containing eYFP, ApR, GmR [39]
AKN100 Vector containing Tn7containing eGFP, ApR, GmR [39]
AKN132 Vector containing Tn7containing dsRFP, ApR, GmR [39]
pUXBF13 Helper plasmid for Tn7transposition functions, ApR [40]
pK18mobsacB suicide delivery vector containingsacB, KmR [35]
ZERO-BLUNT-TOPO Blunt end PCR cloning vector Invitrogen
pSG028-1 ZERO-BLUNT-TOPO+OE-PCR-RCR (containingPacI,PmeI,SpeI andAsiSI cloning sites) flanked by
HindIII-XbaI
This study
pSG068-9 pK18mobsacB+HindIII-XbaI cloned NCR::OE-PCR-RCS, (containingPacI,PmeI,SpeI andAsiSI cloning sites), KmR This study pSG097 PacI-PmeI flankedegfp(ex AKN100) amplicon cloned in ZERO-BLUNT-TOPO, KmR This study pSG103 PacI-PmeI flankedecfp(ex AKN033) amplicon cloned in ZERO-BLUNT-TOPO, KmR This study
pSG111 pSG068-9 containingPacI-PmeI cloned eGFP, KmR This study
pSG114 pSG068-9 containingPacI-PmeI cloned eCFP, KmR This study
ApR, RifR, KmRindicate resistance to ampicillin, gentamicin, and kanamycin respectively. doi:10.1371/journal.ppat.1002010.t001
slides were imaged using both dsRFP and eGFP channels to ensure P. syringae pv. phaseolicola F532 cells had loss of PPHGI-1::eGFP fluorescence (such as Fig. 3Av). Agarose from the imaged slide was immediately re-suspended intoJRingers by Eppendorf-pestle homogenization and vortex mixing. Extracts were serially diluted onto KB agar and incubated (25uC, 48 h). Resulting GmR colonies were replica plated onto KB vs. KB+Gm (to select for Tn7-dsRFP) and KB+Gm+Km (to select for Tn7-dsRFP and PPHGI-1::eGFP). After 48 h at 25uC, all colonies were visualised for eGFP fluorescence and subjected to TG pod-stab assay (to determine the presence of avrPphB, and therefore PPHGI-1) by analysis of HR/disease phenotype as described previously [6]
Fluorescence-activated cell sorting (FACS) separation of P. syringae pv.phaseolicolaF532 populations based on eGFP fluorescence
P. syringae pv. phaseolicola F532 was grown in broth cultures consisting of: M9/TG apoplastic fluid (1:1). 200,000 particles (events) were collected for both F532/GFP+and F532/GFP- and samples were serially diluted and plated onto KB+Gm to correlate FACS events with viable P. syringae pv.phaseolicola cell recovery. FACS was performed on either (1) a FACSVantage cell sorter (Becton Dickinson), equipped with a 488 nm argon laser; or (2) an Influx cell sorter (Becton Dickinson).P. syringaepv.phaseolicolaF532 cultures were separated based on GFP fluorescence (F532/GFP+) and non-GFP fluorescence (F532/GFP-). Both F532/GFP+ and F532/GFP- FACS sub-populations were analysed immediately using confocal microscopy to confirm status of eGFP and dsRFP fluorescence.
qPCR ofxerCandavrPphBexpression and circular episome (CE) production
qPCR was used to quantifyxerCand avrPphBexpression and PPHGI-1 CE production in vitro and in planta. P. syringae pv. phaseolicolastrains were added to respective growth medium (either LB, M9, apoplastic fluid and/or M9/apoplastic fluid mixes) and after 5 h, cells were harvested and gene expression stopped using RNA protect reagent (Qiagen, UK) or DNA lysis solution (Gentra Systems, UK). For quantification of xerC, avrPphB and gyrB expression, RNA was extracted using the RNAeasy kit (Qiagen, UK) followed by a second DNase step of 15 min at 37uC (Promega, UK). cDNA was synthesised using the TaqMan
Reverse Transcription Reagents kit (Applied Biosystems). For quantification of the PPHGI-1CE, DNA was extracted using the Puregene DNA isolation kit (Gentra Systems, UK). Triplicate samples were taken for each variable for cDNA/DNA synthesis, and each sample was analyzed twice in separate amplifications. cDNA and DNA were quantified using a Nanodrop spectropho-tometer (Thermo Scientific, USA) and adjusted to 100 ng/ml.
When gene expression was analysed after FACS separation, cells were sorted directly into either RNA protect reagent (Qiagen UK) or DNA lysis solution (Gentra Systems, UK) and RNA/DNA extracted as above. qPCR was performed on an ABI 7300 Real-Time PCR System (Applied Biosystems), calibrated using 7300 Real-Time PCR Systems Spectral Calibration kit (Applied Biosystems) and probes (Table S1) were labelled with 39 FAM and 59TAMRA TaqMan dyes. Reaction volume (25ml) consisted of 12.5ml TaqMan PCR mastermix (Applied Biosystems), 2ml each primer (10mM), 2ml probe (5mM) and 6.5ml RNase free water. Standard qPCR cycling conditions were 50uC for 2 min, 95uC for 10 min and 406cycles of 95uC for 15 sec followed by
60uC for 1 min. Results were analysed using ABI 7300 System SDS software (Applied Biosystems) and compared using JMP IN 7.0 statistical analysis software (www.jmpin.com). Average abun-dance of xerC and avrPphB RNA and CE DNA were expressed relative to levels ofgyrB.
Supporting Information
Table S1 Oligonucleotide primers used in this study. (DOC)
Acknowledgments
We thank Andrew Herman for FACS operation at Bristol University and Mark Silby for helpful contributions to this manuscript. This work was carried out under FERA licence number 217A/6185.
Author Contributions
Conceived and designed the experiments: SACG, JWM, HCL, RWJ, DLA. Performed the experiments: SACG, HCL, DSC, JWM. Analyzed the data: SACG, HCL, DLA. Contributed reagents/materials/analysis tools: SACG, DLA, JWM. Wrote the paper: JWM, SACG, DLA, HCL, RWJ.
References
1. Fischer W, Windhager L, Rohrer S, Zeiller M, Karnholz A, et al. (2010) Strain-specific genes ofHelicobacter pylori: genome evolution driven by a novel type IV secretion system and genomic island transfer. Nucleic Acids Res 38: 6089–101. 2. Paauw A, Leverstein-van Hall MA, Verhoef J, Fluit AC (2010) Evolution in Quantum Leaps: Multiple Combinatorial Transfers of HPI and Other Genetic Modules inEnterobacteriaceae. PLoS ONE 5: e8662.
3. Juhas M, van der Meer JR, Gaillard M, Harding RM, Hood DW, et al. (2009) Genomic islands: tools of bacterial horizontal gene transfer and evolution. FEMS Microbiol Rev 33: 376–93.
4. Barash I, Manulis-Sasson S (2009) Recent evolution of bacterial pathogens: the gall-forming Pantoea agglomerans case. Annu Rev Phytopathol 47: 133–52. 5. Taylor JD, Teverson DM, Allen DJ, Pastor-Corrales MA (1996) Identification
and origin of races ofPseudomonas syringaepv.phaseolicolafrom Africa and other bean growing areas. Plant Pathol 45: 469–478.
6. Pitman AR, Jackson RW, Mansfield JW, Kaitell V, Thwaites R, et al. (2005) Exposure to host resistance mechanisms drives evolution of bacterial virulence in plants. Curr Biol 15: 2230–2235.
7. Mansfield JW (2009) From bacterial avirulence genes to effector functions via the
hrpdelivery system: an overview of 25 years of progress in our understanding of plant innate immunity. Mol Plant Pathol 10: 721–34.
8. Guttman DS (2009) Bacterial Evolution: Dynamic Genomes and the Power of Transformation. Curr Biol 19: R857–859.
9. Vencato M, Tian F, Alfano JR, Buell CR, Cartinhour S, et al. (2006) Bioinformatics-enabled identification of the HrpL regulon and type III secretion
system effector proteins ofPseudomonas syringaepv.phaseolicola1448A. Mol Plant Microbe Interact 19: 1193–206.
10. Jones JDG, Dangl JL (2006) The plant immune system. Nature Rev 444: 323–329.
11. Cunnac S, Lindeberg M, Collmer A (2009)Pseudomonas syringaetype III secretion system effectors: repertoires in search of functions. Curr Opin Microbiol 12: 53–60.
12. Kvitko BH, Park DH, Vela´squez AC, Wei CF, Russell AB, et al. (2009) Deletions in the repertoire ofPseudomonas syringaepv.tomatoDC3000 type III secretion effector genes reveal functional overlap among effectors. PLoS Pathog: e1000388.
13. Lindeberg M, Cartinhour S, Myers CR, Schechter LM, Schneider DJ, et al. (2006) Closing the circle on the discovery of genes encoding Hrp regulon members and type III secretion system effectors in the genomes of three model
Pseudomonas syringaestrains. Mol Plant Microbe Interact 19: 1151–8. 14. Alfano JR, Collmer A (2004) Type III secretion system effector proteins: Double
agents in bacteria disease. Annu Rev Phytopathol 42: 385–414.
15. Hacker J, Carniel E (2001) Ecological fitness, genomic islands and bacterial pathogenicity: A Darwinian view of the evolution of microbes. EMBO Rep 2: 376–381.
16. Van der Meer JR, Sentchilo V (2003) Genomic islands and the evolution of catabolic pathways in bacteria. Curr Opin Biotechnol 14: 248–254. 17. Lovell HC, Mansfield JW, Godfrey SAC, Jackson RW, Hancock JT, et al. (2009)
18. Jackson RW, Mansfield JW, Arnold DL, Sesma A, Paynter CD, et al. (2000) Excision from tRNA genes of a large chromosomal region, carryingavrPphB, associated with race change in the bean pathogen, Pseudomonas syringae pv.
phaseolicola. Mol Microbiol 38: 186–197.
19. Lovell HC, Jackson RW, Mansfield JW, Godfrey SAC, Hancock JT, et al. (2011) In planta conditions induce genomic changes inPseudomonas syringaepathovar
phaseolicola. Mol Plant Pathol 12: 167–76.
20. Rico A, Preston GM (2008) Pseudomonas syringae pv. tomato DC3000 uses constitutive and apoplast-induced nutrient assimilation pathways to catabolize nutrients that are abundant in the tomato apoplast. Mol Plant Microbe Interact 21: 269–282.
21. Arnold DL, Jackson RW, Waterfield NR, Mansfield JW (2007) Evolution of microbial virulence: the benefits of stress. Trends Genet 23: 293–300. 22. Godfrey SAC, Mansfield JW, Corry DS, Lovell HC, Jackson RW, et al. (2010)
Confocal Imaging ofPseudomonas syringaepv.phaseolicolaColony Development in Bean Reveals Reduced Multiplication of strains containing the Genomic Island PPHGI-1. Mol Plant Microbe Interact 23: 1294–1302.
23. Stewart PS (1996) Theoretical aspects of antibiotic diffusion into microbial biofilms. Antimicrob Agents Chemother 40: 2517–2522.
24. Stoodley P, Sauer K, Davies DG, Costerton JW (2002) Biofilms as Complex Differentiated Communities. Annu Rev Microbiol 56: 187–209.
25. Cro´inı´n TO´ , Carroll RK, Kelly A, Dorman CJ (2006) Roles for DNA supercoiling and the Fis protein in modulating expression of virulence genes during intracellular growth of Salmonella enterica serovar Typhimurium. Mol Microbiol 62: 869–882.
26. Dorman CJ, Bhriain NN, Higgins CF (1990) DNA supercoiling and environmental regulation of virulence gene expression in Shigella flexneri. Nature 344: 789–792.
27. Dorman CJ, Deighan P (2003) Regulation of gene expression by histone-like proteins in bacteria. Curr Opin Genet Dev 13: 179–184.
28. Dorman CJ (2004) H-NS: A Universal Regulator for a Dynamic Genome. Nat Rev Microbiol 2: 391–400.
29. Kiewitz C, Larbig K, Klockgether J, Weinel C, Tummler B (2000) Monitoring genome evolutionex vivo: reversible chromosomal integration of a 106 kb
plasmid at two tRNALys gene loci in sequentialPseudomonas aeruginosaairway isolates. Microbiology 146: 2365–2373.
30. Sentchilo V, Czechowska K, Pradervand N, Minoia M, Miyazaki R, et al. (2009) Intracellular excision and reintegration dynamics of the ICEclcgenomic island ofPseudomonas knackmussiisp. strain B13. Mol Microbiol 72: 1293–1306. 31. King EO, Ward MK, Raney DE (1954) Two simple media for the
demonstration of pyocyanin and fluorescen. J Lab Clin Med 44: 301–307. 32. Sambrook J, Fritsch EF, Maniatis T (1989) Molecular cloning: a laboratory
manual. USA: Cold Spring Harbor Laboratory Press.
33. Moulton PJ, Vivian A, Hunter PJ, Taylor JD (1993) Changes in cultivar-specificity toward pea can result from transfer of plasmid RP4 and other incompatibility group P1 replicons to Pseudomonas syringae pv. pisi. J Gen Microbiol 139: 3149–3155.
34. Horten RM, Hunt HD, Ho SN, Pullen JK, Pease LR (1989) Engineering hybrid genes without the use of restriction enzymes: gene splicing by overlap extension. Gene 77: 61–68.
35. Scha¨fer A, Tauch A, Ja¨ger W, Kalinowski J, Thierbach G, et al. (1994) Small mobilizable multi-purpose cloning vectors derived from theE. coli plasmids pK18 and pK19: selection of defined deletions in the chromosome of
Corynebacterium glutamicum. Gene 145: 69–73.
36. Lambertsen L, Sternberg C, Molin S (2004) Mini-Tn7 transposons for site-specific tagging of bacteria with fluorescent proteins. Environ Microbiol 6: 726–732.
37. Threlfall EJ, Hall ML, Rowe B (1986) Salmonella gold-coast from outbreaks of food-poisoning in the British Isles can be differentiated by plasmid profiles. J Hyg (Lond) 97: 115–22.
38. Figurski DH, Helinski DR (1979) Replication of an origin-containing derivative of plasmid RK2 dependent on a plasmid function derived in trans. Proc Natl Acad Sci USA 76: 1648–1652.
39. Lambertsen L, Sternberg C, Molin S (2004) Mini-Tn7 transposons for site-specific tagging of bacteria with fluorescent proteins. Environ Microbiol 6: 726–32.
40. Bao Y, Lies DP, Fu H, Roberts GP (1991) An improved Tn7-based system for the single-copy insertion of cloned genes into chromosomes of gram-negative bacteria. Gene 109: 167–8.