Sphingosine-1-Phosphate Induces
Dose-Dependent Chemotaxis or Fugetaxis of T-ALL
Blasts through S1P1 Activation
Carolina V. Messias1, Eliane Santana-Van-Vliet1, Julia P. Lemos1, Otacilio C. Moreira2, Vinicius Cotta-de-Almeida1, Wilson Savino1, Daniella Arêas Mendes-da-Cruz1*
1Laboratory on Thymus Research, Oswaldo Cruz Institute, Oswaldo Cruz Foundation, Rio de Janeiro, Rio de Janeiro, Brazil,2Laboratory of Molecular Biology and Endemic Diseases, Oswaldo Cruz Institute, Oswaldo Cruz Foundation, Rio de Janeiro, Rio de Janeiro, Brazil
Abstract
Sphingosine-1-phosphate (S1P) is a bioactive sphingolipid involved in several physiological processes including cell migration and differentiation. S1P signaling is mediated through five G protein-coupled receptors (S1P1-S1P5). S1P1 is crucial to the exit of T-lymphocytes from the thymus and peripheral lymphoid organs through a gradient of S1P. We have previ-ously observed that T-ALL and T-LBL blasts express S1P1. Herein we analyzed the role of S1P receptors in the migratory pattern of human T-cell neoplastic blasts. S1P-triggered cell migration was directly related to S1P1 expression. T-ALL blasts expressing low levels of S1P1 mRNA (HPB-ALL) did not migrate toward S1P, whereas those expressing higher lev-els of S1P1 (MOLT-4, JURKAT and CEM) did migrate. The S1P ligand induced T-ALL cells chemotaxis in concentrations up to 500 nM and induced fugetaxis in higher concentrations
(1000–10000 nM) through interactions with S1P1. When S1P1 was specifically blocked by
the W146 compound, S1P-induced migration at lower concentrations was reduced, whereas higher concentrations induced cell migration. Furthermore, we observed that S1P/ S1P1 interactions induced ERK and AKT phosphorylation, and modulation of Rac1 activity. Responding T-ALL blasts also expressed S1P3 mRNA but blockage of this receptor did not modify migratory responses. Our results indicate that S1P is involved in the migration of T-ALL/LBL blasts, which is dependent on S1P1 expression. Moreover, S1P concentrations in the given microenvironment might induce dose-dependent chemotaxis or fugetaxis of T-ALL blasts.
Introduction
Sphingosine-1-phosphate (S1P) is a membrane-derived lipid produced by mast cells, endothe-lial cells [1], pericytes [2] and especially by activated platelets and erythrocytes [3]. This lipid is produced by an enzymatic cascade of sphingolipids through phosphorylation of sphingosine by sphingosine kinase 1 or 2 (SphK1 and SphK2) [4,5]. S1P is involved in several physiological
OPEN ACCESS
Citation:Messias CV, Santana-Van-Vliet E, Lemos JP, Moreira OC, Cotta-de-Almeida V, Savino W, et al. (2016) Sphingosine-1-Phosphate Induces Dose-Dependent Chemotaxis or Fugetaxis of T-ALL Blasts through S1P1 Activation. PLoS ONE 11(1): e0148137. doi:10.1371/journal.pone.0148137
Editor:Neil A. Hotchin, University of Birmingham, UNITED KINGDOM
Received:October 15, 2015
Accepted:January 13, 2016
Published:January 29, 2016
Copyright:© 2016 Messias et al. This is an open access article distributed under the terms of the
Creative Commons Attribution License, which permits unrestricted use, distribution, and reproduction in any medium, provided the original author and source are credited.
Data Availability Statement:All relevant data are within the paper and its Supporting Information files.
Funding:This work was supported by CNPq, Faperj, Fiocruz, and FOCEM-Mercosur.
processes in the immune, cardiovascular and nervous systems, including cell proliferation, sur-vival, migration and differentiation, angiogenesis, inflammation and calcium homeostasis [6,
7]. Furthermore, S1P is involved in tumor progression [8], neoplastic cell proliferation [9–11], migration [12,13] as well as resistance to chemotherapeutic drugs [14,15].
S1P signaling is primarily mediated through five G protein-coupled receptors (S1P1-S1P5). S1P1, originally named EDG-1, was the first S1P receptor described and is the only S1P recep-tor exclusively coupled to Gi, being ubiquitously expressed. Its major functions are related to
vascular development and integrity, and to the mobility of different hematopoietic cells types (hematopoietic progenitors, T and B lymphocytes, natural killer T cells, dendritic cells, macro-phages, neutrophils, mast cells and osteoclasts) [7,16]. This mobility is associated with a gradi-ent of S1P since this lipid is found in higher concgradi-entrations in the blood and in lower amounts within lymphoid organs [3,17].
S1P1 is crucial to the exit of T lymphocytes from the thymus and peripheral lymphoid organs [18,19]. Mouse double-positive immature thymocytes (CD4+CD8+) express relatively low levels of S1P1, as compared with single-positive mature thymocytes (CD4+CD8-or CD4-CD8+) [18]. Single-positive thymocytes migrate toward S1P, a response that is no longer seen in thymocytes deficient in S1P1. Actually, S1P1-deficient thymocytes are able to differen-tiate in the thymus but are not able to leave the thymus, thus accumulating within the organ [18,19]. Moreover, mature T lymphocytes deficient in S1P1 are not seen in the blood or peripheral organs, and transplantation of these cells to normal mice leads to their accumulation in peripheral organs [19]. These data support the hypothesis that S1P1 is one of the major play-ers in the exit of T lymphocytes from lymphoid organs.
Similar to what has been seen in mice [18], we have recently reported that normal human double-positive thymocytes express less S1P1 than CD4 and CD8 single-positive thymocytes. Moreover, human thymocytes migrate toward S1P according to the expression levels of S1P1. This response is associated with early step events of cell migration such as actin polymerization. Interestingly, S1P1 is also expressed by human malignant T-cell precursors. Indeed, T-cell acute lymphoblastic leukemia (T-ALL) and T-cell lymphoblastic lymphoma (T-LBL) blasts express similar levels of S1P1 and migrate toward S1P [20]. As T-ALL/LBL present similar characteristics of normal T-lymphocyte precursors [21], they might also share mechanisms of migration and homing through S1P receptors. Considering the importance of T-ALL/LBL migration and spread during disease pathogenesis, we analyzed herein the role of different S1P concentrations in the migratory response of human T-cell lymphoblasts and the signaling pathways involved in S1P1 activation.
Materials and Methods
Antibodies and chemicals
Cell lines
T-cell acute lymphoblastic leukemia (HPB-ALL, MOLT-4, JURKAT, CEM) [22–25] and ana-plasic large lymphoma (SU-DHL-1) [26] were kindly provided by Dr. Vahid Asnafi (Assistance Publique-Hopitaux de Paris, Hopital Necker-Enfants Malades, Paris, France). Cell lines were cultured in RPMI-1640 (Sigma-Aldrich), pH 7–7.5, supplemented with 10% fetal bovine serum (Cultilab, Campinas, Brazil), 2 g/L sodium bicarbonate (Isofar, Rio de Janeiro, Brazil), 2 g/L HEPES (Sigma-Aldrich), 2 mg/ml ciprofloxacin at 37°C in an atmosphere containing 5% of CO2. MOLT-4 was the only cell line supplemented with 20% fetal bovine serum.
Real-time quantitative polymerase chain reaction (RQ-PCR)
mRNA was isolated from cells using RNase Mini Kit following the manufacturer’s instructions (Quiagen, Hilden, Germany). cDNA synthesis was done with 2μg of mRNA with Super Script
II RT (Invitrogen, Carlsbad, USA). S1P1 and ABL primers were designed using the Primer Express1
software (Applied Biosystems, Foster City, USA). S1P2, S1P3, S1P4 and S1P5 prim-ers were obtained from the literature [27]. S1P1 forward: GGCTCTCCGAACGCAACTT; S1P1 reverse: CAGGCTTTTTGTGTAGCTTTTCC; S1P2 forward: GCCATTGTGGTGG AAAACCTT; S1P2 reverse: CAGGTTGCCCAGAAACAGGTA; S1P3 forward: AGCGGC ACTTGACAATGATCA; S1P3 reverse: ACATCCCGATCAGGAGGAAGA; S1P4 forward: CCCTCTACTCCAAGCGCTACA; S1P4 reverse: CCATAGAGGCCCATGATGGT; S1P5 for-ward: TGAAGGAGTAGTTCCCGAAGG; S1P5 reverse: AAGCTTCTATGGCTCCCACCTC; ABL forward: TGGAGATAACACTCTAAGCATAACTAAAGGT; ABL reverse: GATGT AGTTGCTTGGGACCCA. RQ-PCR was performed with Syber1
Green PCR Master Mix (Applied Biosystems) on Step One Plus System (Applied Biosystems). Results were normalized by the gene control ABL, which is recommended by Europe Against Cancer Program for leuke-mia’s diagnosis [28]. Fold change analysis were done using HPB-ALL as calibrator and statisti-cal analysis was made withΔCt values.
Cell migration assays
Cells were serum-starved for 2 h and then treated or not with 100μM of W146
(Sigma-Aldrich) and/or 100μM BML-241 (Sigma-Aldrich) for 1 h at 37°C and 5% CO2atmosphere.
This treatment (using 2 x 10⁶cells per well) was performed in 100μl of RPMI- fatty acid free
BSA 0.1%. Migration assays were done in transwell chambers. Cell culture inserts of 8μm pore
size (Nunc, Roskilde, Denmark or Corning Costar, Cambridge, USA) were treated with PBS-fatty acid free BSA 0.1% for 45 min at 37°C under 5% CO2atmosphere. For chemotaxis assays,
2 x 10⁶cells in 300μl (inserts from Nunc) of migration medium (RPMI- fatty acid free BSA
0.1%) were added in the upper chambers and 500μl of the migration medium alone or
contain-ing S1P were added in the lower chamber. For fugetaxis assays, 2 x 10⁶cells in 100μl (inserts
from Corning Costar) of migration medium alone or containing S1P were added to the upper chamber and 600μl of migration medium alone were added to the lower chamber. For
check-erboard assays, 2 X 10⁶cells in 100μl (inserts from Corning Costar) of migration medium
alone or containing S1P were added to the upper chamber and 600μl of migration medium
Actin polymerization assays
Cells were serum-starved for 2 h and then treated or not with 100μM W146 for 1 h as detailed
above. After treatment, cells were incubated in RPMI/20 mM HEPES and S1P was added. At each indicated time point (15 s to 2 min), an aliquot was taken from the cell suspension and mixed with the labeling buffer, consisting in 10−7M FITC-phalloidin, 0.125 mg/ml
L-alpha-phosphatidylcholine palmitoyl, and 4.5% paraformaldehyde in PBS. Staining was analyzed by flow cytometry, and the mean fluorescence intensity (MFI) values obtained before addition of the ligand were arbitrarily set at 100%.
Cell stimulation
Serum-starved cells (2 x 10⁶) were centrifuged and ressuspended in RPMI- fatty acid free BSA 0.1% and S1P was added to the cell suspension and at each time point (1 to 60 min) and then washed with cold PBS.
Western Blot
Protein extraction was performed in 70μl of protease and phosphatase cocktail
(Sigma-Aldrich) with aid of a 1 ml syringe coupled to a needle immediately after cell stimulation. Total protein content was determined in Qubit fluorometer (Invitrogen) following manufacturer's recommendations. Proteins were resolved by Bolt 4–12% Bis-Tris Plus Gel (Novex, Carlsbad, USA) and transferred by iBlot1Dry Blotting System (Invitrogen) to nitrocellulose mem-branes. Membranes were blocked with 5% non-fat milk in tris-buffered saline with tween 20 (TBST) for 2 h at room temperature. The membranes were then labeled with AKT, anti-pAKT, anti-p44/42 MAPK or anti-phospho-p44/42 antibodies (1:1000) diluted in 2,5% non-fat milk in TBST for 2 h at room temperature. After incubation, membranes were washed twice for 10 min and twice for 5 min with TBST. Peroxidase-conjugated anti-rabbit or anti-mouse IgG were used as secondary antibodies (1:1000) and samples were incubated for 90 min at room temperature. Subsequently, membranes were washed again, incubated with Enhanced Chemiluminescence (ECL) Western Blotting Detection Reagents (Amersham, Buckingham-shire, UK) for 3 min at room temperature and exposed to Hyperfilm ECL (Amersham). When necessary, brightness and contrast adjustments were performed in the entire images.
Rac1 Activation assays
Rac-1 activity was assessed with Rac1 G-LISA Activation Assay Kit (Cytoskeleton, Inc., Den-ver, USA). Protein extraction and quantification were performed according to the manufac-turer's instructions immediately after cell stimulation. Rac activation signal was measured as absorbance levels using 490 nm filter. Optical density (OD) values obtained before addition of the ligand were arbitrarily set at 100%.
Statistical analyses
Results were analyzed by unpaired Student’sttest, One-way ANOVA followed by Tukey or
Dunnett post-test or Two-way ANOVA followed by Bonferroni post-test in GraphPad Prism 5. Differences were considered to be statistically significant when p<0.05 (or #),
Results
S1P receptors are expressed in T-ALL blasts
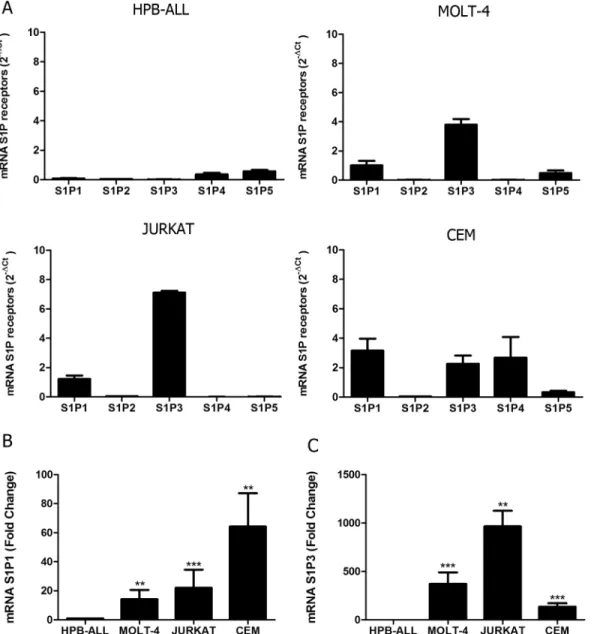
We first analyzed gene expression of all S1P receptors (S1P1-S1P5) in different T-ALL blasts by quantitative RT-PCR. We detected variable levels of the S1P receptors in the four cell lines studied. We observed that HPB-ALL cells mainly expressed S1P4 and S1P5 mRNA, whereas MOLT-4 cells showed a more intense expression of S1P1, S1P3 and S1P5. JURKAT cells pref-erentially expressed genes coding for S1P1 and S1P3. Except for S1P2, CEM cells expressed all other S1P receptors (Fig 1A).
Among S1P receptors, S1P1, S1P2 and S1P3 are the most studied. S1P1 and S1P3 are involved in inducing cell motility, while S1P2 is involved in the inhibition of this process [29].
Fig 1. S1P receptors mRNA expression in human T-ALL blasts. (A)Bars show S1P receptors mRNA expression analyzed by real time quantitative PCR, compared with the control Abelson (Abl) gene (2-ΔCt
) in T-ALL (n = 1–2, with 3–6 biological replicates).(B)Bars shows S1P1 or (C) S1P3 mRNA expression analyzed by real time quantitative PCR, compared with the control Abelson (Abl). Fold change analysis were done using HPB-ALL as calibrator to normalize the expression of the receptors on the other T-ALL blasts. Statistical analysis was made withΔCt values and significant differences are related to HPB-ALL cells. Results are expressed as mean±SEM and were analyzed by Student’sttest and differences were considered statistically significant when p<0.05 (*), p<0.01 (**) or p<0.001(***) (n = 1–2, with 3–6 biological replicates).
As HPB-ALL expressed very low levels of S1P1 and S1P3 we used this cells in order to normal-ize the expression of the receptors on the other T-ALL cell lines. We observed that S1P1 gene expression in MOLT-4, JURKAT and CEM cells was, respectively, 14, 22 and 64 times higher than in HPB-ALL cells (Fig 1B). Regarding S1P3, its expression was, respectively, 372, 965 and 136 times higher than HPB-ALL cells (Fig 1C).
Low S1P concentrations induced chemotactic migration of T-ALL blasts
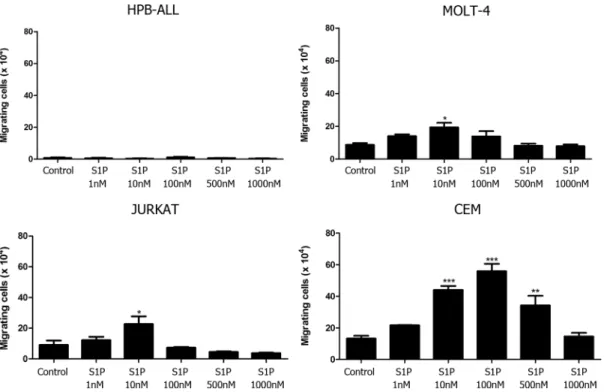
Functionally, we evaluated whether different concentrations of S1P could act as chemoattractant stimulus upon T-ALL cell lines. We observed that HPB-ALL cells, which express very low S1P1 mRNA levels, did not migrate toward S1P in any concentration used (1–1000 nM–Fig 2). Differ-ently, MOLT-4 and JURKAT cells, which express comparably moderate S1P1 amounts, migrated at low rates toward S1P 10 nM, but failed to migrate toward higher concentrations (500 and 1000 nM). CEM cells, which expressed higher S1P1 levels, migrated at a higher rate and respond to a wider concentration range of S1P (10, 100 and 500 nM) than MOLT-4 and JURKAT cells (Fig 2). When we compared the S1P-induced migration rate (10 nM) of the various T-ALL cells as a function of the corresponding S1P1 gene expression level, we noticed that the numbers of migrat-ing cells were higher for CEM cells and lower for MOLT-4 and JURKAT, suggestmigrat-ing that S1P1 mRNA expression is directly correlated with their migration capacity (S1 Fig).
S1P1 is involved in S1P-induced migration of T-ALL blasts
To investigate if the S1P-evoked migration occurred due to specific interactions between S1P/S1P1, cells were pre-treated with the W146 compound, a S1P1 specific inhibitor [30–
32]. Such pre-treatment inhibited the migration of MOLT-4 cells toward S1P 10 nM, whereas
Fig 2. Different S1P concentrations induce chemotactic responses of T-ALL blasts.T-ALL blasts were serum-starved for 2 h and inserted into Transwell™chambers with different S1P concentrations for 4 hours. Results are expressed as mean±SEM and were analyzed by One-way ANOVA,
followed by Tukey post-test. Differences were considered statistically significant when*p<0.05,**p<0.01 or***p<0.001 (n = 3).
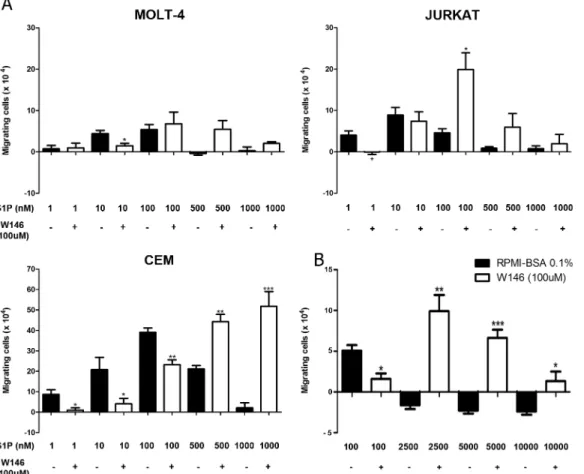
pre-treatment of JURKAT cells significantly inhibited migration toward S1P 1 nM, but not 10 nM. In the case of CEM cells, W146 blocked the migration in various S1P concentrations, namely 1, 10 and 100 nM (Fig 3A). These results suggest that migration induced by low con-centrations of S1P in T-ALL blasts is specifically mediated by S1P1.
Unexpectedly, JURKAT cells pre-treated with W146 migrated efficiently toward S1P 100 nM, but much less toward higher concentrations, such as 1000 nM. After CEM cell pre-treat-ment with the S1P1 blocker, we observed that S1P 500 and 1000 nM strongly induced cell migration (Fig 3A). We then enhanced S1P concentrations to investigate if even at higher con-centrations, CEM cells pre-treaded with W146 would still be able to migrate. As expected, we observed that S1P 2500, 5000 and 10000 nM did not induce cell migration. However, CEM cells pre-treated with W146 migrated toward S1P applied at 2500 and 5000 nM, but did not migrate when exposed to S1P 10000 nM (Fig 3B), where migration response returned to basal levels. Similar effect was observed with MOLT-4 cells pre-treated with W146, even though dif-ferences between pre-treated and non-treated cells were not statistically different for higher S1P concentrations, such as 100–1000 nM (Fig 3A). Together, our data indicate that the pre-treatment of the T-ALL blasts with W146 shifted the S1P dose/chemoattraction response
Fig 3. S1P1 is involved in S1P-driven chemotactic responses of T-ALL blasts.T-ALL blasts were serum-starved for 2 h and pre-treated or not with W146 (100μM).(A)Cells were applied to Transwell™chambers with S1P 1, 10, 100, 500 or 1000 nM and incubated for 4 hours (n = 3).(B)Migratory response of CEM cells toward S1P 100, 2500, 5000 and 10000 nM (n = 3). Values correspond to a specific migration after subtracting the numbers of migrating cells obtained in wells with culture medium only. Black bars correspond to T-ALL blasts pre-treated with RPMI-BSA 0.1% and white bars
correspond to T-ALL blasts pre-treated with W146. Results are expressed as mean±SEM and were analyzed by unpaired Student’sttest. Differences were considered statistically significant when*p<0.05,**p<0.01 or***p<0.001.
curve. Indeed, the maximum chemotaxis was reached at approximately one-log higher S1P dose, following W146 pre-treatment.
S1P1 mediates fugetaxis of T-ALL at high S1P concentrations
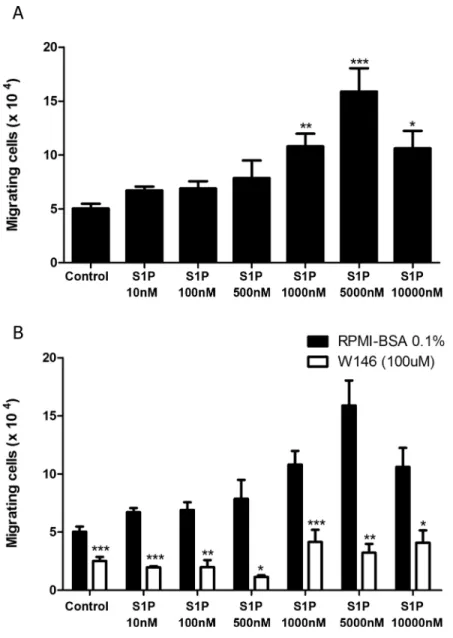
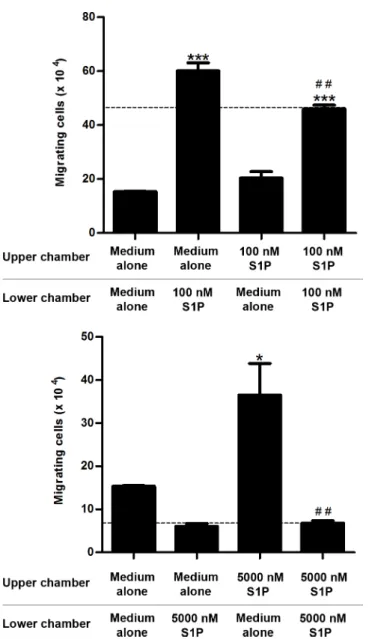
Since we verified that high S1P concentrations failed to induce chemotaxis of T-ALL blasts, we then evaluated whether these concentrations were actually repulsive. We performed migration assays where different S1P concentrations were applied to the transwell upper chambers together with CEM cells, which express higher levels of S1P1. We found that high S1P concen-trations (1000, 5000 and 10000 nM) induced fugetaxis or cell chemorepulsion, whereas lower concentrations did not (Fig 4A). The most significant effect was observed at S1P 5000 nM. This chemorepulsive effect was also S1P1 dependent, since pre-treatment of cells with W146 inhibited fugetaxis responses induced by S1P 1000, 5000 and 10000 nM (Fig 4B). Interestingly, W146 also inhibited migratory responses from control and lower S1P concentrations (10, 100 and 500 nM).
To confirm that different S1P concentrations induce fugetaxis or chemotaxis, we performed checkerboard assays. We observed that low S1P concentrations (100 nM) induced chemokin-esis, as cell migration was observed when S1P was added to both upper and lower transwell™
chambers, (Fig 5A). However, chemotaxis was still induced by S1P 100 nM, since migratory response induced by S1P added only to the lower chamber was higher than migratory response observed when S1P was present on both chambers (Fig 5A). In contrast, higher S1P concentra-tions (5000 nM) only induced fugetaxis, as cells migrated when S1P was added only to lower chamber and did not migrate when S1P was present in both upper and lower chambers (Fig 5B).
S1P3 is not involved in migration of T-ALL blasts
Migratory responses of CEM cells were completely abrogated following W146 pretreatment in fugetaxis experiments, but not in chemotaxis assays. We therefore hypothesized if other S1P receptor could be activated inducing chemotaxis toward high S1P concentrations following W146 treatment. Besides S1P1, S1P-migrating T-ALL cell lines (MOLT-4, JURKAT and CEM) also expressed S1P3 (Fig 1A–1C), raising the possibility that S1P3 might be involved in cell migratory responses. To evaluate this hypothesis, we performed migration assays with CEM, considering its higher S1P1 expression. We found that pre-treatment of CEM cells with BML-241 (a specific S1P3 blocker) did not inhibit cell migration toward S1P 10 and 100 nM (Fig 6A). In fact, the number of migrating cells in this case was very similar to what was seen when CEM cells were not treated. When CEM cells were pre-treated with W146 and BML-241 together, cell migration was inhibited toward S1P 10 and 100 nM, but did happen when higher S1P concentrations were applied. These data are comparable to those observed when CEM cells were pre-treated only with W146 (Fig 6A), indicating that S1P3 was not involved in cell migration when S1P1 signaling is blocked.
S1P modulates actin polymerization, AKT, ERK and Rac1 activation in
T-ALL blasts
Having characterized the S1P modulation of migratory responses of T-ALL blasts, we next ana-lyzed the regulation of actin cytoskeleton, an event necessary for cell migration [33]. As shown inFig 7A, S1P induced an important actin cytoskeleton polymerization in CEM cells at 10 and 100 nM, the same concentrations that induced chemotactic responses in these cells (Fig 2).
Fig 4. High S1P concentrations induce S1P1-dependent fugetaxis of CEM cells. (A)CEM cells were serum-starved for 2 h, applied to Transwell™chambers containing different S1P concentrations and incubated for 4 hours. S1P was added to the upper chamber to evaluate fugetaxis; only RPMI-BSA 0.1% was added to the bottom chambers. Results were analyzed by One-way ANOVA, followed by Tukey post-test (n = 3).(B)CEM cells were serum-starved for 2 h and pre-treated or not with W146 (100μM). Cells were then applied to Transwell™chambers containing different S1P concentrations and incubated for 4 hours. S1P was added to the upper chamber to evaluate repulsive responses. Black bars correspond to T-ALL blasts pre-treated with RPMI-BSA 0.1% alone and white bars correspond to T-ALL blasts pre-treated with W146. Results were analyzed by unpaired Student’sttest. Results are expressed as mean±SEM and differences
were considered statistically significant when*p<0.05,**p<0.01 or***p<0.001 (n = 3).
Slight polymerization was observed at 1 and 500 nM. Pre-treatment with W146 blocked actin polymerization in all S1P doses applied. Interestingly, the peak of actin polymerization during the kinetics was dose-dependent (Fig 7A).
We then examined AKT, ERK and Rac activation, known to be involved in S1P1 signaling in other cells [34,35]. After stimulating CEM cells with S1P 10 and 100 nM, which induced cell chemotaxis, we detected a clear AKT phosphorylation at 5 and 10 min, whereas 1000 nM
Fig 5. S1P-induced migratory responses in checkerboard assays.CEM cells were serum-starved for 2 h, applied to Transwell™chambers containing different S1P concentrations in a checkerboard format and incubated for 4 hours.(A)S1P 100 nM or(B)S1P 5000 nM were added to upper and/or lower chamber as RPMI-BSA 0,1%. Results were analyzed by One-way ANOVA, followed by Tukey post-test and are expressed as mean±SEM. Differences between wells with medium alone in upper and lower chambers and wells with S1P in upper and/or lower chamber were considered statistically significant when*p<0.05,**p<0.01 or
***p<0.001. Differences between wells with S1P in lower (100 nM) or upper (5000 nM) chambers and wells
with S1P in both upper and lower chambers were considered statistically significant when # p<0.05, ## p<0.01 or ### p<0.001 (n = 3).
induced a later AKT activation at 60 min (Fig 7B). Cells pre-treated with W146 did not present AKT phosphorylation.
A strong ERK1/2 activation was observed at doses of 10 and 1000 nM (at 10 and 60 min respectively), but only a slight activation at 100 nM. Pre-treatment of CEM cells with W146 also inhibited ERK1/2 activation (Fig 7C).
Despite a slight increase, no significant Rac1 activation was detected when CEM cells were stimulated with S1P 10 nM, whereas a decrease was detected at the end of kinetics (12 minutes post-stimulus) (Fig 7D–left panel). Interestingly, a decrease of Rac1 activity was observed when cells were stimulated with higher S1P concentrations (1000 nM). In contrast, CEM cells pre-treated with W146 presented an increase in Rac1 activation following S1P 1000 nM (Fig 7D–right panel). These data suggest that Rac activation or inhibition can be involved in the particular migratory responses (chemotaxis versus fugetaxis) following different doses of S1P.
Discussion
The migration of normal and neoplastic T-cell progenitors is guided by a variety of molecules and corresponding receptors. The T-ALL blasts used in this study expressed different amounts of S1P1 mRNA and were able to migrate toward different S1P concentrations. Migration of T-ALL blasts toward S1P 10 nM, a concentration largely used in the literature [18,19,36,37], directly correlated with S1P1 gene expression. This is similar to what we have recently reported for S1P-driven migration of normal human thymocytes [20]. Experimental data in mice also showed that naive CD4+T lymphocytes overexpressing S1P1 migrate more toward S1P 10 nM than wild type CD4+lymphocytes. In addition, the transgenic cells still migrated toward differ-ent S1P concdiffer-entrations when activated with anti-CD3 and anti-CD28, whereas wild type CD4+ T cells practically lose their migratory responses, together with a down regulation of S1P1 after activation [36].
In our study, S1P-driven migratory responses of T-ALL cells presented a bell-shaped dose-dependent pattern, with migration increasing from 1 nM to 100 nM and decreasing from 100 to 500 nM. Yet, the curves varied among T-ALL blasts, according to S1P1 gene expression lev-els. Similar results were described by Iino and colleagues, showing that JURKAT cells migrate toward S1P and the migratory response exhibits a bell-shaped curve [38]. Interestingly, it was reported that CD4 and CD8 L-selectin high single positive thymocytes [19], activated B lym-phocytes, transduced with a retrovirus containing a flag-tagged S1P1 insert and a human CD4 reporter, [19,37] and JURKAT cells [38] lose their migratory response driven by high S1P con-centrations (1000 nM).
Our results lead us to investigate whether high doses of S1P1 were inhibiting cell migration (chemotaxis) or were inducing cell repulsion (fugetaxis). We verified that higher concentra-tions of S1P were actually repulsive to CEM cells and this effect was dependent on S1P1. Inter-estingly, no CEM chemokinesis was observed at high S1P concentrations, while low S1P concentration induced both chemokinesis and chemoattraction. Dose-dependent chemoattrac-tion versus fugetaxis promoted by the same molecule have been described for chemokines. CXCL12, for example, is attractive to thymocytes when applied at low concentrations and repulsive at high concentrations [39]. IL-8 also induces both migratory processes, being
ANOVA, followed by Tukey post-test (n = 3).(E)SU-DHL-1 cells were serum-starved for 2 h and treated or not with W146 (100μM). Cells were applied to Transwell™chambers containing different S1P concentrations and incubated for 4 hours. Values correspond to specific migration after subtracting the numbers of migrating cells in culture medium only. Black bars correspond to treatment with RPMI-BSA 0.1% alone and white bars correspond to pre-treatment with W146. Results were analyzed by unpaired Student’sttest (n = 3). Results are expressed as mean±SEM and differences were considered statistically significant when*p<0.05,**p<0.01 or***p<0.001.
attractive and repulsive to neutrophils [40]. Furthermore, it was described that S1P can be repulsive to osteoclast precursors in high concentrations (10−6M) through S1P2 activation
[41], although this effect has never been related to S1P1. The role of S1P2 in migratory responses away from S1P1 was not analyzed in this study since T-ALL blasts expressed very low mRNA levels for this receptor.
In a second vein, it was described, in CCL-23 cells expressing c-myc-tagged S1P1, that W146 treatment resulted in an increase in S1P1 membrane contents probably by inhibiting receptor internalization [42]. In a recent study conducted with B cell lymphoma cells, inhibi-tion of CCR7 endocytosis reverted repulsion to attracinhibi-tion in high CCL19 concentrainhibi-tion gradi-ents [43]. The chemoattraction observed in high S1P concentrations after treatment with W146 might correspond to a reversion of migratory orientation.
Different responses of T-ALL blasts toward different S1P concentrations can help to explain previous data described in the literature. Through an experimental model of T-ALL/LBL on zebrafish, Feng and colleagues showed that treatment with W146 inhibited the generation of tumor cell clusters and induced blast dissemination [44]. In addition to the facts discussed above, this may also occur due to a break in S1P gradients, as shown in other studies with dif-ferent pathologies [45,46], triggered by an increase in S1P concentrations in the blood stream or in the tumor microenvironment, but also because of S1P-induced chemokinesis. Moreover, upregulation of S1P levels in tumor microenvironment could induce blasts dissemination, as S1P-driven fugetaxis was observed for high S1P concentrations. Therefore, it would be of inter-est to quantify S1P levels on the bloodstream and tumor of T-ALL and T-LBL in vivo.
SphK1 overexpression it was reported for lymphomas and leukemias, suggesting that these blasts could catalyze S1P production. Tissues from patients with non-Hodgkin’s lymphoma presented higher SphK1 protein and mRNA levels than tissues from patients with reactive lym-phoid hyperplasia [47]. Besides that, tumorigenic proerytroblasts presented an upregulation in SphK1 gene expression when compared with nontumorigenic proerytroblasts in a transgenic mouse model of erytroleukemia [48].
Currently, several studies concerning neoplastic cells search to understand cell signaling pathways involved in cell migration processes, since cell motility is directly correlated with invasive and metastatic capacity [49–51]. In addition, specific cell signaling pathways inhibitors have been widely screened for use in the treatment of various malignancies. In this context, we analyzed possible cell signaling pathways activated by S1P/S1P1 interaction in T-ALL blasts. We have previously observed F-actin modulation in normal human T lymphocytes when stim-ulated with S1P 10 nM; same concentration that induced cell migration upon these cells [20]. As expected, we observed F-actin polymerization in CEM when S1P was used at low concentra-tions and that modulation was mediated by S1P1. However, we did not observe F-actin modu-lation when cells were stimulated with high S1P concentrations, suggesting that actin
polymerization may occur in a later stage.
cells previously treated with W146 (100μM) and the black circles correspond to cells treated with RPMI-BSA 0.1%. Results are expressed by mean±SEM
and were analyzed by unpaired Student’sttest (n = 3). Differences were considered statistically significant when*p<0.05,**p<0.01 or***p<0.001(B) AKT and(C)ERK1/2 activation after stimulation of CEM cells, with different S1P concentrations, being pre-treated or not with W146 (100μM). Protein extracts were analyzed by Western-blot with AKT, phosphorylated-AKT, ERK1/2 and phosphorylated-ERK-1/2 specific antibodies. Representative western-blots images are shown (n = 3).(D)Rac1 activity after stimulation of CEM cells, pre-treated or not with W146 (100μM), with different S1P concentrations was accessed by G-LISA. Optical density (OD) was detected in 490 nm. Results are represented as [(OD after addition of the ligand) / (OD before addition of the ligand)] x 100. OD values obtained before the addition of S1P were arbitrarily set as 100% and correspond to the time zero. Black circles correspond pre-treatment with RPMI-BSA 0.1% and white circles correspond to pre-pre-treatment with W146 (100μM). Results and are expressed as mean±SEM. Differences between distinct time points and control (time zero) were analyzed by One-way ANOVA, followed by Dunnett post-test and were considered statistically significant when # p<0.05, ## p<0.01 or ### p<0.001. Differences between pre-treatment with RPMI-BSA 0.1% and pre-treatment with W146 (100μM) were
analyzed by unpaired Student T test (n = 1, with 2 biological replicates in duplicate). Differences were considered statistically significant when*p<0.05, **p<0.01 or***p<0.001.
S1P/S1P1 interaction can lead to the activation of AKT, ERK, and Rac1 [34,35]. AKT and ERK activation has been implicated in cell survival and proliferation, respectively. AKT enhances the survival of lymphocytes and others immune cells by inhibiting apoptosis, whereas ERK modulates the proliferation of these cells [34]. In a second vein, it has shown ERK1/2 involvement on S1P-driven migration of DU145 cells, derived from prostate cancer [52]. By contrast, Li and colleagues have reported that ERK was not involved in WiT49 (Wilm’s tumor cell line) cell migration after S1P exposure [27]. Our data shown that low and high S1P concen-trations induced AKT and ERK1/2 phosphorylation and S1P1 was involved in the activation of both signaling pathways. CEM cells pre-treated with W146 did not exhibit ERK1/2 phosphory-lation when stimulated with S1P, and AKT phosphoryphosphory-lation was prevented when cells were stimulated with high S1P concentrations. Furthermore, when CEM cells were stimulated with high S1P concentrations, AKT and ERK1/2 phosphorylation was seen in a later time point (60 minutes) than in cells stimulated with low S1P concentrations (5–10 minutes). These data are in accordance with our hypothesis that actin polymerization induced by higher S1P concentra-tions may be occurring in a later stage. It is noteworthy that S1P concentraconcentra-tions used in this work did not alter cell proliferation (until 72 hours—data not shown) and survival (until 48 hours—data not shown andS2 Fig).
The GTPase Rac is required for lymphocyte migration and cell-cell interactions [34,53,54]. Modulation of Rac1 activity under high S1P concentrations can be related to the migratory responses observed under the same conditions. CEM cells do not migrate toward high S1P con-centrations, when we observed a decrease in Rac1 activity. In contrast, CEM cells pre-treated with W146 expressively migrate toward high S1P concentrations, when Rac1 activity was increased. Previous data indicated a concentration-dependent effect of S1P on Rac and Rho activation. In human pulmonary artery endothelial cells, 500 nM of S1P led to Rac activation, whereas higher S1P concentrations (5μM) led to Rho activation while occurs a decrease in Rac
activation [55]. Induction of distinct signaling pathways was also reported for CXCL12/ CXCR4 interactions. Treatment of T-lymphocytes with anti-CXCR4, PTX and Wortmannin (a PI3K inhibitor) prevented chemotaxis and fugetaxis induced by CXCL12, whereas treatment with tyrosine kinase inhibitors (genistein and herbimycin) prevented only the chemotactic migration [56]. Moreover, different calcium and cAMP levels can determine attraction or repulsion in neuron axon guidance [57]. Together these results suggest that chemotaxis and fugetaxis can activate distinct signaling pathways.
As actin polymerization and Rac activation were not observed when CEM cells were stimu-lated with S1P concentrations restimu-lated to fugetaxis, another mechanism inducing cell migration, independent of actin cytoskeleton modulation, might be occurring, such as blebs [58]. Indeed, to confirm this hypothesis other signaling pathways involved in the regulation of actin poly-merization need to be investigated, including GTPases Cdc42 and Rho [59,60].
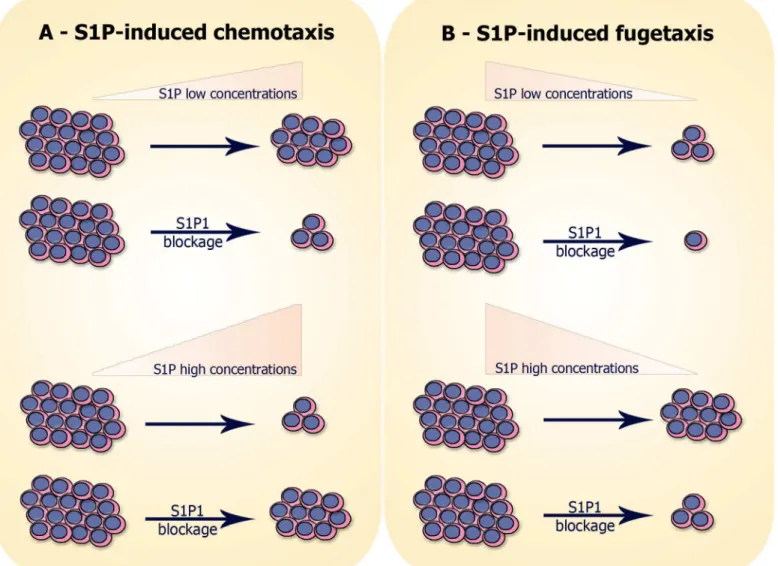
cell migration. We summarize our results on migratory responses of T-ALL blasts resulting in chemotaxis or fugetaxis inFig 8.
Together, our results shed more light on the dynamics of T-ALL/LBL blasts migration and can benefit the development of therapeutical strategies using S1P and S1P1 blockers. Taking into account the diversity of cellular processes involved in S1P/S1P1 signaling, the strategies may include induction of cell death, diminution of proliferation and prevention of blast dis-semination, which can be resultant of chemotaxis or fugetaxis.
Supporting Information
S1 Fig. S1P1 gene expression and S1P-driven migration are directly correlated in T-ALL blasts. (A)mRNA expression of S1P1 in T-ALL cell lines. mRNA expression was analyzed by real time quantitative PCR and compared with the control Abelson (Abl) gene (2-ΔCt). n = 1
–2, with 3–6 biological replicates.(B)Cell migration in Transwell™chambers was analyzed using
Fig 8. Hypothesis of S1P-induced migration of neoplastic T-cell progenitors:(A) S1P-induced chemotaxis: cells expressing S1P1 migrate toward low S1P concentrations (10–100 nM) and migration is inhibited when S1P1 is blocked with W146. In contrast, cells do not migrate toward high S1P
concentrations (500–10000 nM), unless when S1P1 is blocked. (B) S1P-induced fugetaxis: cells expressing S1P1 do not migrate away from low S1P concentrations and the nonspecific migration observed is even smaller when S1P1 is blocked. However, cells migrate away from high S1P concentrations and migration is impaired when S1P1 is blocked.
S1P 10 nM. Values correspond to specific migration after subtracting the numbers of migrating cells obtained for each cell line in wells with culture medium only. Results are expressed as mean ± SEM (n = 3).(C)Linear regression of S1P1 mRNA expression and migrating cells. (TIF)
S2 Fig. S1P, W146 and BML-241 are not toxic to T-ALL blasts.After migration assays,(A)
T-ALL blasts cells(B)CEM cells(C)SU-DHL-1 cells and again(D)CEM cells, but this time blocked with W146 and/or BML-241, that were not able to migrate toward different S1P con-centrations, were collected and stained with Anexin-V-APC and propidium iodide; being fur-ther analyzed by flow cytometry. Results correspond to relative number (%) of live cells (Anexin-V-APC-PI-) and are expressed as mean ± SEM. Black bars correspond to pre-treat-ment with RPMI-BSA 0.1%; white bars correspond to pre-treatpre-treat-ment with W146; grid bars cor-respond to pre-treatment with BML-241; and chess bars corcor-respond to pre-treatment with W146 plus BML-241. Results are expressed as mean ± SEM and were analyzed by One-way ANOVA, followed by Tukey post-test and by unpaired Student T test (n = 3). Differences were considered statistically significant whenp<0.05,p<0.01 orp<0.001.
(TIF)
Acknowledgments
We thank Dr. Leandra Linhares Lacerda for technical assistance; the Real-time PCR PDTIS platform (RPT09A) from Fiocruz, Rio de Janeiro, Brazil and Dr. Loic Dupré (Purpan Univer-sity Hospital, Toulouse, France) for helpful discussions.
Author Contributions
Conceived and designed the experiments: CVM ESVV JPL VCA WS DAMC. Performed the experiments: CVM ESVV JPL DAMC. Analyzed the data: CVM ESVV JPL OCM VCA WS DAMC. Contributed reagents/materials/analysis tools: OCM VCA WS DAMC. Wrote the paper: CVM JPL VCA WS DAMC.
References
1. Brinkmann V. Sphingosine 1-phosphate receptors in health and disease: mechanistic insights from gene deletion studies and reverse pharmacology. Pharmacology & therapeutics. 2007; 115(1):84–105. doi:10.1016/j.pharmthera.2007.04.006PMID:17561264.
2. Zachariah MA, Cyster JG. Neural crest-derived pericytes promote egress of mature thymocytes at the corticomedullary junction. Science. 2010; 328(5982):1129–35. Epub 2010/04/24. doi: science.1188222 [pii] doi:10.1126/science.1188222PMID:20413455; PubMed Central PMCID: PMC3107339. 3. Pappu R, Schwab SR, Cornelissen I, Pereira JP, Regard JB, Xu Y, et al. Promotion of lymphocyte
egress into blood and lymph by distinct sources of sphingosine-1-phosphate. Science. 2007; 316 (5822):295–8. Epub 2007/03/17. doi: 1139221 [pii] doi:10.1126/science.1139221PMID:17363629. 4. Strub GM, Maceyka M, Hait NC, Milstien S, Spiegel S. Extracellular and intracellular actions of
sphingo-sine-1-phosphate. Adv Exp Med Biol. 2010; 688:141–55. Epub 2010/10/06. PMID:20919652; PubMed Central PMCID: PMC2951632.
5. Watterson K, Sankala H, Milstien S, Spiegel S. Pleiotropic actions of sphingosine-1-phosphate. Prog Lipid Res. 2003; 42(4):344–57. Epub 2003/06/07. PMID:12790117.
6. Fyrst H, Saba JD. An update on sphingosine-1-phosphate and other sphingolipid mediators. Nat Chem Biol. 2010; 6(7):489–97. Epub 2010/06/19. doi: nchembio.392 [pii] doi:10.1038/nchembio.392PMID: 20559316; PubMed Central PMCID: PMC3001344.
8. Tabasinezhad M, Samadi N, Ghanbari P, Mohseni M, Saei AA, Sharifi S, et al. Sphingosin 1-phosphate contributes in tumor progression. Journal of cancer research and therapeutics. 2013; 9(4):556–63. doi: 10.4103/0973-1482.126446PMID:24518696.
9. Kohno M, Momoi M, Oo ML, Paik JH, Lee YM, Venkataraman K, et al. Intracellular role for sphingosine kinase 1 in intestinal adenoma cell proliferation. Mol Cell Biol. 2006; 26(19):7211–23. Epub 2006/09/ 19. doi: 26/19/7211 [pii] doi:10.1128/MCB.02341-05PMID:16980623; PubMed Central PMCID: PMC1592880.
10. Gao P, Smith CD. Ablation of sphingosine kinase-2 inhibits tumor cell proliferation and migration. Mol Cancer Res. 2011; 9(11):1509–19. Epub 2011/09/08. doi: 1541-7786.MCR-11-0336 [pii] doi:10.1158/ 1541-7786.MCR-11-0336PMID:21896638; PubMed Central PMCID: PMC3219805.
11. Guan H, Liu L, Cai J, Liu J, Ye C, Li M, et al. Sphingosine kinase 1 is overexpressed and promotes pro-liferation in human thyroid cancer. Mol Endocrinol. 2011; 25(11):1858–66. Epub 2011/09/24. doi:10. 1210/me.2011-1048me.2011-1048[pii]. PMID:21940753.
12. Park KS, Kim MK, Lee HY, Kim SD, Lee SY, Kim JM, et al. S1P stimulates chemotactic migration and invasion in OVCAR3 ovarian cancer cells. Biochem Biophys Res Commun. 2007; 356(1):239–44. Epub 2007/03/14. doi: S0006-291X(07)00421-4 [pii] doi:10.1016/j.bbrc.2007.02.112PMID:17349972. 13. Bao M, Chen Z, Xu Y, Zhao Y, Zha R, Huang S, et al. Sphingosine kinase 1 promotes tumour cell migra-tion and invasion via the S1P/EDG1 axis in hepatocellular carcinoma. Liver internamigra-tional: official journal of the International Association for the Study of the Liver. 2012; 32(2):331–8. doi:10.1111/j.1478-3231. 2011.02666.xPMID:22098666.
14. Pchejetski D, Golzio M, Bonhoure E, Calvet C, Doumerc N, Garcia V, et al. Sphingosine kinase-1 as a chemotherapy sensor in prostate adenocarcinoma cell and mouse models. Cancer Res. 2005; 65 (24):11667–75. Epub 2005/12/17. doi: 65/24/11667 [pii] doi:10.1158/0008-5472.CAN-05-2702PMID: 16357178.
15. Sukocheva O, Wang L, Verrier E, Vadas MA, Xia P. Restoring endocrine response in breast cancer cells by inhibition of the sphingosine kinase-1 signaling pathway. Endocrinology. 2009; 150(10):4484– 92. doi:10.1210/en.2009-0391PMID:19706837.
16. Kihara Y, Maceyka M, Spiegel S, Chun J. Lysophospholipid receptor nomenclature review: IUPHAR Review 8. British journal of pharmacology. 2014; 171(15):3575–94. doi:10.1111/bph.12678PMID: 24602016; PubMed Central PMCID: PMC4128058.
17. Schwab SR, Pereira JP, Matloubian M, Xu Y, Huang Y, Cyster JG. Lymphocyte sequestration through S1P lyase inhibition and disruption of S1P gradients. Science. 2005; 309(5741):1735–9. Epub 2005/ 09/10. doi: 309/5741/1735 [pii] doi:10.1126/science.1113640PMID:16151014.
18. Allende ML, Dreier JL, Mandala S, Proia RL. Expression of the sphingosine 1-phosphate receptor, S1P1, on T-cells controls thymic emigration. The Journal of biological chemistry. 2004; 279(15):15396– 401. doi:10.1074/jbc.M314291200PMID:14732704.
19. Matloubian M, Lo CG, Cinamon G, Lesneski MJ, Xu Y, Brinkmann V, et al. Lymphocyte egress from thymus and peripheral lymphoid organs is dependent on S1P receptor 1. Nature. 2004; 427 (6972):355–60. doi:10.1038/nature02284PMID:14737169.
20. Mendes-da-Cruz DA, Brignier AC, Asnafi V, Baleydier F, Messias CV, Lepelletier Y, et al. Semaphorin 3F and neuropilin-2 control the migration of human T-cell precursors. PloS one. 2014; 9(7):e103405. doi:10.1371/journal.pone.0103405PMID:25068647; PubMed Central PMCID: PMC4113369. 21. Onciu M. Acute lymphoblastic leukemia. Hematol Oncol Clin North Am. 2009; 23(4):655–74. Epub
2009/07/07. doi: S0889-8588(09)00085-9 [pii] doi:10.1016/j.hoc.2009.04.009PMID:19577163. 22. Morikawa S, Tatsumi E, Baba M, Harada T, Yasuhira K. Two E-rosette-forming lymphoid cell lines. Int J
Cancer. 1978; 21(2):166–70. Epub 1978/02/15. PMID:203546.
23. Minowada J, Onuma T, Moore GE. Rosette-forming human lymphoid cell lines. I. Establishment and evidence for origin of thymus-derived lymphocytes. J Natl Cancer Inst. 1972; 49(3):891–5. Epub 1972/ 09/01. PMID:4567231.
24. Schneider U, Schwenk HU, Bornkamm G. Characterization of EBV-genome negative "null" and "T" cell lines derived from children with acute lymphoblastic leukemia and leukemic transformed non-Hodgkin lymphoma. Int J Cancer. 1977; 19(5):621–6. Epub 1977/05/15. PMID:68013.
25. Foley GE, Lazarus H, Farber S, Uzman BG, Boone BA, McCarthy RE. Continuous Culture of Human Lymphoblasts from Peripheral Blood of a Child with Acute Leukemia. Cancer. 1965; 18:522–9. Epub 1965/04/01. PMID:14278051.
27. Li MH, Sanchez T, Yamase H, Hla T, Oo ML, Pappalardo A, et al. S1P/S1P1 signaling stimulates cell migration and invasion in Wilms tumor. Cancer Lett. 2009; 276(2):171–9. Epub 2009/01/10. doi: S0304-3835(08)00898-7 [pii] doi:10.1016/j.canlet.2008.11.025PMID:19131156; PubMed Central PMCID: PMC2943759.
28. Beillard E, Pallisgaard N, van der Velden VH, Bi W, Dee R, van der Schoot E, et al. Evaluation of candi-date control genes for diagnosis and residual disease detection in leukemic patients using 'real-time' quantitative reverse-transcriptase polymerase chain reaction (RQ-PCR)—a Europe against cancer pro-gram. Leukemia. 2003; 17(12):2474–86. Epub 2003/10/17. doi:10.1038/sj.leu.24031362403136[pii]. PMID:14562124.
29. Brocklyn JR. Regulation of cancer cell migration and invasion by sphingosine-1-phosphate. World J Biol Chem. 2010; 1(10):307–12. Epub 2011/05/04. doi:10.4331/wjbc.v1.i10.307PMID:21537464; PubMed Central PMCID: PMC3083934.
30. Sanna MG, Wang SK, Gonzalez-Cabrera PJ, Don A, Marsolais D, Matheu MP, et al. Enhancement of capillary leakage and restoration of lymphocyte egress by a chiral S1P1 antagonist in vivo. Nat Chem Biol. 2006; 2(8):434–41. Epub 2006/07/11. doi: nchembio804 [pii] doi:10.1038/nchembio804PMID: 16829954.
31. Gonzalez-Cabrera PJ, Hla T, Rosen H. Mapping pathways downstream of sphingosine 1-phosphate subtype 1 by differential chemical perturbation and proteomics. J Biol Chem. 2007; 282(10):7254–64. Epub 2007/01/16. doi: M610581200 [pii] doi:10.1074/jbc.M610581200PMID:17218309.
32. Gonzalez-Cabrera PJ, Jo E, Sanna MG, Brown S, Leaf N, Marsolais D, et al. Full pharmacological effi-cacy of a novel S1P1 agonist that does not require S1P-like headgroup interactions. Mol Pharmacol. 2008; 74(5):1308–18. Epub 2008/08/19. doi: mol.108.049783 [pii] doi:10.1124/mol.108.049783PMID: 18708635; PubMed Central PMCID: PMC2575047.
33. Samstag Y, Eibert SM, Klemke M, Wabnitz GH. Actin cytoskeletal dynamics in T lymphocyte activation and migration. J Leukoc Biol. 2003; 73(1):30–48. Epub 2003/01/15. PMID:12525560.
34. Rosen H, Goetzl EJ. Sphingosine 1-phosphate and its receptors: an autocrine and paracrine network. Nature reviews Immunology. 2005; 5(7):560–70. doi:10.1038/nri1650PMID:15999095.
35. Cuvillier O. [Sphingosine 1-phosphate receptors: from biology to physiopathology]. Medecine sciences: M/S. 2012; 28(11):951–7. doi:10.1051/medsci/20122811013PMID:23171898.
36. Graler MH, Huang MC, Watson S, Goetzl EJ. Immunological effects of transgenic constitutive expres-sion of the type 1 sphingosine 1-phosphate receptor by mouse lymphocytes. J Immunol. 2005; 174 (4):1997–2003. Epub 2005/02/09. doi: 174/4/1997 [pii]. PMID:15699128.
37. Lo CG, Xu Y, Proia RL, Cyster JG. Cyclical modulation of sphingosine-1-phosphate receptor 1 surface expression during lymphocyte recirculation and relationship to lymphoid organ transit. J Exp Med. 2005; 201(2):291–301. Epub 2005/01/20. doi: jem.20041509 [pii] doi:10.1084/jem.20041509PMID: 15657295; PubMed Central PMCID: PMC2212802.
38. Iino J, Osada M, Kurano M, Kaneko M, Ohkawa R, Satoh Y, et al. Platelet-derived sphingosine 1-phos-phate induces migration of Jurkat T cells. Lipids in health and disease. 2014; 13:150. doi:10.1186/ 1476-511X-13-150PMID:25253303; PubMed Central PMCID: PMC4193286.
39. Poznansky MC, Olszak IT, Evans RH, Wang Z, Foxall RB, Olson DP, et al. Thymocyte emigration is mediated by active movement away from stroma-derived factors. J Clin Invest. 2002; 109(8):1101–10. Epub 2002/04/17. doi:10.1172/JCI13853PMID:11956248; PubMed Central PMCID: PMC150941. 40. Tharp WG, Yadav R, Irimia D, Upadhyaya A, Samadani A, Hurtado O, et al. Neutrophil chemorepulsion
in defined interleukin-8 gradients in vitro and in vivo. Journal of leukocyte biology. 2006; 79(3):539–54. doi:10.1189/jlb.0905516PMID:16365152.
41. Ishii M, Kikuta J, Shimazu Y, Meier-Schellersheim M, Germain RN. Chemorepulsion by blood S1P reg-ulates osteoclast precursor mobilization and bone remodeling in vivo. The Journal of experimental medicine. 2010; 207(13):2793–8. doi:10.1084/jem.20101474PMID:21135136; PubMed Central PMCID: PMC3005230.
42. Tarrason G, Auli M, Mustafa S, Dolgachev V, Domenech MT, Prats N, et al. The sphingosine-1-phos-phate receptor-1 antagonist, W146, causes early and short-lasting peripheral blood lymphopenia in mice. Int Immunopharmacol. 2011; 11(11):1773–9. Epub 2011/07/30. doi: S1567-5769(11)00277-3 [pii] doi:10.1016/j.intimp.2011.07.004PMID:21798372.
43. Malet-Engra G, Yu W, Oldani A, Rey-Barroso J, Gov NS, Scita G, et al. Collective cell motility promotes chemotactic prowess and resistance to chemorepulsion. Curr Biol. 2015; 25(2):242–50. doi:10.1016/j. cub.2014.11.030PMID:25578904.
45. Sattler KJ, Elbasan S, Keul P, Elter-Schulz M, Bode C, Graler MH, et al. Sphingosine 1-phosphate lev-els in plasma and HDL are altered in coronary artery disease. Basic Res Cardiol. 2010; 105(6):821–32. Epub 2010/07/24. doi:10.1007/s00395-010-0112-5PMID:20652276.
46. Nunes J, Naymark M, Sauer L, Muhammad A, Keun H, Sturge J, et al. Circulating sphingosine-1-phos-phate and erythrocyte sphingosine kinase-1 activity as novel biomarkers for early prostate cancer detection. British journal of cancer. 2012; 106(5):909–15. doi:10.1038/bjc.2012.14PMID:22315056; PubMed Central PMCID: PMC3305969.
47. Bayerl MG, Bruggeman RD, Conroy EJ, Hengst JA, King TS, Jimenez M, et al. Sphingosine kinase 1 protein and mRNA are overexpressed in non-Hodgkin lymphomas and are attractive targets for novel pharmacological interventions. Leuk Lymphoma. 2008; 49(5):948–54. Epub 2008/05/03. doi: 791359638 [pii] doi:10.1080/10428190801911654PMID:18452097.
48. Le Scolan E, Pchejetski D, Banno Y, Denis N, Mayeux P, Vainchenker W, et al. Overexpression of sphingosine kinase 1 is an oncogenic event in erythroleukemic progression. Blood. 2005; 106 (5):1808–16. Epub 2005/05/14. doi: 2004-12-4832 [pii] doi:10.1182/blood-2004-12-4832PMID: 15890687.
49. Lee CJ, Lee MH, Yoo SM, Choi KI, Song JH, Jang JH, et al. Magnolin inhibits cell migration and inva-sion by targeting the ERKs/RSK2 signaling pathway. BMC Cancer. 2015; 15:576. doi:10.1186/ s12885-015-1580-7PMID:26253302; PubMed Central PMCID: PMC4529708.
50. Di J, Huang H, Qu D, Tang J, Cao W, Lu Z, et al. Rap2B promotes proliferation, migration, and invasion of human breast cancer through calcium-related ERK1/2 signaling pathway. Sci Rep. 2015; 5:12363. doi:10.1038/srep12363PMID:26201295; PubMed Central PMCID: PMC4512009.
51. He SQ, Gao M, Fu YF, Zhang YN. Glycyrrhizic acid inhibits leukemia cell growth and migration via blocking AKT/mTOR/STAT3 signaling. Int J Clin Exp Pathol. 2015; 8(5):5175–81. PMID:26191214; PubMed Central PMCID: PMC4503086.
52. Sekine Y, Suzuki K, Remaley AT. HDL and sphingosine-1-phosphate activate stat3 in prostate cancer DU145 cells via ERK1/2 and S1P receptors, and promote cell migration and invasion. Prostate. 2011; 71(7):690–9. Epub 2010/10/28. doi:10.1002/pros.21285PMID:20979115.
53. Matsuyuki H, Maeda Y, Yano K, Sugahara K, Chiba K, Kohno T, et al. Involvement of sphingosine 1-phosphate (S1P) receptor type 1 and type 4 in migratory response of mouse T cells toward S1P. Cell Mol Immunol. 2006; 3(6):429–37. PMID:17257496.
54. McVerry BJ, Garcia JG. In vitro and in vivo modulation of vascular barrier integrity by sphingosine 1-phosphate: mechanistic insights. Cell Signal. 2005; 17(2):131–9. doi:10.1016/j.cellsig.2004.08.006 PMID:15494205.
55. Shikata Y, Birukov KG, Garcia JG. S1P induces FA remodeling in human pulmonary endothelial cells: role of Rac, GIT1, FAK, and paxillin. J Appl Physiol (1985). 2003; 94(3):1193–203. doi:10.1152/ japplphysiol.00690.2002PMID:12482769.
56. Poznansky MC, Olszak IT, Foxall R, Evans RH, Luster AD, Scadden DT. Active movement of T cells away from a chemokine. Nature medicine. 2000; 6(5):543–8. doi:10.1038/75022PMID:10802710. 57. Forbes EM, Thompson AW, Yuan J, Goodhill GJ. Calcium and cAMP levels interact to determine
attraction versus repulsion in axon guidance. Neuron. 2012; 74(3):490–503. doi:10.1016/j.neuron. 2012.02.035PMID:22578501.
58. Paluch EK, Raz E. The role and regulation of blebs in cell migration. Current opinion in cell biology. 2013; 25(5):582–90. doi:10.1016/j.ceb.2013.05.005PMID:23786923; PubMed Central PMCID: PMC3989058.
59. Rottner K, Stradal TE. Actin dynamics and turnover in cell motility. Current opinion in cell biology. 2011; 23(5):569–78. doi:10.1016/j.ceb.2011.07.003PMID:21807492.
60. Hanna S, El-Sibai M. Signaling networks of Rho GTPases in cell motility. Cell Signal. 2013; 25 (10):1955–61. doi:10.1016/j.cellsig.2013.04.009PMID:WOS:000322943700003.
61. Pyne NJ, McNaughton M, Boomkamp S, MacRitchie N, Evangelisti C, Martelli AM, et al. Role of sphin-gosine 1-phosphate receptors, sphinsphin-gosine kinases and sphinsphin-gosine in cancer and inflammation. Adv Biol Regul. 2015. doi:10.1016/j.jbior.2015.09.001PMID:26429117.