Universidade de Aveiro Departamento deElectr´onica, Telecomunica¸c˜oes e Inform´atica, 2016
Ricardo Filipe
Ferreira Martins
Plataforma integrada para divulga¸
c˜
ao do estado da
qualidade do ar
Universidade de Aveiro Departamento deElectr´onica, Telecomunica¸c˜oes e Inform´atica, 2016
Ricardo Filipe
Ferreira Martins
An integrated platform to access air quality levels
Disserta¸c˜ao apresentada `a Universidade de Aveiro para cumprimento dos requesitos necess´arios `a obten¸c˜ao do grau de Mestre em Engenharia de Computadores e Telem´atica, realizada sob a orienta¸c˜ao cient´ıfica do Pro-fessor Doutor Il´ıdio Castro Oliveira, ProPro-fessor Auxiliar do Departamento de Eletr´onica, Telecomunica¸c˜oes e Inform´atica da Universidade de Aveiro e do Professor Doutor Carlos A. D. Soares Borrego, Professor Catedr´atico do Departamento de Ambiente e Ordenamento da Universidade de Aveiro.
o j´uri / the jury
presidente / president Professor Doutor Joaquim Manuel Henriques de Sousa Pinto
Professor Auxiliar do Departamento de Eletr´onica, Telecomunica¸c˜oes e Inform´atica da Universidade de Aveiro
vogais / examiners committee Professor Doutor Il´ıdio Fernando de Castro Oliveira
Professor Auxiliar do Departamento de Eletr´onica, Telecomunica¸c˜oes e Inform´atica da Universidade de Aveiro
Professor Doutor Ciro Alexandre Domingues Martins
agradecimentos Em primeiro lugar, gostaria de agradecer ao meu orientador, Professor Doutor Il´ıdio Fernando de Castro Oliveira pela sua disponibilidade, co-nhecimento e apoio prestados ao longo da realiza¸c˜ao desta Disserta¸c˜ao. Gostaria tamb´em de manifestar o meu apre¸co ao Instituto do Ambiente e Desenvolvimento e a toda a sua equipa pela simpatia com que me rece-beram e por sempre demonstrarem a sua disponibilidade para o sucesso do projeto.
Agrade¸co por ´ultimo a todas as pessoas que, no decorrer destes anos, me apoiaram e me permitiram crescer enquanto profissinal e ser humano, em especial aos meus amigos e `a minha familia porque sem eles nada disto seria poss´ıvel.
Resumo Nesta disserta¸c˜ao ´e proposta uma solu¸c˜ao que, partindo de dados recolhidos por equipamento instalado numa carrinha do IDAD, Instituto do Ambiente e Desenvolvimento, que ´e frequentemente deixada a realizar medi¸c˜oes em locais de acesso inconveniente e que n˜ao fornece uma forma simples de acesso aos mesmos, permite disponibiliza-los para os membros do IDAD e para os clientes interessados.
A solu¸c˜ao desenvolvida envolve todo o processo de fazer os dados chegarem ao utilizador, desde a sua recolha na carrinha, passando pelo seu envio para um servidor online atrav´es de um servi¸co de queueing de mensagens onde s˜ao alojados de forma a permitir o seu acesso em qualqer momento, tratamento dos dados obtidos e a cria¸c˜ao de servi¸cos REST para a sua disponibiliz´a¸c˜ao para servi¸cos externos.
Al´em disso, foi criada uma interface web que permite aos utilizadores facil-mente verificarem o estado da qualidade do ar em qualquer momento, con-trolar o acesso dos utilizadores e gerir a informa¸c˜ao dispon´ıvel para cada um. Por fim, foi tamb´em desenvolvida uma aplica¸c˜ao m´ovel Android que constitui o m´etodo mais simples e r´apido de verificar o estado da quali-dade do ar no momento atual e o qual abre a possibiliquali-dade de utilizar o sistema de notifica¸c˜oes do Android para alertar o utilizador de situa¸c˜oes de alarme e eventos espec´ıficos sem este ter que aceder manualmente a uma das plataformas para detetar essa situa¸c˜ao.
Abstract In this dissertation it is proposed a solution which, starting from data gath-ered by specialized equipment installed in a IDAD’s vehicle, frequently left taking measurements in places of inconvenient access and which does not provide a simple way to access the data, allows the disclosure of them to the IDAD’s team and all the interested clients.
The solution developed involves the whole process of taking the data to the user, since its collection, passing by its dispatch to an online server through a messaging service where they are stored for easy access at any time needed, data processing and the creation of RESTful services for their provision to external services.
Moreover it was developed a web interface that allows the user to easily check the state of the air quality at any moment, controlling user access and managing the data available for each one. Lastly, it was also developed an Android mobile application which represents the easiest and fastest way of checking the state of the air at the current time and also opens the possibility of using the notification system to alert the user of hazard situa-tions and specific events without the need of manually accessing one of the platforms to detect that situation.
Contents
Contents i
List of Figures iii
List of Tables v
1 Introduction 1
1.1 The Hosting Institute . . . 1
1.2 Motivation and Objectives . . . 2
1.2.1 Motivation . . . 2
1.2.2 Objectives . . . 4
1.3 Dissertation Structure . . . 4
2 State of the Art 5 2.1 Air Quality Metrics . . . 5
2.2 Web Development . . . 7
2.2.1 Back-end stack . . . 7
2.2.2 Front-end stack . . . 9
2.3 Mobile Computing . . . 9
2.3.1 OS Market Alternatives . . . 10
2.3.2 Native vs Web vs Hybrid . . . 11
3 System Requirements 13 3.1 Actors . . . 13
3.2 Usage scenarios . . . 13
3.2.1 Website Use Cases . . . 14
3.2.2 Mobile App Use Cases . . . 16
4 Architecture 19 4.1 LabQAr’s Legacy System . . . 19
4.2 System Architecture . . . 19
4.2.1 Watchdog in the LabQAr . . . 20
4.2.2 RabbitMQ Server . . . 20
4.2.3 Main Server . . . 21
4.2.4 Web Application . . . 21
5 System Implementation 23
5.1 Backend . . . 23
5.1.1 The Connector Module . . . 25
5.1.2 Central Database . . . 28 5.2 Integration API . . . 28 5.3 Website . . . 32 5.3.1 Structure Overview . . . 32 5.3.2 Technology Stack . . . 33 5.3.3 Supported Interactions . . . 33 5.3.3.1 Push Notifications . . . 35 5.3.3.2 Session Login . . . 37
5.3.3.3 Overview Of The Air Quality . . . 38
5.3.3.4 Overview Of The Air Quality In The Previous 24H . . . 39
5.3.3.5 Select a Campaign or Day . . . 39
5.3.3.6 Change user details . . . 40
5.3.3.7 Measurements Of The Different Parameters . . . 41
5.3.3.8 Check alerts history . . . 42
5.3.4 The Administrator interface . . . 43
5.4 Mobile Application . . . 44
5.4.1 Overview . . . 44
5.4.2 Supported Interactions . . . 50
5.4.2.1 Session Login . . . 50
5.4.2.2 Overview Of The Air Quality . . . 52
5.4.2.3 Overview Of The Air Quality in The Last 24H . . . 53
5.4.2.4 Measurements Of Different Parameters . . . 53
5.4.2.5 Measurements Of the Selected Parameter In The Last 24H . 54 5.4.2.6 Check Past Notifications . . . 54
5.4.2.7 Tutorial . . . 55 5.4.2.8 Definitions . . . 56 5.4.2.9 Logout . . . 57 6 System Validation 59 6.1 Compatibility Tests . . . 59 6.2 Pilot usage . . . 62
7 Conclusion And Future Work 65 7.1 Conclusion . . . 65
7.2 Future Work . . . 66
References 67
List of Figures
1.1 The Institute’s Logo . . . 1
1.2 Environment sensors installed in the LabQAr . . . 3
1.3 The LabQAr collecting at an airport . . . 3
2.1 Latest values registered for each parameter at two different stations . . . 5
2.2 Variation of a parameter in the previous 24H . . . 6
2.3 Classification chart for each pollutant (in g/m3) . . . 6
2.4 Layers of the full stack development . . . 7
2.5 Number of users accessing the Internet through Mobile vs Desktop, in millions 10 2.6 Worldwide segmentation on the smartphones market share, in percentage . . 10
2.7 Comparison between the three mobile development approaches . . . 12
3.1 Website only use cases diagram . . . 14
3.2 Mobile only use cases diagram . . . 16
4.1 Proposed architecture . . . 20
5.1 UML View of the class ’Local’ . . . 24
5.2 Connector Module Conceptual Behavior . . . 25
5.3 Central Database Diagram . . . 29
5.4 Django Overall Project Structure . . . 32
5.5 Stack of Tecnhologies used in the website . . . 33
5.6 LabQAr Django App Structure . . . 34
5.7 Login page . . . 37
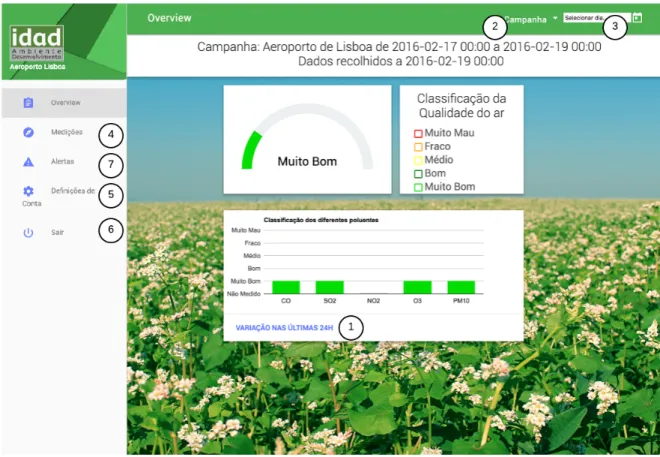
5.8 Overview page . . . 38
5.9 Overview the previous 24H overlay . . . 39
5.10 From a Dropdown List. . . 39
5.11 From the calendar. . . 39
5.12 Diferent ways of selecting campaign . . . 39
5.13 Change Details Overlay . . . 40
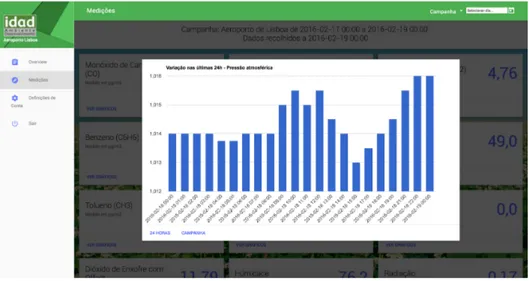
5.14 Measurements Page . . . 41
5.15 Measurements 24 Hour Variation Overlay . . . 41
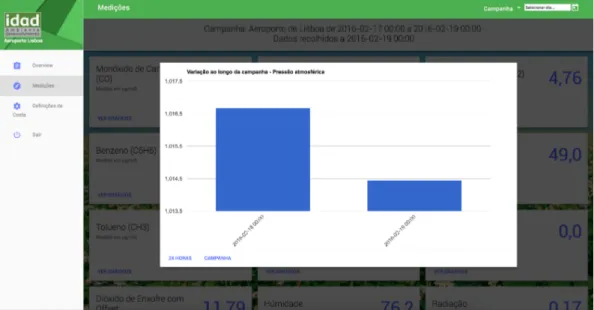
5.16 Measurements Campaign Variation Overlay . . . 42
5.17 Alerts History Page . . . 42
5.18 LabQAr’s Administrator interface . . . 43
5.19 Overview screen . . . 48
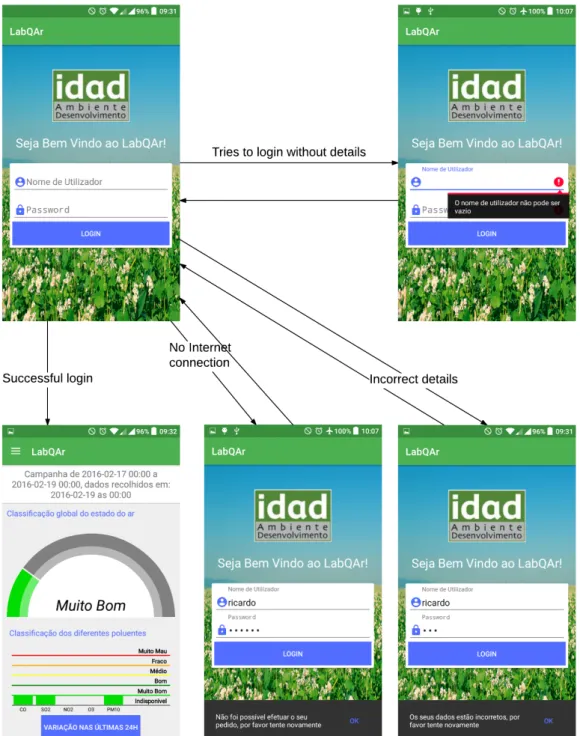
5.21 Login Screen Activity Diagram . . . 52
5.22 Overview Screen Storyboard . . . 52
5.23 Overview 24H Screen Storyboard . . . 53
5.24 Measurements Screen Storyboard . . . 53
5.25 Measurments 24H Screen Storyboard . . . 54
5.26 Alerts Screen Storyboard . . . 55
5.27 Tutorial Screen Storyboard (Not comprehensive) . . . 55
5.28 Definitions Screen Storyboard . . . 56
5.29 Log out Screen Storyboard . . . 57
6.1 Example of Answers’ daily analytics . . . 59
6.2 Drawer Hidden. . . 60
6.3 Drawer Visible. . . 60
6.4 Tablet Size Screen . . . 60
6.5 Mobile Size Screen . . . 60
6.6 Device 1. . . 61
6.7 Device 2. . . 61
6.8 Device 3. . . 61
6.9 Home screen across the different devices tested. . . 61
6.10 Portrait Mode. . . 62
6.11 Landscape Mode. . . 62
6.12 Chart on different screen orientations. . . 62
List of Tables
5.1 REST interface requests, type and sample responses . . . 31 6.1 Devices tested . . . 61
Chapter 1
Introduction
The constant growth of cities and industrialization leads to a prevalent problem in the environmental pollution, whether it is from factories’ smoke releases, vehicles emissions or other sources. [1]
The impact of poor air quality is not only an health concern but also ecological and eco-nomical. Poor air quality can lead to the contamination of plants, animals, soil and water, which therefore leads to ecological and human issues, like the need for hospitalization or med-ical treatments, lost work days or reduction in the agriculture’s productivity, for example, leading to a negative impact in the economy. Monitoring the air quality is, therefore, a fun-damental practice to determine if the air quality in a region is within the expected values. [1] Air quality monitoring aims at keeping track of a set of harmful gases in the atmosphere and determining if they are or not within a safe limit, according to the countries legislation. The goal is to give a perception of the state of air quality in a given place so that it is possible to take measures to enhance the air quality.
1.1
The Hosting Institute
Figure 1.1: The Institute’s Logo
IDAD, Instituto do Ambiente e Desenvolvimento (http://www.ua.pt/idad/), is an asso-ciation based in Aveiro, Portugal. It is a scientific and technical non-profit assoasso-ciation, with public utility, funded in 1993, which works at the level of the environmental needs of Enter-prises and Organizations.
The goal of the institute is to provide enterprises and public administration with the best and most innovative solutions aiming the environmental sustainability. Its relation to the University of Aveiro has allowed to achieve excellence results and recognition in the services provided.
The institute works in three main areas of intervention: • Air Pollution
• Impact Assessment and Environmental Monitoring • Sustainability
The work developed in this dissertation is inserted in two areas, Air Pollution and Environ-mental Monitoring. [2]
1.2
Motivation and Objectives
1.2.1 Motivation
A growing practice for monitoring and classifying air quality consists in continuously measuring the atmospheric concentration of a specific set of pollutants using sophisticated equipment, like specific gas analyzers. In Portugal, this is a common solution in fixed collect-ing stations spread across the country.
IDAD, however, offers a mobile, somewhat portable solution that allows for continuous real-time monitoring of the air quality at any location, rather than a fixed one. This service is used by some enterprises, like waste management companies or at places where the air quality state is of the public interest, like airports or highways. This alternative presented by the institute is based on three components: a vehicle, the LabQAr, reference equipment and a software, named Atmis.
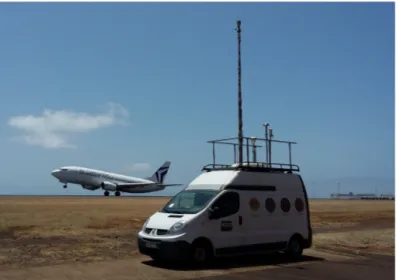
The LabQAr (stands for Laborat´orio m´ovel de monitoriza¸c˜ao da Qualidade do Ar ), is a mobile air quality monitoring laboratory. The Laboratory, which is built inside a van for mo-bility, is fully equipped with a set of analysers which continuously measure the atmospheric concentration of different parameters. The set of parameters measured and the methods used by the equipments are in accordance with the requirements imposed by law, making it a valid and trustable service for measuring air quality. It is also important to note that the equipment installed inside the van, which can be seen in Figure 1.2, are equal to the ones used in the majority of the Air Quality Measurement Networks in Portugal. [3]
All the sensors inside the LabQAr are connected to a desktop stored inside the van, through appropriate cables. This laptop has the Atmis software, which is responsible for periodically gathering the information from all the sensors, do some processing and store it in a local database. The software also provides an interface to access and analyse all the information about the measured air quality.
Figure 1.2: Environment sensors installed in the LabQAr
The problem with this solution is that the software is only accessible locally in the van and does not provide an out of the box solution to have access to it remotely. Currently, checking or retrieving the data stored in the local desktop requires to either have physical access to the vehicle, which is hardly the most practical solution, or to remotely connect to the vehicle’s computer using a third-party peer-to-peer software, like TeamViewer, and manually access the information in the Atmis software. This means that neither the Institute or external companies have access to the information about the air quality state in real time. The Figure 1.3 shows an example of the LabQAr parked in an almost deserted area, next to an airport.
Figure 1.3: The LabQAr collecting at an airport Source: https://www.ua.pt/ReadObject.aspx?obj=40391
1.2.2 Objectives
Motivated by the importance of the air quality monitoring and the need to address poor air quality condition as soon as possible, it is fundamental to provide the interested parties with a way of following the air quality as it evolves. The goal of this work is to conceive and implement a software platform, comprising a Website and a Mobile Application, to allow the Institute and its clients to access the data seamlessly, as it becomes available.
The solution should:
• Integrate user management to keep the data secure,
• Provide a web interface that allows the visualization of present and past air quality values, as measured in different field campaigns
• Provide a mobile application that allows real time access to air quality information anywhere
• Allow the configuration of alarms according to some events (data driven) • Provide a user-friendly interface for an easy to use experience
1.3
Dissertation Structure
This dissertation is divided in seven chapters.
Chapter One presents the motivation and objectives that lead to the development of this work.
Chapter Two describes the State of Art of developing a full-stack solution, focusing on the different possibilities for web and mobile applications.
Chapter Three presents the main users of the system as well as the main functional re-quirements.
Chapter Four describes the system’s architecture with emphasis on each of its components. Chapter Five discusses the solution developed, explaining the most important details and how some of the features were implemented.
Chapter Six explains the tests conducted to validate the system.
Chapter Seven analyses the work completed as well as possible future work to improve and give continuity to the project.
Chapter 2
State of the Art
2.1
Air Quality Metrics
• What is air quality: Air quality is a term that is used to express a pollution level of the air. Air pollution has origin on many sources, both anthropogenic, which results from human activities, and natural causes.
Air pollution is caused by a mixture of chemical substances in the air, that alters the natural constitution of the atmosphere. [1]
• Reference Agencies: The reference agency for air quality monitoring data in Portu-gal is the Agˆencia Portuguesa do Ambiente,or APA, more specifically their QualAr (Air Quality) program. APA provides a website that is an online database about air quality. Their website aggregates data from different stations, each one managed by an Envi-ronmental Comission or Institute, like Dire¸c˜ao Regional do Ambiente e Ordenamento do Territ´orio dos A¸cores or Comiss˜ao de Coordena¸c˜ao e Desenvolvimento Regional do Norte. [4]
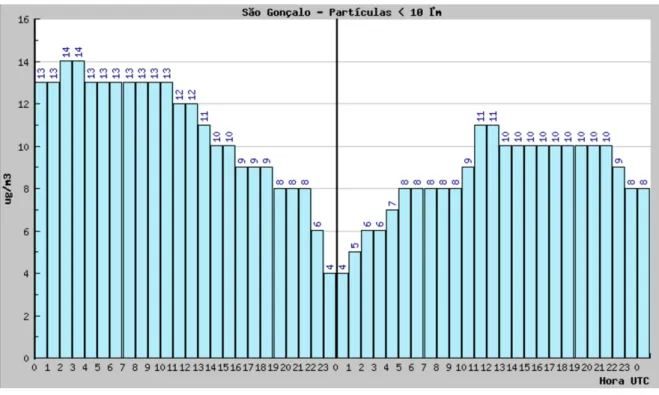
A typical way of representing the air quality metrics is by listing the concentration of each parameter at a certain place and time (as in the Figure 2.1) and the variation of a chosen parameter in the previous 24 hours (Figure 2.2)
Figure 2.1: Latest values registered for each parameter at two different stations Source: Values extracted from http://qualar.apambiente.pt/medicoes.grafico.php
Figure 2.2: Variation of a parameter in the previous 24H
Source: Values extracted from http://qualar.apambiente.pt/index.php?
• Air quality Index: The air quality index is an easy way of translating the air quality that is easily understood both by people with a lot or none knowledge on the air quality topic.
In Portugal this index is calculated by analysing five pollutants: Nitrogen Dioxide (NO2), Sulfur Dioxide (SO2), Carbon Monoxide (CO), Ozone (O3) and Particulate matter with 10 micrometers or less in diameter (PM10). The classification of each parameter is given by the chart in Figure 2.3.
Figure 2.3: Classification chart for each pollutant (in g/m3)
classification.
2.2
Web Development
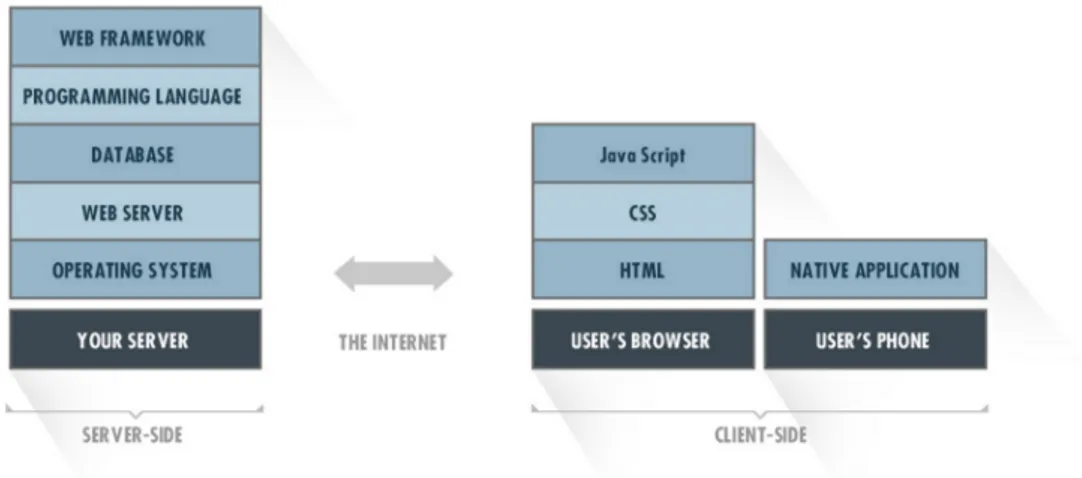
Full stack development means working both with back-end and front-end technologies, from setting up the database to the interface and everything in between. [5]
Figure 2.4: Layers of the full stack development Source: http://svsg.co/how-to-choose-your-tech-stack/
Figure 2.4 shows the major blocks of a typical full stack system, in which each component builds on the features of the block below it. The server-side represents the back-end and the client-side represents the front-end.
Web development can be defined as a evolving set of languages that work together in order to receive, modify and deliver information using the Internet. Although this a concept simple to describe, the overwhelming variety of languages and platforms make it hard to implement, often requiring the developers demanding a broad and deep knowledge from the developer. [6]
When it comes to building a web application, the possibilities are nearly endless, both for back-end technologies and front-end technologies.
2.2.1 Back-end stack
The back-end containes all the logic that is never exposed directly to the user. All the information is passed and obtained to/from the user through the front-end stack.
The choice of a web framework to use also selects a programming language. Even though using a framework is not absolutely necessary, it allows to build an application that is struc-tured and more maintainable, by resorting to a model that is tested and approved.
The choices available for the back-end stack are almost unlimited, but probably the most popular framework choices at the moment include:
• Ruby on Rails: Rails is a web framework that uses Ruby as its programming lan-guage, which is a general purpose programming lanlan-guage, best known for its use in web programming. [7] As the other frameworks, Rails defines a set of conventions that aid the maintenance of the applications and the collaboration between developers. The conventions are known as the Rails API which is documented and described in many books and articles. Rails combines the Ruby programming language with HTML, CSS, and JavaScript to develop the web application. [8]
There are some advantages of using Ruby on Rails: it is an open-source framework and as such there are many third-party plugins available and well documented from the Rails community, freeing the developer from ”reinventing the wheel”; it follows the MVC pattern [8], allowing for a good structure of the application; Ruby offers a clean syntax that is easy to read and write and has a big community with lots of guides and tutorials. Also, it is easy to develop small projects in Ruby on Rails very fast but the learning curve is steeper for bigger projects [9], which represents one of the framework’s disadvantage. Another disadvantage of Rails is that it is considered to be one of the slowest frameworks, not being easily scaled.
• Django: Django is a web framework written in Python which focus on rapid develop-ment and clean, pragmatic design. Django combines the Python programming language with HTML, CSS, and JavaScript to develop the web application. [10]
One of the advantages of using Django is that it offers a powerful database tool, the Django ORM, that handles the creation of the database, as well as insert, update, delete queries and other advanced querying.
Also, similarly to Ruby, Python is a language easy to learn and to read and it is very easy to develop a simple application using the framework and follows the MVC pattern. Django has been around since 2006, and as such it has been highly improved over the years and also maintains by far the largest community out of all python frameworks who has built and maintained many powerful plugins.
• Node.js: Although Node.js [11] is not really seen as a web framework, it is highly used in the development of web applications. There are lots of web frameworks that are based in Node.js, like Express.js, Sails.js, Koa.js, Total.js, etc. [12] Node.js, in its core, is an open-source, cross-platform runtime environment for developing server-side Web applications. The majority of its modules are written in Javascript and the developers can use Javascript to develop new modules too.
The paradigm behind Node.js is a bit different from Django and Ruby on Rails since it is focused in developing realtime web applications using push technology over websock-ets, while the others are more focused in the request-response paradigm. In Node.js the
applications have a two-way connection between the server and the client and either one can initiate the communication. In Django and Ruby on Rails the communication is always initiated by the client.
As well as the other frameworks, Node.js offers its own set of advantages and draw-backs. Like the two other frameworks, it is based on the open web stack, HTML, CSS, JS. Node is supposed to use non-blocking, event-driven I/O to stay light and efficient when faced with real-time applications. Node.js is capable of dealing with a lot of si-multaneous connections with elevated throughput, making it useful for scalable network applications.
This exposes the frameworks’ biggest weakness, the CPU intensive operations and other heavy computation. The other big issue with the framework is that it is not recom-mended to be used with relational databases, since the existing tools for relational databases for Node.js are still in an early stage. For this type of system, it is better use a solution like Django or Ruby on Rails. [13]
2.2.2 Front-end stack
When it comes to building the front-end, the stack of technologies is also subject of some branching although the choices here are not so important or restrictive. The basis of the stack is the HTML, CSS and Javascript. Additionally, it can be added some front-end Javascript frameworks, like AngularJS, BackboneJs or ReactJS but this is not a requirement. Also, it is possible to use presentation frameworks which provide a format for creating responsive web pages with clean aesthetics, like for example the Bootstrap or Google’s Material Design Lite.
2.3
Mobile Computing
In today’s world, mobile computing is an expression becoming increasingly familiar for both users and Developers. [14] As mobile devices keep evolving and becoming faster and cheaper and constant Internet connection becomes possible, mobile solutions have become al-most an obligatory alternative for any company , either as a complete product or as a service. [15]
The improvements in the mobile devices performance, size and price, the almost constant access to Wireless or Mobile Networks make these devices a great alternative for quick access to the Internet and also as a way to support daily activities, and may even replace computers for some people. [16]
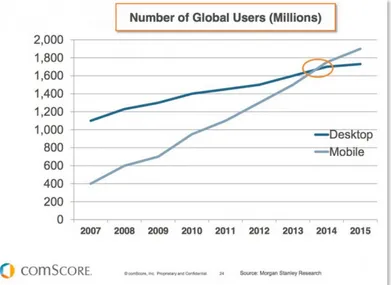
Starting around 2014, the number of mobile accesses to the Internet, using both smart-phones, tablets, etc, as surpassed the number of desktop and notebook accesses, leaving open a huge market for mobile applications and solutions. [17]
Figure 2.5: Number of users accessing the Internet through Mobile vs Desktop, in millions Source: http://www.smartinsights.com/mobile-marketing/mobile-marketing-analytics
/mobile-marketing-statistics/
2.3.1 OS Market Alternatives
The Mobile applications market is segmented into five main groups: Android, iOS, Win-dows Phone, Blackberry OS and all the others that do not represent a very significant part of the market [18]. While the last two segments have been losing ground to the others, and Windows Phone is still trying to gain some projection in the last years, it can safely be said that Android and iOS are the systems dominating the mobile market nowadays.
Given the fact that both of these architectures are dominating the smartphone market, adding to a share of 96.7% of the worldwide smartphones market (data from August of 2015), it is important to notice that Android wins the market by a clear advantage, owning almost 6 times more percentage of the market than iOS, with 82.8% versus 13.9% . [18]
Figure 2.6: Worldwide segmentation on the smartphones market share, in percentage Source: http://www.idc.com/prodserv/smartphone-os-market-share.jsp
Comparing the two main systems, Android’s advantage over iOS comes primarily from the fact that Android is an open source mobile system while iOS is not, putting no artificial barriers to what the users can build and how they take advantage of the powerful mobile hardware. This opens the door for the production of Android devices from dozens of different companies, addressing hundreds of product lines varying from a large range of prices, fea-tures and quality adapting to each user’s possibilities or desires, whereas iOS consist only in a specific set of devices falling into a specific price range, produced only by one company, Apple. Also, Google Play offers an open marketplace for distributing the apps that can be used to easily distribute the application to all compatible devices. [14]
2.3.2 Native vs Web vs Hybrid
When it comes to building a mobile application, some decisions need to be made which can condition the features and the performance of the solution. Apart from the platform itself, the options for creating a mobile application fall into three different categories: Native Applications, HTML5 Applications or Hybrid Applications. [19]
• Native Applications: Native applications are built specifically for the platform where they will be used. These applications are installed on the device and make the best use out of its resources, having access to all its features, including camera, GPS, the noti-fication system, accelerometer, multi touch features, faster graphics, etc. Unlike other solutions, native applications can be developed to work both online or offline, either fully or partially.
However, this type of apps are also the most expensive to develop, requiring more effort and knowledge from the developers, specially if the application is needed across different platforms, which requires the developer to know all the platforms for which different versions of the application are maintained.
Summing up, native applications offer better usability, better features and a better overall experience for the user, at the cost of most expensive and difficult development and maintenance.
Native apps are made available to the users by placing them in the respective app stores of each platform, for example, the Google Play for Android or the App Store for iOS and can be easily installed from there, so they are very easy to find, install and use.
• HTML5 Applications: On the other hand, HTML5 Applications are, in fact, not true applications. They are simply a HTML5, Javascript and CSS3 web page, or a set of web pages, optimized to function in small displays and to mimic the feel and the flow of native applications. They follow a ”write-once-run-everywhere” methodology making a single application available for all the platforms and devices, since they are open inside a web browser.
This type of applications lack the access to the native features of the device and always require Internet access in order to use it but, on the other side, updating the application is much easier because it only requires to update it once, instead of having to update it across every platform and making the update available on the respective store. One of the main problems of this approach is that devices have different screen sizes and resolutions, making the burden of testing the application across all the different screen sizes and resolutions fall on the shoulders of the developers.
HTML5 applications are fairly easier to develop, easier to provide support and can eas-ily reach a wider range of devices making them a great solution for enterprises that need a simple product to be developed and made available to the largest number of users possible in a short time.
• Hybrid Applications: Hybrid Applications are a fusion between the HTML5 and the native approaches, being nothing more than a web application running inside a native wrapper. This wrapper, mostly, is simply a browser view that automatically connects to the web application URL. This simple change, gives access to the native features of the platform, opening doors to a whole new level of functionalities. Besides, hybrid applications are also obtained from the app stores and installed to the device making it easier for the user to get them.
While the overall performance and user experience on this type of application is not the best, this is a good option when the application is needed on multiple platforms but it is still needed the access to some native feature like, for example, the notification system, or it is the company’s interest to have the application available on the stores.
Figure 2.7: Comparison between the three mobile development approaches
Source: https://developer.salesforce.com/page/Native, HTML5, or Hybrid: Understanding Your Mobile Application Development Options
Chapter 3
System Requirements
This section presents the main users of the system developed, as well as the main functional requirements indispensable to make it a useful service. It also gives a brief description of each requirement’s function.
3.1
Actors
The system includes three different groups of actors. The first two groups represent the different types of users who have access to the same basic set of features, although one of them has access to some additional, more restrict features. These groups are the staff members and the partners. The last group does not represent a set of users itself but an already existing process.
• Partners: Partners represent all the users who will have access to the system’s data and its main features, not belong to IDAD. These users are mainly employees from the companies who will use the system as a service and, as such, do not have access to private information and administration features.
The features and type of data available to these users are the same, although each one will only have access to a specific set of data that is related to company he is associated to.
• Staff Members: The staff members are a vital piece to the system operation. They have access to all the features and data, including administrator’s features, being the ones responsible for mapping each other user to his correct set of data and of maintaining some important data without which the system is not useful.
• Environment Sensing System: The last actor represents the part of the system responsible of collecting the main data required, obtained by the environmental sensors.
3.2
Usage scenarios
The requirements of the system can be divided into three segments, Website only re-quirements, mobile only requirements and website and mobile wide requirements. The first
segment encloses some features that are available only to the web application and the second encloses the ones that are exclusive to the mobile application. The last group encloses the set of features that are common for both platforms.
3.2.1 Website Use Cases
The Figure 3.1 illustrates the use cases diagram for the use cases that are specific for the Website, using the UML notation. [20] An additional analyses of the main use cases can be found in the Appendix section.
• Check Air Quality Classification: The user is able of checking the classification of the air quality in a chosen moment, as long as he has at least one campaign associated to him or he is a staff member.
• Analyse Air Quality Variation In The Last 24h: The user is able of examining the classification of the air quality during the previous 24 hours, as long as he has at least one campaign associated to him or he is a staff member.
• Check Latest Data: The user is able to check his most recent data. The result should be different according to the user. If the user is a staff member the latest data corresponds to the last data received from the car; if he is a partner the latest data corresponds to the last data received during his most recent campaign.
• Analyse 24H Variation Of A Parameter: The user is able of examining the varia-tion of a parameter during the previous 24 hours, as long as he has at least one campaign associated to him or he is a staff member.
• Analyse Variation Of a Parameter In A Campaign: The user is able to check the daily variation of a parameter in the duration of a campaign, as long as he has at least one campaign associated to him or he is a staff member.
• Select Campaign: The user is able to select a campaign, as long as he has at least one campaign associated to him or he is a staff member, and access air quality metrics collected during that specific campaign. A campaign is a period of time during which the data is collected for a specific company.
• Browse A Specific Date: The user is able to select any date, as long as he has at least one campaign associated to him and selects a day during the campaign or he is a staff member, and access air quality metrics collected at that specific date.
• Check detected errors and alarms: The user is able of checking the past errors and alarms. The type of errors and alarms available varies according to the type of user. • Authenticate: The user is able to login and logout of the system, as long as he has a
valid account.
• Manage Account Data: The user is able to edit his account name, user name or password.
• Manage Data Collection Campaigns: The user is able to add, edit, or remove a period of time for which the car is collecting data in a location.
• Manage Data Collection Points: The user is able to add, edit, or remove a location for data collection to/from.
• Manage Alarms Limits: The user is able to add, edit, or remove a threshold value for each parameter, above which it will be generated a push notification.
3.2.2 Mobile App Use Cases
The Figure 3.2 illustrates the use cases for the Mobile application.
Figure 3.2: Mobile only use cases diagram
• Check Air Quality Classification: This use case is equivalent to the one specified for the website.
• Analyse Air Quality Variation In The Last 24h: This use case is equivalent to the one specified for the website.
• Check Latest Data: This use case is equivalent to the one specified for the website. • Analyse 24H Variation Of A Parameter: This use case is equivalent to the one
specified for the website.
mobile device, as long as he has at least one campaign associated to him or he is a staff member.
• Check received notifications: The user is able of checking his past received notifi-cations. The type of errors and alarms available varies according to the type of user. • Take tutorial: The user is able of taking a tutorial the first time he uses the mobile
application and, after the first utilization, anytime he desires.
• Authenticate: This use case is equivalent to the one specified for the website.
• Manage Account Data: This use case is equivalent to the one specified for the website.
Chapter 4
Architecture
In this chapter the developed architecture is presented. The complete flow of the system is explained, from getting the data from inside the vehicle until it is presented to the final user and for each step of the flow it is made a small description of the process involved. The solution develop is based on the system already existing in the LabQAr which means it is restrict to the problem presented before but it can be adapted/extended in the future.
4.1
LabQAr’s Legacy System
The process starts inside the LabQAr, responsible to collect data from the sensors in-stalled inside the van.
The data is collected by each sensor individually and it is aggregated by the Atmis soft-ware, installed in the computer inside the vehicle. The Atmis is a system for collecting and processing meteorological data and air data, based in standard protocols and interfaces de-veloped specifically for air quality and meteorological data management. [21]
The software uses a local database, built using Windows SQL Server, to store the data from the sensors. This database is the starting point for the developed system’s data flux.
This part of the architecture is very restrict and specific and it can not be changed.
4.2
System Architecture
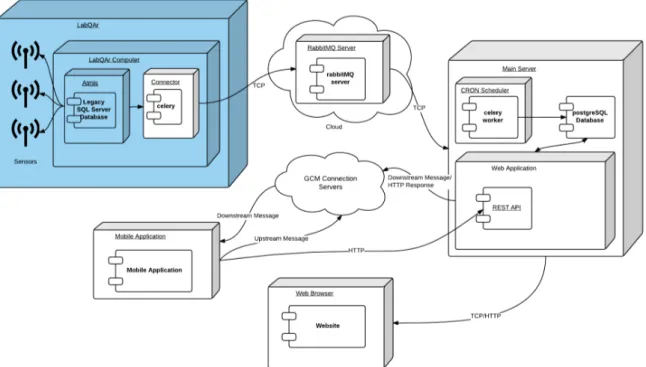
The system architecture can be divided into five main components distributed along mul-tiple platforms and devices (Figure 4.1). These components are the LabQAr, a RabbitMQ Server, a Main Server, a Web Application and a Mobile Application. In the figure, the com-ponents shaded with a blue color are the part of the solution that already exists, inside the van. The only modification there is the inclusion of a module that uploads the data from the sensors to the main server. As it can be seen, the uploaded data is sent through a TCP connection to a RabbitMQ Server before reaching the main server. There, the downloading module is installed, along with the global database and all the logic that supports both the Web and Mobile Applications. The Web Application interacts with the main server through HTTP requests whereas the Mobile Application uses a REST API.
Figure 4.1: Proposed architecture
4.2.1 Watchdog in the LabQAr
In the LabQAr’s computer we deployed the Connector module, which checks the local database for new entries and schedules them to be sent to the online database in the main server, in the form of Celery tasks. Celery is an asynchronous task/job queue based on mes-sage distribution which uses a mesmes-sage queue server for transporting the tasks to the main server. [22]
This Connector is executed by a Windows scheduled task that is set to run every hour. The reason behind the choice of making the task hourly comes from the fact that the Atmis software only saves the data from the sensors to the local database on an hourly basis.
4.2.2 RabbitMQ Server
The proposed architecture requires a messaging queue, working together with Celery to exchange the task messages between the LabQAr’s computer and the Main server. The mes-saging queue can be implemented in a RabbitMQ Server inside the main server but since the main server is inside the Openshift Cloud, the queue is also inside a cloud service.
For this system, it is used RabbitMQ as the message broker, using the CloudAMQP service, which provides a highly available message queue on the cloud, making the bridge between the celery tasks created in the LabQAr and the main server, where the main module of the architecture exists. The tasks sent from the Connector in the van are stored temporarily in the cloud server, until they are fetched by the main server.
4.2.3 Main Server
The main server is built under the Red Hat’s Openshift Cloud service which provides a hosting platform for the core of the architecture. Here lives the online database, a Celery Worker, the website and its web services.
The database used in the main server is a PostgreSQL database. PostgreSQL is a rela-tional database, like the SQL Server used locally in the LabQAr, although it is open-source and can be used in all major operating systems while SQL Server only works on a Windows platform. The use of PostgreSQL allows, therefore, to keep the main server logic independent from the platform where it is installed. This database contains a replica of the all the tables and data existing in the offline database used by the Atmis software in the car, plus some additional tables required to store data relevant for the Web and Android Applications.
Another crucial piece of the architecture is the Celery Worker. To complement the Win-dows shared task scheduler used in the LabQAr, on the main server it is used the CRON jobs scheduler to periodically run a Celery Worker, which will check the CloudAMQP server for new tasks created by the Connector in the LabQAr and execute them locally. Each task executed by the Celery Worker represents an update to the main server’s database.
This job could also be executed once every hour but, since the Openshift platform only support CRON jobs to be run every minute, hour, week or month, it could happen that the tasks were scheduled in the car at a given time and the CRON scheduler only start, in the worst case, one hour later. Therefore, using minutely CRON jobs is the best way to guarantee that the data on the server’s database is updated as soon as its sent from the car.
4.2.4 Web Application
The web application is the last component inside the main server. The application is built using the Django Web Framework, which is a high-level Python Web framework that allows for rapid development and clean design.
This is probably the most important component of the overall architecture since it is re-sponsible for managing user accounts, process the raw data so it can be shown to the user both on the web application and the mobile application, provide an administrator interface to manage the additional data needed across both platforms and also provide a REST interface to use the system from the mobile application. The web application is also responsible for checking the data for alarm situations and specified events and send them to the interested users in the form of notifications.
The Django application makes use of native Django libraries for managing user accounts and log in/log out features. For the REST API, it uses the Django REST framework, which is a powerful and flexible toolkit for building Web APIs. Lastly, the application uses the Django Push Notifications library, which connects to a Google Cloud Messaging (GCM) server to allow sending push notifications to the user’s devices.
4.2.5 Mobile Application
Since Android is the most used mobile Operation System, as it was shown in Chapter Two, and since non-android users can still use the system through the Website, this is the system chosen for the mobile application.
The mobile application interacts with the rest of the architecture through the RESTful web services provided by the Django web application.
This application, similarly to the web application, is connected to a GCM server, so it can be listening for new push notifications from the server.
Chapter 5
System Implementation
The goal of the system is to provide a way of accessing the data from the LabQAr’s equipment without needing to remotely or physically accessing the vehicle to do so, like the solution previously in use. The system does not intend, at any point, to fully replace the current solution, since the Atmis software offers some features that can not be covered in this dissertation, either for limited time or lack of specialized knowledge in the Air Quality field of study.
This chapter explains the implementation process of each component of the system, ex-plaining in more detail some the key parts of the implementation.
5.1
Backend
The system is built around the data collected at the vehicle. The car doesn’t have a stable network connection, which means it was not an option to provide an interface for accessing the data on demand, since the connection service level would vary considerably. This means the best option was to copy the data from the LabQAr to a more reliable location. The car uses a SQL Server database, with more than 30 tables, that was fully replicated to a cloud-based PostgreSQL database. Since the web application was built with the Django Framework and the application is necessarily connected to the database, it is possible to built the new database with the help of Django models.
In Django, a model represents the source of information about the data, since it con-tains the essential fields and behaviors of the data being stored. Usually, a Django model is mapped to a table in the database. Each model is defined by a Python class that extends django.db.models.Model where each attribute of the model represents a table field. By doing this, Django creates an automatically-generated database-access API that can be used for making queries inside the web application.
The following excerpt of code shows the declaration of a model for the table ”Local” (Figure 5.1), which has six fields: an id, which is the primary automatically incremented by the model; a user, which is a foreign key that maps to an entry of another Django Model called ”User” and some other simple fields.
Figure 5.1: UML View of the class ’Local’ 1 c l a s s L o c a l ( models . Model ) : 2 3 c l a s s Meta : 4 v e r b o s e n a m e p l u r a l = ” L o c a l ” 5 6 l c l i d = models . A u t o F i e l d ( p r i m a r y k e y=True )
7 l c l u s e r = models . ForeignKey ( User , o n d e l e t e=models .CASCADE, v e r b o s e n a m e=”
U t i l i z a d o r A s s o c i a d o ”)
8 l c l n o m e = models . C h a r F i e l d ( m a x l e n g t h =50 , v e r b o s e n a m e=”Nome”) 9 l c l m o r a d a = models . C h a r F i e l d ( m a x l e n g t h =255 , n u l l=True , b l a n k=True ,
v e r b o s e n a m e=”Morada”)
10 l c l c o n t a c t o = models . I n t e g e r F i e l d ( n u l l=True , b l a n k=True , v e r b o s e n a m e=”
C o n t a c t o ”)
11 l c L b a c k g r o u n d = models . I m a g e F i e l d ( n u l l=True , b l a n k=True , v e r b o s e n a m e=”
Imagem de Fundo”, u p l o a d t o=’ l a b q a r ’)
Listing 5.1: Django model example
The following code shows the SQL Statement automatically created and used by the framework to create the table in the database.
1 CREATE TABLE l a b q a r l o c a l ( 2 l c l i d i n t e g e r NOT NULL, 3 l c l n o m e c h a r a c t e r v a r y i n g( 5 0 ) NOT NULL, 4 l c l m o r a d a c h a r a c t e r v a r y i n g( 2 5 5 ) , 5 l c l c o n t a c t o i n t e g e r , 6 l c l u s e r i d i n t e g e r NOT NULL, 7 ” l c L b a c k g r o u n d ” c h a r a c t e r v a r y i n g( 1 0 0 ) 8 ) ; 9
10 ALTER TABLE ONLY l a b q a r l o c a l
11 ADD CONSTRAINT l a b q a r l o c a l p k e y PRIMARY KEY ( l c l i d ) ; 12
13 ALTER TABLE ONLY l a b q a r l o c a l
14 ADD CONSTRAINT l a b q a r l o c a l l c l u s e r i d 7 c 6 1 f a b 1 0 9 3 4 4 3 a 4 f k a u t h u s e r i d
FOREIGN KEY ( l c l u s e r i d ) REFERENCES a u t h u s e r ( i d ) DEFERRABLE INITIALLY
DEFERRED;
Listing 5.2: SQL Statement for the model generation
By using the Django models, instead of creating and managing the entire database using SQL Statements, it is only required to define python classes; that would be necessary anyway
to build to web application itself. This method was used to replicate all of the database tables used by the legacy Atmis software.
5.1.1 The Connector Module
After setting up a new database similar to the one from the LabQAr, we implemented the data uploading tasks.
The Connector module makes the bridge between the two databases, and can be seen as if it was divided into two parts, one installed in the car and the other installed in the main server.
Figure 5.2: Connector Module Conceptual Behavior
The main part of the module is installed in the vehicle’s desktop computer, and interacts directly with the local SQL Database using Python’s pyodbc package, through common SQL queries. This module runs periodically, checking for updates, using a Windows shared task.
The code bellow shows the main part of the module. When it starts running, the mod-ule establishes a connection to the local database and tries to find a table named Connec-tor Helper, which is created by the module itself on the very first run. ConnecConnec-tor Helper acts as a log to control the incremental uploads. If the module is running for the first time in the computer or the database is new for some reason, it creates that table and inserts an entry for each database table whose entries are going to be exported to the main database. Each entry of the Connector Helper table is composed by the name of the table to export and a number, which represents the ID of the last entry of that table that was already export.
Once the helper table exists, the Connector is ready to export the data. From that point on, it will start checking for new entries. Every method called since the helper table has been created is similar to the one demonstrated and explained bellow (differ only according to the table they work with). The method checks the ID of the last entry that was exported, from the helper tables, and compares it with the ID from the entries currently existing for that table. If the ID of an entry is bigger than the one saved on the helper table, it is scheduled as a Celery task, which will be explained shortly.
1 d e f a d i c i o n a r r e d e ( c u r s o r ) :
2 l a s t e n t r y = c u r s o r . e x e c u t e (” s e l e c t u l t i m o i d from c o n n e c t o r h e l p e r where
t a b e l a n o m e =\ ’ Rede \ ’ ”) . f e t c h o n e ( )
3 l a s t e n t r y i d = l a s t e n t r y . u l t i m o i d 4
5 c u r s o r . e x e c u t e (” s e l e c t r e d i d , r e d d e s c r i c a o from r e d e where r e d i d >
l a s t e n t r y i d ”)
6 f o r row i n c u r s o r . f e t c h a l l ( ) : 7 #c e l e r y t a s k i n s e r i r r e d e
8 i n s e r i r r e d e . a p p l y a s y n c ( ( row . r e d i d , row . r e d d e s c r i c a o ) , r e t r y=True ,
r e t r y p o l i c y ={ 9 ’ m a x r e t r i e s ’: 0 , # r e t r y u n t i l s e n t 10 ’ i n t e r v a l s t a r t ’: 6 0 , # s t a r t r e t r y i n g one minute l a t e r 11 ’ i n t e r v a l s t e p ’: 3 0 , # w a i t more 30 s e c o n d s b e f o r e e a c h r e t r y 12 ’ i n t e r v a l m a x ’: 1 8 0 , # w a i t a t most 3 m i n u t e s f o r t h e n e x t r e t r y 13 } ) 14 l a s t e n t r y i d = row . r e d i d 15 16 c u r s o r . e x e c u t e (’UPDATE c o n n e c t o r h e l p e r SET u l t i m o i d= ’ + s t r( l a s t e n t r y i d ) + ’ WHERE t a b e l a n o m e =\ ’ Rede \ ’ ; ’) 17 c u r s o r . commit ( )
Listing 5.3: Example of exporting new data entry from the table ”Rede”
From the code above, it is important to notice the retry policy, which guarantees that, if a task fails it will be retried one minute later and then add 30 seconds to the waiting time and try again, until the task is assigned successfully. The waiting time may seem to be relatively high but this is because of the weak network connection inside the van.
The tasks are scheduled using the Celery package. A Celery task performs a dual role since it defines what happens when a task is scheduled (sent as a message), and what hap-pens when a worker receives that message. Each task has a unique name, which represents a method in the web application code, that is referenced in the message so that the worker can find the right function to execute. In the Connector Module main part, the tasks are only used as an interface, to ensure the names are the same as the functions they will execute in the server and so do not take any action. This process can be compared with Remote Method Invocation, however it works asynchronously through the transmission of messages instead of direct method calls.
Configuring the program to use Celery implies some mandatory configurations:
• Broker: Celery needs a message broker to transport the messages. It offers support for both RabbitMQ and Redis servers, and some others in experimental phase. In this system it was chosen the RabbitMQ as the message broker but it can be easily changed if needed.
• Serializer: As well as most messaging services, the data needs to be serialized before being sent, which in Celery can be done using JSON, pickle, yaml and msgpack. In this case, we use JSON since it is simple to use and understand and is supported by most programming languages.
• Additional Configurations: Other configurations can be added but are not required. The set of additional configurations that where used can be seen in the excerpt bellow and are focused in reducing the number of unnecessary messages exchanged between the vehicle and the server to the minimum.
1 #c o n n e c t o r . py
2 app = C e l e r y (’ t a s k s ’) 3 app . c o n f . update (
4 BROKER URL=’ amqp : / / i j g t q k v n : RR3B2rRF−YQXBevJMxweXez−m61TBT f@hare . rmq .
cloudamqp . com/ i j g t q k v n ’,
5 CELERY TASK SERIALIZER=’ j s o n ’, 6 CELERY ACCEPT CONTENT=[’ j s o n ’] ,
7 BROKER POOL LIMIT = 1 , # W i l l d e c r e a s e c o n n e c t i o n u s a g e 8 BROKER HEARTBEAT = None , # We ’ r e u s i n g TCP keep−a l i v e i n s t e a d
9 BROKER CONNECTION TIMEOUT = 3 0 , # May r e q u i r e a l o n g t i m e o u t due t o Linux
DNS t i m e o u t s e t c
10 CELERY RESULT BACKEND = None , # AMQP i s n o t recommended a s r e s u l t backend
a s i t c r e a t e s t h o u s a n d s o f q u e u e s
11 CELERY SEND EVENTS = F a l s e , # W i l l n o t c r e a t e c e l e r y e v . ∗ q u e u e s
12 CELERY EVENT QUEUE EXPIRES = 6 0 , # W i l l d e l e t e a l l c e l e r y e v . q u e u e s w i t h o u t
c o n s u m e r s a f t e r 1 minute . 13 ) 14 15 #t a s k s . py 16 @app . t a s k 17 d e f i n s e r i r r e d e ( r e d i d , r e d d e s c r i c a o ) : 18 r e t u r n
Listing 5.4: Celery configuration on the LabQAR and example declaration of a task On the server side there is a complementary proccess. Here, the Connector does not have a standalone module but lives inside the Django application. While the celery configuration is equivalent, the big difference resides in the tasks declaration. In this case, the task is not a simple interface, but a method that receives the fields from the table entry, creates a new entry using the corresponding Django model and saves it to the live database.
1 #c e l e r y . py
2 app = C e l e r y (’ t a s k s ’, b r o k e r=’ amqp : / / i j g t q k v n : RR3B2rRF−YQXBevJMxweXez−
m61TBT f@hare . rmq . cloudamqp . com/ i j g t q k v n ’)
3
4 app . c o n f i g f r o m o b j e c t (’ d j a n g o . c o n f : s e t t i n g s ’)
5 app . a u t o d i s c o v e r t a s k s (lambda: s e t t i n g s . INSTALLED APPS) #d i s c o v e r s c e l e r y
s e t t i n g s i n s i d e d j a n g o s e t t i n g s . py
6
7 #s e t t i n g s . py
8 CELERY TASK SERIALIZER = ’ j s o n ’ 9 CELERY ACCEPT CONTENT = [ ’ j s o n ’] 10 CELERY IGNORE RESULT = True
11 BROKER POOL LIMIT = 1 # W i l l d e c r e a s e c o n n e c t i o n u s a g e 12 BROKER HEARTBEAT = None # We ’ r e u s i n g TCP keep−a l i v e i n s t e a d
13 BROKER CONNECTION TIMEOUT = 30 # May r e q u i r e a l o n g t i m e o u t due t o Linux DNS
t i m e o u t s e t c
14 CELERY RESULT BACKEND = None # AMQP i s n o t recommended a s r e s u l t backend a s i t
c r e a t e s t h o u s a n d s o f q u e u e s
15 CELERY SEND EVENTS = F a l s e # W i l l n o t c r e a t e c e l e r y e v . ∗ q u e u e s
16 CELERY EVENT QUEUE EXPIRES = 60 # W i l l d e l e t e a l l c e l e r y e v . q u e u e s w i t h o u t
c o n s u m e r s a f t e r 1 minute . 17 18 #t a s k s . py 19 @ s h a r e d t a s k 20 d e f i n s e r i r r e d e ( r e d i d , r e d d e s c r i c a o ) : 21 novaRede = Rede ( r e d i d , r e d d e s c r i c a o )
22 novaRede . s a v e ( )
Listing 5.5: Example of Celery configuration on the server and implementation of a task To fetch the tasks from the message broker and complete the data flow, it is needed one last piece, the celery worker. The worker is a service that will check the broker for new tasks and execute the corresponding method in the web application. This is done by running the command bellow which is part of the script ran periodically by the CRON scheduler on the server.
1 c e l e r y w o r k e r −−w i t h o u t −g o s s i p −−w i t h o u t −m i n g l e −−w i t h o u t −h e a r t b e a t −−app=
l a b q a r − l i n f o
Listing 5.6: Example of running a celery worker
5.1.2 Central Database
As the original database has more than 30 tables both Connector Module ends are ready to schedule and execute the tasks required to export all of them so the solution can be easily scaled in the future. This is also true for the server’s database, which has all the Django models equivalent to all the tables. However, to reduce the number of unnecessary accesses to the original database from the Connector module in this project, all of the empty tables that are not used by the IDAD’s team are excluded from the data export tasks.
Note that the solution aims to establish a connection between the data from the LabQAr and the final user. This is only possible by having a relationship between the users and the campaigns associated with them. Each user can have many campaigns and every campaign is associated to a specific location.
This logic was not available in the data from the original database so, apart from the tables already existing in the original database and that are exported to the server, in the server’s database were created additional Django models that were required to implement this mapping between the data and the users. New entities were also added to support defining a maximum value to a given pollutant to setup up alerts of hazard situations and specific events. Figure 5.3 illustrates the database created to serve the system. The models inside the red shape are the ones that were copied from the legacy database and that are required for the system, the others are the ones used for additional logic.
5.2
Integration API
Since the database and the web application are connected inside the server, the web services are only necessary for the Mobile Application.
The web services developed are RESTful web services, created inside the web application using the Django Rest Framework. They allow the mobile application to provide features and data similar to the one provided by the web application for external clients.
A REST API was setup in the web application by mapping an URL (in the urls.py file) to a method in the controller (views.py file) which will take care of the request and return
the proper response containing the correct HTTP code and, if applicable, the requested data serialized as a JSON object.
1 #u r l s . py 2 u r l (r ’ ˆ r e s t / l a t e s t u p d a t e / ( ?P<i d >[0 −9]+) / $ ’, v i e w s . g e t l a t e s t u p d a t e ) , 3 4 #v i e w s . py 5 @ a p i v i e w ( [ ’GET ’] ) 6 @ a u t h e n t i c a t i o n c l a s s e s ( ( T o k e n A u t h e n t i c a t i o n , ) ) 7 @ p e r m i s s i o n c l a s s e s ( ( I s A u t h e n t i c a t e d , ) ) 8 d e f g e t l a t e s t u p d a t e ( r e q u e s t , i d) : 9 . . . 10 i f l a s t u p d a t e i s n o t None : 11 . . . 12 r e t u r n Re sp ons e ( s t a t u s=s t a t u s . HTTP 200 OK , 13 d a t a={’ d a t e t i m e ’: d a t e t i m e , ’ v a l u e s ’: s e r i a l i z e d v a l u e s , ’ campaign ’: s e r i a l i z e d c a m p a i g n } ) 14 e l s e: 15 r e t u r n Re sp ons e ( s t a t u s=s t a t u s . HTTP 204 NO CONTENT)
Listing 5.7: Example of setting up a RESTfull web service
From the code above, which demonstrates how to setup a RESTfull web service in the web application, it is important to highlight the decorators used for the method in the example. In this case, the API only accepts GET methods (@api view[’GET’]). The other two decorators, are used to ensure that the API interface is only usable by users who have access to the system. This two decorators are used for every method from the API interface, except for the login.
The table 5.1 presents the requests available from the REST API and the corresponding responses. First, when a user successfully logs into the system (request 1) from his mobile phone, through the rest API, he receives, apart from other details, a Token that is needed to authenticate every subsequent call to the REST API. The login is the only operation that does not require the token, since it already forces the user to have a valid account by requiring his user name and password.
Request 8 is normally used after log in. In this request, the id of the user is passed in the POST, along with a token. This token does not have anything to do with the authentication token but it is needed for the push notifications system. Inversely, request number 2, the log out operation, is simply used to inform the server that the user logged out and, therefore, should not receive more push notifications.
For request number 7, in the POST request are passed the details that the user wants to edit and in the response it gets the same details with the information if they were updated or not.
# REQUEST TYPE RESPONSE PURPOSE
1 rest/login/username
/password/ GET
{
’username’: username, ’name’: first name, ’superuser’: True/False, ’id’: user.id,
’token’: token }
Authenticates a mobile user into the system.
2 rest/logout/ POST Status code only, no data
Logs an user out of the system and disables push notifications.
3 rest/latestupdate
/userID/ GET
{
’date time’: date time, ’values’: values,
’campaign’: campaign }
Obtains the latest values available for the specified user.
4 rest/latestupdate
/userID/airindex/ GET {
’date time’: date time, ’index’: index,
’campaign’: campaign }
Obtains the latest air quality classification for the specified user.
5 rest/latestupdate /userID/chart /airindex/ GET {
’index chart’: index chart }
Obtains the air quality classification for the specified user during the last 24 hours.
6 rest/latestupdate /userID/chart /pollutant/ GET { ’value’: values }
Obtains the variation of a selected parameter during the last 24 hours available to the specified user.
7 rest/editsettings/ POST {
’name changed’: T/F, ’name’: user.first name, ’username changed’:T/F, ’username’: username, ’password changed’:T/F }
Updates the user personal details with the given values.
8 rest/savetoken/ POST Status code only, no data
Refreshes the GCM token for the user’s device and enables push notifications. 9 rest/alerts/userID GET
{
’alerts’: alerts }
Gets a list of the most recent notifications received by the user. Table 5.1: REST interface requests, type and sample responses
5.3
Website
Figure 5.4: Django Overall Project Structure
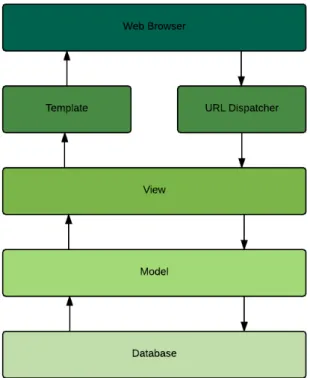
5.3.1 Structure Overview
The Django framework functional structure, Figure 5.4, follows the Model-View-Template (MVT) pattern [23] which plays a central role in every Django application. This pattern can also be analogously compared to a Model-View-Controller (MVC) pattern [24], which might be more familiar since it is extremely popular for building web applications.
In the MVC pattern there are, as the names suggests, three components: the model, the view and the controller. The model represents the data, the logic and rules of the applica-tion; the view is related to the representation of the data and the controller is responsible of accepting some sort of input and convert it in commands for the model or the view. [25]
Comparing to the MVT pattern, it is visible that all the three components are there although they don’t use the conventional names:
• Model: A model in Django represents the data and each model represents a database table.
• View: The view in the MVC is equivalent to the Template in the MVT. It is where the data is presented, in this case by the generation of HTML code.
• Controller: The controller component in the MVC corresponds to the View in the MVT pattern plus the Django URL Dispatcher. This two pieces (View and URL Dis-patcher), when put together, are capable of receiving an input, in the form of an URL
and map it to a view, which can use the Model component to retrive/store data for the Template (View in MVC) component to present it.
5.3.2 Technology Stack
Building a web application requires inevitably using a lot of different technologies since it requires working all the way up the stack, from the database to the interface. Figure 5.5 shows all the technologies that were used to build the web application for this system.
Figure 5.5: Stack of Tecnhologies used in the website
• HTML5+CSS3+Javascript: HTML is the standard markup language for working with web pages. Together with CSS and Javascript, they are the cornerstone technolo-gies used to create web pages, as well as user interfaces for mobile and web applications. • Material Design Lite: Material Design Lite (MDL) is a Google’s framework that allows the Material Design experience using vanilla Web technologies like HTML, CSS and Javascript. Material Design is the Google’s guidelines for building Android appli-cations, so, the choice of the MDL framework falls upon the interest of maintaining a consistent look and feel between the Web and the Mobile applications. It is similar to the Bootstrap framework but it offers a ”Material” implementation of the components. • Ajax:Ajax is not viewed as a technology itself, but a group of technologies which allows for web pages to get and update content dynamically, without the need to reload the entire page.
• Django Rest Framework: Django REST framework is a powerful and flexible toolkit for building RESTfull APIs. The use of this technology in the system will be explained more in depth in the next section.
5.3.3 Supported Interactions
The Web Application provides a set of features more comprehensive than the mobile ap-plication. The set of features required are detailed in the Requirements Chapter and in this
section it is going to be given an explanation of the implementation of each main features and activities.
All the data presented in the screenshots of the application is demonstrative and does not correspond to identified campaigns.
The structure of the application follows the natural structure of a Django Application (Figure 5.6), highlighting the models, views, templates and urls.
Figure 5.6: LabQAr Django App Structure
Before analysing the implemented features, some components of the implementation re-quire a brief explanation. Most of the interface was developed using a combination of plain HTML5+CSS3 and the HTML components from the MDL framework, however this solution does not offer direct support to the presentation of charts so it was necessary to resort to an external Javascript library. The library chosen was the Google Charts library because it offers cross-browser support and has a look that fits into the Material Design concept.
To display the Google Chart, first it is added an empty div to the page and then it is used Javascript to draw it programmatically when desired. In the line 10 of the code bellow, the data is dynamically added to the chart from a template variable that was passed to the context of the HTTP response when the page loaded or obtained from an ajax request, when applicable. On line 17 the chart is created, associated to the empty div and it is drawn in the next line. The rest of the code, from line 20 and forward is necessary to make the chart responsive with the rest of the interface, which does not happen otherwise.
1 < s c r i p t t y p e=” t e x t / j a v a s c r i p t ”>
2 g o o g l e . c h a r t s . s e t O n L o a d C a l l b a c k ( drawChart ) ; 3