Isothermal Amplification (LAMP) Using
Escherichia coli
as
a Model System
Sowmya Subramanian, Romel D. Gomez*
Department of Electrical & Computer Engineering, University of Maryland, College Park, Maryland, United States of America
Abstract
Loop mediated isothermal amplification (LAMP) is a highly efficient, selective and rapid DNA amplification technique for genetic screening of pathogens. However, despite its popularity, there is yet no mathematical model to quantify the outcome and no well-defined metric for comparing results that are available. LAMP is intrinsically complex and involves multiple pathways for gene replication, making fundamental modelling nearly intractable. To circumvent this difficulty, an alternate, empirical model is introduced that will allow one to extract a set of parameters from the concentration versus time curves. A simple recipe to deduce the time to positive,Tp- a parameter analogous to the threshold cycling time in
polymerase chain reaction (PCR), is also provided. These parameters can be regarded as objective and unambiguous indicators of LAMP amplification. The model is exemplified onEscherichia colistrains by using the two gene fragments responsible for vero-toxin (VT) production and tested against VT-producing (O157 and O45) and non-VT producing (DH5 alpha) strains. Selective amplification of appropriate target sequences was made using well established LAMP primers and protocols, and the concentrations of the amplicons were measured using a Qubit 2.0 fluorometer at specific intervals of time. The data is fitted to a generalized logistic function. Apart from providing precise screening indicators, representing the data with a small set of numbers offers significant advantages. It facilitates comparisons of LAMP reactions independently of the sampling technique. It also eliminates subjectivity in interpretation, simplifies data analysis, and allows easy data archival, retrieval and statistical analysis for large sample populations. To our knowledge this work represents a first attempt to quantitatively model LAMP and offer a standard method that could pave the way towards high throughput automated screening.
Citation:Subramanian S, Gomez RD (2014) An Empirical Approach for Quantifying Loop-Mediated Isothermal Amplification (LAMP) UsingEscherichia colias a Model System. PLoS ONE 9(6): e100596. doi:10.1371/journal.pone.0100596
Editor:Krzysztof Pyrc, Faculty of Biochemistry Biophysics and Biotechnology, Jagiellonian University, Poland
ReceivedJanuary 30, 2014;AcceptedMay 28, 2014;PublishedJune 30, 2014
Copyright:ß2014 Subramanian, Gomez. This is an open-access article distributed under the terms of the Creative Commons Attribution License, which permits unrestricted use, distribution, and reproduction in any medium, provided the original author and source are credited.
Funding:The authors acknowledge support from JIFSAN at the University of Maryland. The funders had no role in study design, data collection and analysis, decision to publish, or preparation of the manuscript.
Competing Interests:The authors have declared that no competing interests exist.
* Email: [email protected]
Introduction
Pathogen screening using loop mediated isothermal amplifica-tion (LAMP) is growing in popularity because of its practicality, speed and usefulness in laboratories and clinical settings [1,2]. It compares quite favorably in both sensitivity and selectivity with polymerase chain reaction (PCR) [2,3], as improvements of the method continue at a brisk pace. Since its introduction [4], methods to quantify LAMP have been implemented. These involve novel real-time sensing techniques utilizing fluorescence [5], turbidity [6] or electrochemical processes [7] and ion-sensitive field effect transistors [8,9] similar to those used in PCR. Yet, while there is progress in quantitative acquisition of data, a mathemat-ical model to characterize the data remains elusive. Unlike PCR, LAMP is isothermal and does not have cycling steps for counting the number of times the concentration doubles. LAMP is a two-step process that involves the formation of so-called dumbbell structures that become the starting template for the subsequent replication. These structures replicate in an auto-cycling process, which also generate by-products that further amplify the target gene by concatenation of its sequence into progressively length-ening DNA strands [10]. This process is highly parallel, thus
making it very difficult to model using first principles. Neverthe-less, quantifying LAMP has potentially very important benefits. It could allow unambiguous comparisons between strains, better assessment of probe effectiveness, and better understanding of the effect of sample extraction and purification, and perhaps even allow precise determination of the absolute numbers of gene copies. In this paper, a simple protocol is presented for measuring and characterizing the concentration as a function of time. For illustrative purposes, the technique was demonstrated for detecting vero-toxin producing Escherichia coli (E. coli). The fluorescence intensity of the sample was measured by using a Qubit 2.0 fluorometer at specific intervals of time to provide a time series snapshot of the LAMP amplification process. The intensity was converted into concentration and its behavior with time was fitted using generalized logistics function. This best fit yielded several parameters including time to positive,Tp, the analog of cycling
threshold,CT, in PCR. Those parameters were analyzed for two
well as influence of the purity of the target DNA was similarly studied.
Vero-toxin (VT) producing E. coli was chosen as a test case because of its relative familiarity [11] and because of its culpability in disrupting our food supply. Additionally, as with most food borne pathogens, there is a need for automated screening [12,13], for which this method can be very useful. This contribution is built upon the work of others [14,15] who first demonstrated the use of LAMP in rapidly detecting certain VT-producing strains ofE. coli. Their protocols and primer designs were mimicked though out this project [14].
Materials and Methods
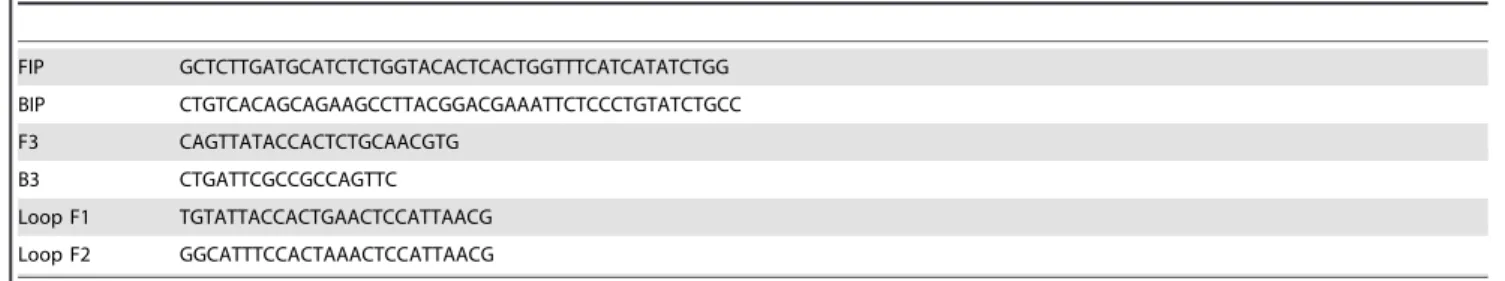
The primers used are listed in the Tables 1 and 2. The additional loop primers designated as Loop F, Loop F1 and Loop F2 help in accelerating the LAMP reaction and in increasing the specificity of the reaction [16].
Sample Preparation
The DNA was extracted from the different strains ofE. colicells using two methods: 1. Using the UltraClean Microbial DNA Isolation Kit (MO BIO Laboratories, Inc.) designated as ‘highly purified’, and 2. Using the InstaGene kit, designated as ‘less purified’. The DNA products extracted using either of the extraction kits were diluted to their starting concentrations using 1 mM TE buffer (pH 8.0). The starting concentrations of the different strains ofE. coliare listed in Table 3.
LAMP Protocol
The LAMP reaction was carried out in a 25ml reaction mixture. The LAMP cocktail for both VT1 and VT2, containing 1.6mM each of FIP and BIP, 0.2mM each of F3 and B3, 0.8mM
each of the loop primers, 400mM of each dNTP, 1 M betaine, 20 mM Tris-HCl (pH 8.8), 10 mM KCl, 10 mM (NH4)2SO4,
4 mM MgSO4, 0.1% Triton X-100 and 16U Bst DNA
polymerase was prepared (24ml per reaction) [10,14]. 1ml of
target DNA of concentration in the range of a 1–10 pg/ml is added
to the LAMP cocktail. The reaction is allowed to proceed for 60– 180 minutes at 65uC.
LAMP reaction was performed in multiple tubes, all containing the same LAMP cocktail with the target DNA of interest (strain O157, O45 or DH5 alpha). A new tube was placed in the heating element set at 65uC every minute for the first 15 minutes and every 15 minutes thereafter for a total time of 2 hours. Incidentally, the heating instrument is homemade and uses aluminum blocks with wells that conform to the shape of 0.2 ml PCR tubes. The temperature variation was less than 0.2uC over the entire course of the experiment. The tubes were then inspected using Qubit 2.0 fluorometer, using Qubit proprietary reagents and dyes. This procedure allowed us to measure the DNA concentration after specific hybridization time.
Qubit 2.0 Intensity-DNA Concentration Calibration
The Qubit 2.0 protocol for calibrating the fluorescent intensity was followed as described in the manual [www.invitrogen.com/ qubit]. Two DNA assay kits were prepared from the calibration standards provided by the manufacturer and their fluorescence signals were measured. An example of the calibration is shown in Figure S1, where the two points corresponding to 0 and 5 ng/mL
DNA concentration and their corresponding fluorescence curves are plotted. Since the concentration levels in these experiments in the range of 10–200 ng/mL, the DNA samples were further
diluted in order to put them within the range of the calibration. The dilution factor is used by Qubit 2.0 algorithm to calculate the actual concentration. After the calibration routine, the device simply displays the concentration and information about the raw fluorescence intensity is omitted.
Analyses of LAMP products
Turbidity measurements and electrophoresis were performed at the start of the experiments to ensure that the protocols and primers worked. The turbidity level of the LAMP solution was taken as a qualitative assessment of the quantity of the amplicons, while banding in gel electrophoresis in 1.5% agarose gel is used to corroborate the turbidity results. After the preliminary investiga-tions, the concentration of the LAMP products was recorded using the fluorometer. There were several PCR tubes containing various primers, reagents and the DNA target (O157, O45 or DH5 alpha). For the negative control experiment, the tube contained the VT LAMP primers and reagents but was reacted with the DH5 strain, a non-VT producing E. colistrain. After a given duration of at 65uC, a set of samples were removed from the isothermal heater, cooled to room temperature and analyzed. This measurement gave the amount of DNA that has been synthesized up to that point in time, with the assumption that amplification is arrested once the sample temperature falls below 60uC.
Results
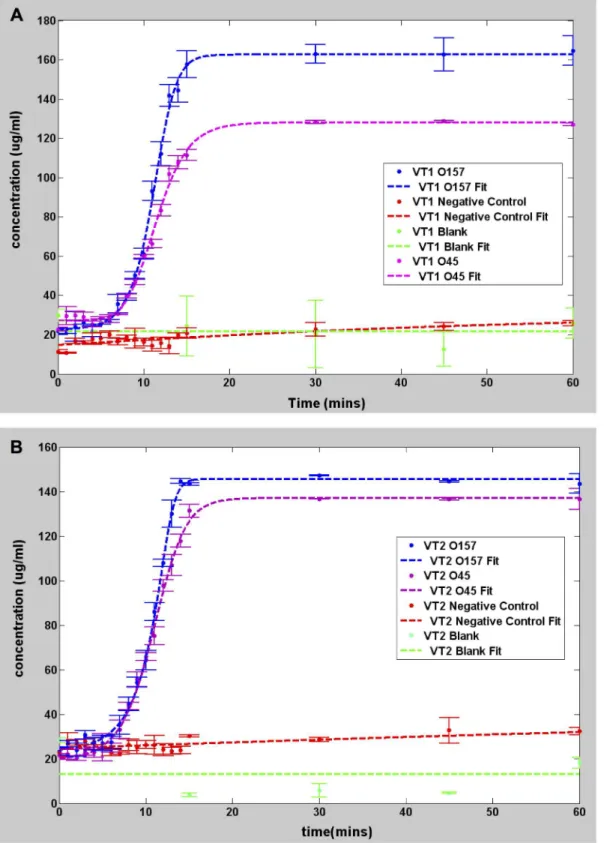
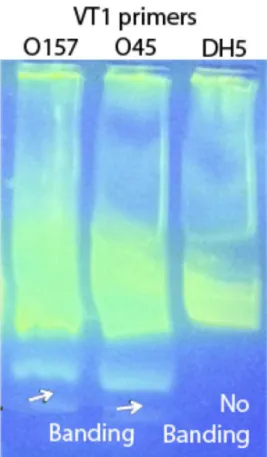
Figure 1 shows the concentration versus time for the 0157 and 045 strains, as well as the DH5 alpha negative control strain. Each reading was done in duplicate. Both O157 and O45 were positive to the VT1 and VT2 genes as exhibited by the rapid increase in concentration. For both strains, the concentration of the VT1 and VT2 genes increased exponentially and saturated within 20 minutes. By contrast, the concentration for the negative control DH5 alpha genes showed little to no increase even after 1 hour, in the same manner as the blank target. These observations are consistent with the electrophoresis results shown in Figure 2, in which banding was observed in the O157 and O45 lanes amplified using VT1 and VT2 genes, while no banding was seen for DH5 alpha strain. To understand the influence of the starting concentration, 3 different starting target concentrations of highly purified DNA, namely 13.8 pg/ml, 146 pg/ml and 1.4 ng/ml of the
Table 1.VT1 primer sequence from 59to 39. GenBank database accession no. BA000007.
FIP GCTCTTGCCACAGACTGCACATTCGTTGACTACTTCTTATCTGG
BIP CTGTGACAGCTGAAGCTTTACGCGAAATCCCCTCTGAATTTGCC
F3 GCTATACCACGTTACAGCGTG
B3 ACTACTCAACCTTCCCCAGTTC
Loop F AGGTTCCGCTATGCGACATTAAAT
O157 target were examined. Figure 3 shows the data and the corresponding fit for the three dilutions of the target DNA. The three different target concentrations increased exponentially and saturated within 15 minutes, although at different rates.
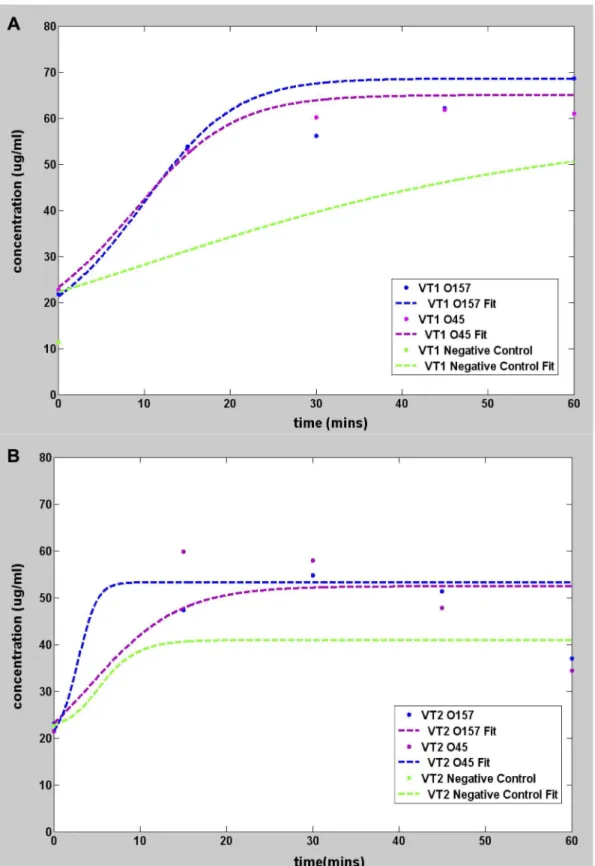
As with any standard DNA replication, the purity of the target DNA affects the efficiency of amplification. To assess the influence of sample purity, an identical set of experiments using InstaGene kit purified samples were conducted and the result is shown in Figure 4.
Discussion
Baseline and saturation reading from Qubit 2.0
From the data, the initial concentrations were in the range 10– 30mg/ml in all samples including the blank with no target DNA. Thus, the initial fluorescence signal must be regarded as the baseline reading from the other elements of the cocktail and has no relation to the actual initial target DNA concentration. Neverthe-less, the signal at the onset of saturation (t.20 minutes) minus the baseline can be taken as a true measure of the final concentration of the synthesized DNA fragments.
LAMP mathematical model
As seen from Figure 1, the amplification behavior of the positive samples is in stark contrast with the negative control. The positive samples exhibit a definite ‘turn on’ time after which the concentration precipitously rises. The negative and blank concen-trations increase as well but are less abrupt and at significantly lower rates. Thus, one can qualitatively conclude that the O157 and O45 contain VT1 and VT2 genes, whereas the DH5 alpha strain does not.
As valuable as qualitative assessments are, they do not provide information about the amplification rates and the precise threshold time marking exponential replication. These can be obtained using an empirical model of the curves represented by a generalized logistic function. Generalized logistic function or Richard’s curve are used in predicting population growth, cancer tumor growth, reaction models, and others in which there are multiple competing factors [17]. In LAMP, there is a competition between the so-called extended cauliflower-like structures and the complementary
dumb bell structures in the cycling amplification step. The equation for the generalized logistic function is given by
y(t)~az (k{a)
1zQe{b(t{m)1=v, ð1Þ wherey(t)is the concentration of amplicon at timetminutes,kis the concentration of amplicon at infinite time andais the lower bound. There are two other variables associated with this equation namely m and b. In order to impose the condition that the parameter,m, reflect the time at maximum growth rate Eq.1 is simplified by settingQ =n[17]. Furthermore, when fitted as free parameters,Qandn, are on order unity and weakly influence the other fitting parameters. Thus, for reasons of simplicity, we arbitrarily set these parameters to 1. The data can be fitted using this simplified model so that the parametersa, k, m, andbcan be extracted. Standard numerical techniques are available elsewhere, and in this case, the MATLAB Curve Fit Tool was used to perform the curve fitting.
Based on these parameters, one can assign a timeTp[5], which
is the amplification threshold, analogous to the cycling threshold,
CTin PCR. A unique way to identify this point is assign it as the
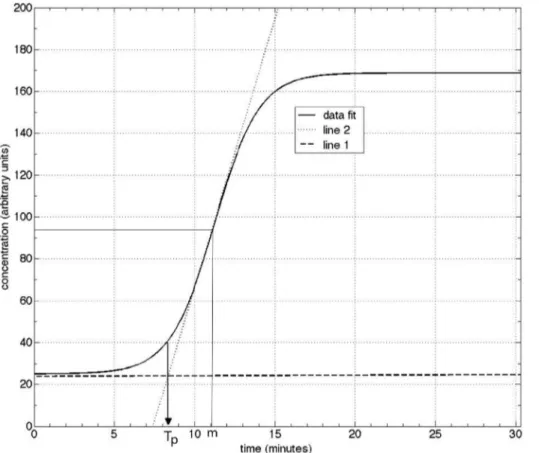
time that corresponds to the intersection of the initial linear portion of the pre-amplification curve (line 1) and the linearized section of the exponential growth curve (line 2). This is depicted in Figure 5, representing the data for the O157 VT1 set.
The process for obtainingTp is straightforward, which can be
obtained by construction, i.e., manually drawing the lines. Alternatively, one can obtain it analytically as follows. Line 1 is given as
y1~b1tza1 ð2Þ
with
b1~dy1
dtDt~manda1~y1(t~0) ð3Þ
Line 2 is given as,
Table 2.VT2 primer sequence from 59to 39. GenBank database accession AE005174.
FIP GCTCTTGATGCATCTCTGGTACACTCACTGGTTTCATCATATCTGG
BIP CTGTCACAGCAGAAGCCTTACGGACGAAATTCTCCCTGTATCTGCC
F3 CAGTTATACCACTCTGCAACGTG
B3 CTGATTCGCCGCCAGTTC
Loop F1 TGTATTACCACTGAACTCCATTAACG
Loop F2 GGCATTTCCACTAAACTCCATTAACG
doi:10.1371/journal.pone.0100596.t002
Table 3.Starting concentrations of template DNA used in LAMP reaction.
E. coliStrain Concentration (pg-ml21 )
O157 7.54
O45 13.8
DH5 8.47
Figure 1. Graphs showing pseudo real time amplification of target DNA. All measurements made using Qubit 2.0.A. Plot showing DNA amplification usingE. coliO157, 045 and DH5 highly purified genomic DNA as target for VT1 gene. B. Plot showingE. coliO157, 045 and DH5 highly purified genomic DNA as targets for VT2 gene.
y2~b2tza2 ð4Þ
with
b2~dy2
dtDt~m,and a2~y2(t~m){b2m: ð5Þ
Since, att = TP, we obtain
TP~ a2{a1
b1{b2: ð6Þ
In terms of the fit parameters, we recognize that Eq. (3) and Eq. (4) yield
a1~a,
b1%0,
b2~{b að {kÞ
4 ,
a2~ azk
2 z
bm að {kÞ
4 :
ð7Þ
Substitution into Eq. (6) yields a very simple expression for the time to positive,
TP~m{
2
b ð8Þ
This simple and convenient procedure provides a standardized method for unambiguously extracting Tp. We used Eq. (8) to
compute theTpappearing in Tables 4–6. Figure 2. Gel electrophoresis of LAMP products showing bands
formed by the positive sample and absent in the negative control.
doi:10.1371/journal.pone.0100596.g002
Figure 4. Graphs showing pseudo real time amplification of InstaGene kit purified target DNA. All measurements made using Qubit 2.0.Plots showing DNA amplification usingE. coliO157, O45 and DH5 alpha (negative control) InstaGene kit purified genomic DNA as target for VT1 gene (Figure 4A) and VT2 gene (Figure 4B).
LAMP using highly purifiedE. coligenomic DNA
The values of the best-fit parameters for each of the curves of Figure 1 are listed in Table 4. The parameter a, is the baseline signal andkis the saturation signal. As discussed previously, this severely overestimates the starting target concentration. However,
kcan be regarded as a direct indicator of the final concentration. The parametermdenotes the time in which the maximum slope of the generalized curve occurs. This number ranges from 10.87 to 11.49 minutes for the positive samples, and significantly longer for the negative control. This parameter is due to the intrinsic latency involved in the creation of sufficiently large numbers of starting dumbbell structures [10] that initiate the cycling amplification step
and the subsequent formation of the multi-loop cauliflower-like structures. For the negative samples, the amplification is primarily non-specific, so there is no clear onset for the formation of multiloop structures. The blank samples yielded low values that are essentially noise since the R2parameter is negative, indicating that there is no correlation between the model and the data. The other important parameter is b in units of inverse time. It is a measure of the maximum steepness of amplification rate at the exponential growth stage. It can also be interpreted as the reciprocal of the time constant for the reaction, which has to do with the factors that hinder the reaction kinetics, such as steric hindrance or the probability associated with the competition
Figure 5. Procedure for determining the time to positive,Tp, as the intersection of the pre-amplification line (line 1) and the linear extrapolation of the amplification growth section (line 2).The data set for O157VT1 is used for this illustration.
doi:10.1371/journal.pone.0100596.g005
Table 4.Values of parameters of the Richard’s curve fit for graphs of Figure 1 using Equation 1 with Q = v = 1.
Data Set a (mg/ml) b (mins21) k (mg/ml) m (mins) R2 Tp(mins)
O157 VT1 23.84 0.74 163 11.1 0.998 8.39
O157 VT2 26.85 0.77 146.6 10.87 0.996 8.27
O45 VT1 26.03 0.56 127.7 11.49 0.997 7.92
O45 VT2 20.45 0.54 137.2 10.87 0.998 7.18
Neg Cntl DH5 alpha VT1 10.56 0.03 30.9 28.81 0.823 237.86
Neg Cntl DH5 alpha VT2 16. 73 0.03 37.13 20 0.7769 246.67
Blank VT1 6.227 0 30 0.54 21 -inf
Blank VT2 10 0.006 13.11 0 22 2333.33
Also included are the R2goodness of fit parameter, and the time to positive parameter,T
p, extracted using Equation 6.
between primer binding. This parameter is the most sensitive between positive and negative samples, and usually varies by more than an order of magnitude. More importantly, the data shows that Tp, given by Eq. (8), can be regarded as an unequivocal
indicator of LAMP amplification. Note that the DH5 alpha (negative control) and the blank samples yielded negative Tp.
Negative values for Tp are unphysical as they correspond to
amplification that occur even prior to the start of the LAMP process. Thus, we conclude that negative values for Tp can be
regarded as an indicator of a negative LAMP amplification result.
Effect of starting DNA concentration
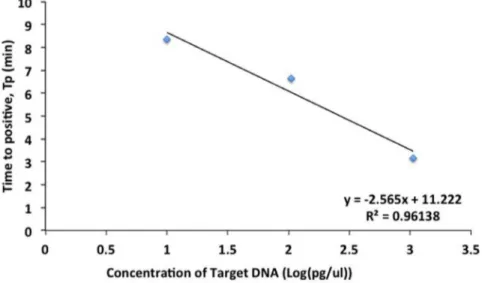
The best-fit parameters for the curves of Figure 3 are summarized in Table 5. The tenfold dilution series, which spans pg-ml21 to ng-ml21 range, shows a highly linear relationship
between withTpas shown in Figure 6. Also seen from Table 5,mis
inversely related to the initial DNA concentration. Recalling that
mrepresents the time for maximum rate of amplification, this is expected since the probability for the primers to bind to one of the many target DNA regions of the genomic DNA is proportional to the initial target concentration. Higher initial target concentration leads to rapid creation of the starting (dumbbell) structure, and consequently, the maximum amplification rate occurs earlier.
Parameter b can be regarded as the maximum rate of amplification of the target. Mathematically, it can be defined as the change in concentration over unit time, which graphically is the slope of the Richard’s curve at its steepest part or at timet = m. As Table 5 shows, the parameter b is inversely related to the concentration, i.e., the fastest rate is observed for 13.8 pg/ml and
the lowest for 1.4 ng/ml. Although, the exact mechanism has to be
rigorously established, we hypothesize that after mminutes have elapsed, there is enhanced competition between the genomic DNA and the amplicons for the primers. If the primers were to bind to the genomic DNA the starting dumbbell structure will be produced, whereas if they were to bind to an amplicon (either a starting-dumbbell structure or a cauliflower structure), then amplification will occur. Thus, in the case of high target concentration, the overwhelming amount of genomic DNA
relative to the amplicons will cause the primers to preferentially bind to the genomic DNA, than to the amplicons, thereby reducing the rate of amplification. Conversely, in the case of a lower concentration of genomic DNA, the number of the amplicons produced after time m may become comparable to the amount of genomic DNA targets so that the probability of the primers binding to the amplicons becomes comparable or even higher than the probability of the primers binding to the genomic DNA. This could explain why the amplification rate observed in our results is highest at the lowest concentration.
LAMP reaction using InstaGene kit extractedE. coli
genomic DNA
Following the same protocols as before, LAMP was performed on the less (Instagene kit) purified samples. The initial concentra-tion was in the range of 1mg/mL as was used in the previous
samples. The amplification curves are shown in Figure 4, and, the fitting parameters are summarized in Table 6. The main difference with the highly purified samples is that thebparameter representing the maximum rate of amplification is significantly lower in the less purified samples. With such low sensitivity it is unclear if the DNA synthesis is due to amplification of the target or to non-specific binding, which obscures the interpretation of LAMP. Fortunately, this conundrum can be resolved by calculat-ing Tp. Substitution ofb and m from the fit into Eq. (8) yields
negative values forTp. Having established earlier (see Table 5) that
negativeTp was an indicator of a null result for negative-control
and blank sample, it can be concluded that VT1 and VT2 genes were not synthesized in the less purified samples. PCR amplifies a single strand of the target DNA stepwise during thermal cycles, whereas LAMP does so continuously using a double stranded DNA template and strand displacement based DNA synthesis. Thus, the LAMP method of DNA amplification may be very sensitive to the additional substances present in less purified samples that interfere with the DNA synthesis process. Hence it is not surprising that Instagene purified samples work in PCR but not in LAMP. Still, other researchers report that LAMP could be less affected by inhibitory substances in the clinical sample than
Table 5.Values of parameters of the Richard’s curve fit for graphs of Figure 3 using Equation 1 with Q = v = 1.
Analysis a (mg/ml) b (mins21) k (mg/ml) m (mins) R2 Tp(mins)
O157 VT1 13.8 pg-ml-1 23.84 0.73 163 11.1 0.998 8.36
O157 VT1 146 pg-ul-1 22.03 0.52 165 10.48 0.9975 6.63
O157 VT1 1.46 ng-ul-1 12.39 0.34 174.9 9.05 0.9922 3.16
Also included is the time to positive parameter,Tp, extracted using Equation 6.
doi:10.1371/journal.pone.0100596.t005
Table 6.Values of parameters of the Richard’s curve fit for less purified target samples extracted using the InstaGene kit.
Analysis a (mg/ml) b (mins21) k (mg/ml) m (mins) R2 Tp(mins)
O157 VT1 10.07 0.2 68.62 2.498 0.801 27.50
O45 VT1 10 0.19 65 6.062 0.858 24.46
O157 VT2 10.1 0.1937 52.4 5.123 0.607 25.20
O45 VT2 17.17 0.1998 53.25 3.948 0.573 26.06
Neg Cntl DH5 VT1 11.3 0.0355 58.01 20 0.903 236.34
Neg Cntl DH5 VT2 22.65 0.04 40.9 20 0.54 230.00
PCR and that the purification step can be omitted [18]. In fact, it has been recently reported thatE. colican be detected by LAMP directly from urine samples without DNA extraction [19]. That these results are at odds with ours may be understood by noting that their study targeted theE.colimalB gene, which is a conserved gene across diverse lineages of E. coli. Because it is non-discriminatory, their assay is extremely sensitive and thus more robust against impurities. But our experiment targets very specific vero-toxin markers, and it is perhaps this stringency that makes LAMP sensitive to target purity in this case.
Conclusions
In conclusion, a model using a simplified generalized logistic function (Richard’s curve) is proposed to quantify the LAMP amplification process. The technique was exemplified in identify-ing vero-toxin producidentify-ing O157 and O45E. colistains from highly purified samples, as well as discriminating the non-VT strain and assessing the influence of impurities. The model yields several parameters that uniquely describe the amplification curve as a function of time and from which, the time to positive, Tp, was
extracted. In general, the modeling offers several advantages. First, it is a compact way to characterize individual concentration growth curves using only 4 parameters. This allows easy analysis, transmission and archival of data, which will become even more important as LAMP screening becomes more prevalent. Second, the proposed model can be used as a universal standard for comparing LAMP amplification. By using a heuristic model,
researchers can meaningfully compare results from different techniques for measuring the concentration (e.g. fluorescence, optical absorbance, turbidity). Standard curve fitting packages are available e.g., MatLab which is straightforward to set up. Third, the quantification removes human bias in interpreting the results so that it becomes possible to perform high throughput and automated data screening. Finally, a universal standard method for expressing LAMP data will facilitate statistical inferences involving large population sizes.
Supporting Information
Figure S1 Calibration plot for Qubit 2.0.
(TIFF)
Acknowledgments
The authors would like to acknowledge Wenting Ju, Department of Food Nutrition and Science, University of Maryland, College Park for extracting the target DNA fromE. coli cells, along with Dr. Wenxia Song of the University of Maryland and Dr. Raul Destura of the University of the Philippines for helpful discussions. Support from JIFSAN at the University of Maryland.
Author Contributions
Conceived and designed the experiments: SS RDG. Performed the experiments: SS. Analyzed the data: SS RDG. Contributed reagents/ materials/analysis tools: RDG. Wrote the paper: SS RDG.
References
1. Parida M, Sannarangaiah S, Dash PK, Rao PVL, Morita K (2008), Loop mediated isothermal amplification (LAMP): a new generation of innovative gene amplification technique; perspectives in clinical diagnosis of infectious diseases. Rev Med Virol 18: 407–421.
2. Mori Y, Kanda H, Notomi T (2013), Loop-mediated isothermal amplification (LAMP): recent progress in research and development. J Infect Chemother 19 (3): 404–411.
3. Mori Y, Notomi T (2009), Loop-mediated isothermal amplification (LAMP): a rapid, accurate and cost-effective diagnostic method for infectious diseases. J Infect Chemother 15 (2): 62–69.
4. Notomi T, Okayama H, Masubuchi H, Yonekawa T, Watanabe K, at al. (2000), Loop-mediated isothermal amplification of DNA. Nucleic Acids Res 28 (12): e63.
5. Tomlinson JA, Dickinson MJ, Boonham N (2010), Detection ofBotryris cinereaby loop-mediated isothermal amplification. Lett Appl Microbiol 51: 655.
6. Soleimani M, Shams S, Majidzakeh AK (2013), Developing a real-time quantitative loop-mediated isothermal amplification assay as a rapid and accurate method for detection of Brucellosis. J Appl Microbiol 11: 828–834. 7. Hsieh K, Patterson AS, Ferguson BS, Plaxco KW, Soh HT (2012), Rapid,
Sensitive, and Quantitative Detection of Pathogenic DNA at the Point of Care through Microfluidic Electrochemical Quantitative Loop-Mediated Isothermal Amplification. Angew Chem Int Ed Engl 51: 4896–4900
8. Toumazou C, Shepherd L, Reed S, Chen G, Patel A, et al. (2013) Simultaneous DNA amplification and detection using a pH-sensing semiconductor system, Nature Methods 10 (7) 641–646.
9. Veigas B, Branquinho R, Pinto J, Wojcik P, Martins R, et al. (2014), Ion sensing (EIS) real-time quantitative monitorization of isothermal DNA amplification, Biosens. Bioelectron. 52, 50–55.
Figure 6. Standard Curve of Time to positiveTpversus log of concentration (in pg-ml21).
10. Tomita N, Mori Y, Kanda H, Notomi T (2008), Loop-mediated isothermal amplification (lamp) of gene sequences and simple visual detection of products. Nat Protoc 3 (5): 877–882.
11. Thorpe CM (2004), Shiga toxin-producingEscherichia coliinfection. Clin Infect Dis 38 (9): 1298–1303.
12. Ge B, Meng J (2009), Advanced technologies for pathogen and toxin detection in Foods: Current applications and future directions. J Lab Autom 14 235–241. 13. Gould LH, Bopp C, Strockbine N, Atkinson R, Baselski V, et al. (2009),
Recommendations for Diagnosis of Shiga Toxin-Producing Escherichia coli
Infections by Clinical Laboratories. MMWR Recommended Report, 58, RR– 12, p. 1–14.
14. Hara-Kudo Y, Nemoto J, Ohtsuka K, Segawa Y, Takatori K, et al. (2007), Sensitive and rapid detection of vero toxin-producingEscherichia coliusing loop-mediated isothermal amplification. J Med Microbiol 56: 398–406.
15. Hill J, Beriwal S, Chandra I, Paul VK, Kapil A, et al. (2008), Loop-mediated isothermal amplification assay for rapid detection of common strains of
Escherichia coli. J Clin Microbiol 46 (8): 2800–2804.
16. Nagamine K, Hase T, Notomi T (2002), Accelerated reaction by loop-mediated isothermal amplification using loop primers. Mol Cell Probes 16: 223–229. 17. Fekedulegn D, Mac Siurtain MP, Colbert JJ (1999), Parameter estimation of
nonlinear growth models in forestry, Silva Fennica 33: 327–336.
18. Kaneho H, Kawana T, Fukushima E, Suzutani T (2007), Tolerance of loop-mediated isothermal amplification to a culture medium and biological substances, J. Biochem. Biophys. Methods (70): 499–501.