Variability of Gross Tumor Volume
in Nasopharyngeal Carcinoma Using
11
C-Choline and
18
F-FDG PET/CT
Jun Jiang1☯, Hubing Wu2☯, Meiyan Huang1, Yao Wu1, Quanshi Wang2, Jianqi Zhao1, Wei Yang1, Wufan Chen1, Qianjin Feng1*
1School of Biomedical Engineering, Southern Medical University, Guangzhou, China,2Department of PET Center, Nanfang Hospital, Guangzhou, China
☯These authors contributed equally to this work. *[email protected]
Abstract
This study was conducted to evaluate the variability of gross tumor volume (GTV) using
11
C-Choline and18F-FDG PET/CT images for nasopharyngeal carcinomas boundary defini-tion. Assessment consisted of inter-observer and inter-modality variation analysis. Four radiation oncologists were invited to manually contour GTV by using PET/CT fusion obtained from a cohort of 12 patients with nasopharyngeal carcinoma (NPC) and who underwent both11C-Choline and18F-FDG scans. Student
’s paired-samplet-test was per-formed for analyzing inter-observer and inter-modality variability. Semi-automatic segmen-tation methods, including thresholding and region growing, were also validated against the manual contouring of the two types of PET images. We observed no significant variation in the results obtained by different oncologists in terms of the same type of PET/CT volumes. Choline fusion volumes were significantly larger than the FDG volumes (p<0.0001, mean±
SD = 18.21±8.19). While significantly consistent results were obtained between the oncol-ogists and the standard references in Choline volumes compared with those in FDG vol-umes (p = 0.0025). Simple semi-automatic delineation methods indicated that11C-Choline
PET images could provide better results than FDG volumes (p = 0.076, CI = [–0.29, 0.025]).
11
C-Choline PET/CT may be more advantageous in GTV delineation for the radiotherapy of NPC than18F-FDG. Phantom simulations and clinical trials should be conducted to prove the possible improvement of the treatment outcome.
Introduction
The incidence of nasopharyngeal carcinoma (NPC) is higher in southern China than in other countries. To treat this disease effectively, radiotherapy treatment (RT) is recommended by oncologists.
In clinical practice of NPC treatment, MR images are usually used as references to CT
images to determine gross tumor volume (GTV) during RT [1]. Registration algorithms have
OPEN ACCESS
Citation:Jiang J, Wu H, Huang M, Wu Y, Wang Q, Zhao J, et al. (2015) Variability of Gross Tumor Volume in Nasopharyngeal Carcinoma Using
11C-Choline and18F-FDG PET/CT. PLoS ONE 10(7):
e0131801. doi:10.1371/journal.pone.0131801
Editor:Ya Cao, Central South University, CHINA
Received:August 7, 2014
Accepted:June 5, 2015
Published:July 10, 2015
Copyright:© 2015 Jiang et al. This is an open access article distributed under the terms of the
Creative Commons Attribution License, which permits unrestricted use, distribution, and reproduction in any medium, provided the original author and source are credited.
Data Availability Statement:All data underlying this study has been uploaded to Figshare with the following DOI:http://dx.doi.org/10.6084/m9.figshare. 1392008. The uploaded files include the contents below: 1) A patient’s 11C-Choline PET/CT & 18F-FDG PET/CT image volumes and the ground truth of GTV base on each PET/CT fusion. 2) SPSS files of T-test, which recorded the process of our data. Description of uploaded files:For convenient data
uploading, we converted original DICOM images to . hdr and .img image volumes.1) CH_CT.hdr &
also been developed to deal with alignments of MR and CT images. In theory, visual and align-ment errors are inevitably presented when the two modalities are combined. PET/CT scan, which is recommended for NPC diagnosis, provides inherent alignment of anatomical (CT) and functional (PET) information. The PET/CT fused images are also used for GTV
delinea-tion and potentially decline inter-observer variability in manual delineadelinea-tion [2–4].
As a new modality for NPC diagnoses, PET is also used as a tool in target definition for patients with non-small-cell lung cancer, head and neck cancer, and rectal cancer during RT
planning [5]. Some guidelines have also been developed. Commonly used methods for tumor
outlining include qualitative visual method [6], GTV 2.5 standardized uptake value (SUV)
units [7], linear adaptive SUV threshold function method [8], and GTV 40% of local maximal
uptake value method [9]. These methods were all based on18F-FDG PET images, and none of
them directly aimed to delineate GTV for advanced NPC.
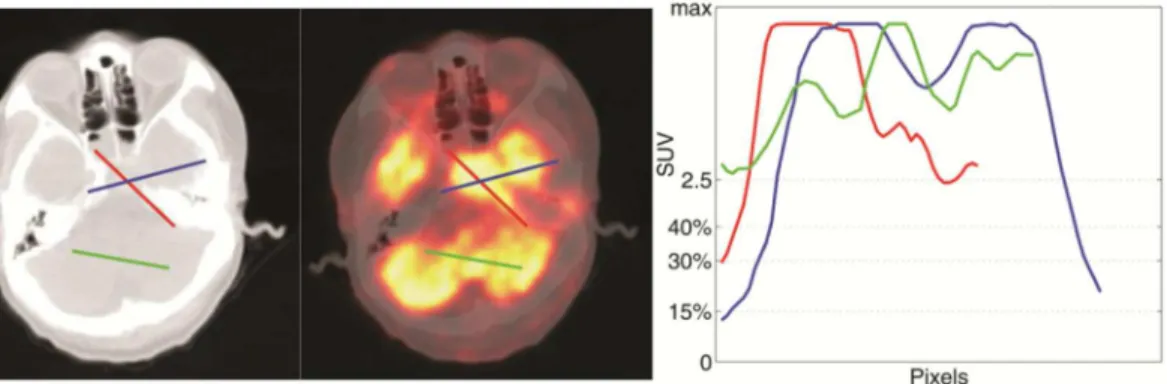
As we know, intracranial and skull base invasion are frequently observed in patients with locally advanced NPC. Since the SUV of brain tissues are comparable to tumors, threshold
method seems inadequate for target contouring using only18F-FDG PET images [Fig 1]. This
circumstanceis also accounted for the failure of manual contouring, because18F-FDG PET can
not provide sufficient distinction between lesions and normal tissues for advanced NPC.
Con-sidering that11C-Choline is commonly used as a tumor-imaging agent in brain tumor
diagno-sis [10], we conducted a visual evaluation of11C-Choline-PET and18F-FDG-PET for advanced
NPC diagnosis. The results suggested that11C-Choline PET/CT may be superior to18F-FDG
PET/CT in terms of determining GTV in patients with locally advanced NPC.
Only few studies have been proposed to evaluate the precision of GTV delineation
with11C-Choline PET for NPC. In the current study, GTV delineation results were
quantitatively evaluated using the two kinds of PET volumes with different segmentation methods.
Methods
Ethics Statement
This study was approved by the Ethics Committees of Nanfang Hospital. Patient records/infor-mation was anonymized and de-identified prior to analysis.
Image Acquisition
Examinations were performed using a Discovery LS PET/CT scanner (GE Healthcare) in the Department of PET Center, xx Hospital. A total of 15 patients voluntarily participated in our research from December 2007 to May 2009. The scanning conditions were detailed in our
pre-vious study [11]. Patients underwent FDG PET scan before Choline PET scan, and the longest
time interval between the two scans was 14 d. Each patient was instructed to undergo fasting for at least 6 h before tracer injection and to minimize any talking, chewing, swallowing, or head movement during image acquisition.
We collected 15 PET/CT scans. The entire study was processed using the original image vol-ume. Ten of the patients were newly diagnosed, and five exhibited recurrent locally advanced NPC. According to pathological examination results, 14 cases manifested non-keratinized undifferentiated carcinoma and 1 case exhibited well-differentiated squamous carcinoma. Intracranial and skull base invasion was diagnosed and confirmed by contrast-enhanced MRI or CT. Original MR and CT DICOM images were also collected as contouring standard GTV reference. Approximately 41.7% (5/12) of the subjects were transferred to different hospitals. To save their data, we contoured their standard GTVs by using fused PET/CT images.
base on the PET/CT fusion. 2) FDG_CT.hdr & FDG_CT.img and FDG_IntPT.hdr & FDG_IntPT.img are the PET/CT images using 18F-FDG as tracer. FDG_T.hdr & FDG_T.img are the ground truth of GTV base on the PET/CT fusion. 3) T-test.zip file is the SPSS file recording the process of our data. 3a) Doc. vs. Doc.sav & Doc. vs. Doc.spv are associated with
Table 2, indicating the intra-observer variability. 3b) Doc. vs. Ref.sav & Doc. vs. Ref.spv are associated withTable 2, indicating the inter-observer variability. 3c) FDG_Ref. vs. CH_Ref.sav & FDG_Ref. vs. CH_Ref.spv are associated withTable 2, indicating the inter-modality variability. 3d) AutoMethod_FDG vs. CH.sav & AutoMethod_FDG vs. CH.spv are associated withTable 3, indicating the inter-modality variability evaluated using auto-methods.
Funding:This work was supported by the grants from the National Basic Research Program of China (973 Program) (No. 2010CB732505), National Science & Technology Pillar Program of China (No. 2012BAI14B02), Ministry of Science special fund for major instrument (No. 2011YQ030114), National High-tech R&D Program of China (863 Program)(No. 2012AA02A616) and National Natural Science Funds of China (NSFC, No. 81101109). The authors would also like to thank Ye Dong and Shaobo Wang from the Department of PET Center, Nanfang Hospital for their great support of GTV evaluation.
However, 41.7% (5/12) subjects’image data were lost because of hospital transferring, and their standard GTVs were contoured by using fused PET/CT images.
Image Process
PET volumes (4 mm × 4 mm × 4.25 mm) were interpolated to the same resolution as CT vol-umes (0.98 mm × 0.98 mm ×2 mm), and the two modalities were aligned according to the physical position information stored in DICOM files. If the volume was misaligned using this method, a conspicuous head movement possibly occurred during data acquisition. Therefore, this volume was excluded from our data set. We selected 12 image volumes with good
align-ment and imaging quality in our study, and each case contained18F-FDG and11C-Choline
images. Patients’characteristics, time interval, and time sequence of the two PET/CT scans are
summarized inTable 1(Patient numbers in this study correspond to those listed inTable 1in
our previous study [11]).
Fig 1. SUV of tumor and surrounding tissuse.On the left side of the figure, two lines are drawn along axial (blue) and radial (red) directions of the lesions. The SUV under the two lines are sampled and shown on the right. SUV15%, SUV30%, SUV40%, SUV2.5baselines are shown along the Y axis. SUV of lesion and normal tissues reveals many overlapping regions.
doi:10.1371/journal.pone.0131801.g001
Table 1. Clinical data of patients with NPC.
Pt. No. Scanning Date* PET scan Interval(days) GTV Confirmation Reference GTV (cm3)
FDG CH Type Date* FDG CH
1 08–23 08–25 2 MRI (CE) 07–28 29.18 41.20
2 06–30 07–02 2 MRI (CE) 06–16 18.09 36.38
3 06–23 06–25 2 MRI (CE) 06–24 19.90 39.83
5 04–13 04–14 1 CT (CE) 03–15 45.41 57.11
6 04–02 04–03 1 - 03–02 69.51 104.03
7 04–02 04–03 1 - 03–18 22.15 42.28
8 03–06 03–09 3 MRI (CE) 03–04 41.86 58.44
9 01–05 01–06 3 MRI (CE) 12–08 72.58 99.98
10 08–22 08–25 3 - 07–25 43.87 49.96
11 07–20 07–20 0 - 07–18 36.04 63.20
12 08–15 08–29 14 - 06–18 22.59 35.69
14 08–25 08–27 2 MRI (CE) 07–14 54.15 65.70
Abbreviation: Pt. No. = Patient Number -: MRI or CT data missing
*: Scanning date are formated as month-date
Based on the information stored in the image header, body weight (bw) SUVs were
calcu-lated according to a previously described method [12]. However, we could not determine
whether or not the patients included were affected by primary or recurrent carcinoma, because tumor metastasis and growth of NPC are inherently unpredictable. Our GTV evaluation did not consider the isolated lumps in the neck; instead, we focused only on the primary tumor in the head to simplify the complicated circumstance.
Image Analysis
The standard reference of GTV was confirmed as ground truth for image analysis. Image anal-ysis was conducted using two categories of volumetric comparison: inter-observer variation (across oncologists within a modality) and inter-modality variation (between FDG and Choline PET/CT fusion for each oncologist and on average). The two categories were analysed with a mean significance test (category-dependent) or an overlap analysis. The significance threshold
was set atα= 0.05.“Near”significance or“tendency”was noted for 0.05<α<0.10.
Standard Reference of GTV
The contouring protocol was performed according to Hani [13]. For the first round, two
oncol-ogists with at least four years of clinical experience were invited to contour the GTV of the image volumes respectively. Available enhanced MR or CT was used as complementary images. While, for the second round, oncologists collaborated on contouring GTV. To establish the standard reference of GTV for each type of PET/CT fusion, we compared the scope and border of their contouring results, and recorded any discrepancy between the two GTVs. Oncologists reached a consensus of the standard reference of GTV by deliberating their
con-touring results [Table 1].
Inter-observer and Inter-modality Variations
Four oncologists, indexed as A, B, C, and D (with one, two, two, and three years of clinical experiences, respectively), were asked to manually contour the GTV of the 12 image volumes separately. The contouring was implemented frame by frame on both FDG and Choline PET/
CT fused images by using the distinct halo described by Hani [13]. To catch apparent border in
CT images, oncologists were allowed to turn the view window and transparency freely as they investigate in their respective workstations. All of their contouring results were saved for fur-ther analysis and evaluation.
We assessed the inter-observer variation in FDG and Choline PET/CT fusions with the GTV obtained by the four oncologists. Volume differences cannot comprehensively reveal the disparities between contouring results and ground truth, because tumors with same volume can differ in shape or disease sites. To compare the GTV overlap degrees, we introduced the dice similarity coefficient (DSC), which is a commonly used metric in the evaluation of image
segmentation [3,14].
For each result, the false positive (FP), false negative (FN), true positive (TP), and true nega-tive (TN) counts were calculated. These four metrics are defined as follows:
TP¼R\T;TN ¼R[T;FP¼R\T;FN¼R\T ð1Þ
whereTis the voxel set inside the ground truth;Ris the voxel set inside the contouring result.
From these values, DSC can then be computed:
DSC¼ 2TP
High DSC indicated a high voxel correlation between contouring result and ground truth and vice versa.
Inter-modality variation in the results obtained by each oncologist was also analysed by
using Student’s paired-samplet-test and a DSC pairwise comparison. Average inter-modality
variation was measured by calculating the average of the volumes obtained by the oncologists
for each modality and by comparing these results using Student’s paired-samplet-test.
Semi-automatic Evaluation
Manual contouring results are susceptible to subjective factors, such as view window. Some automatic and semi-automatic methods have been proven to be objective because these
meth-ods didn’t need human interaction and such methods were not very sensitive to human
initiali-zation. To minimize subjective errors, we investigated the performance of two commonly used semi-automatic, threshold-based, and region-growing (RG) methods, on contouring NPC
tumor in18F-FDG and11C-Choline PET images. SUV15%, SUV30%, SUV40%, and RG
contour-ing results were compared with ground truth results [15–17]. Inter-modality variations were
analysed again as previously conducted to the manual contouring results.
Results
Using the contouring protocol described by Hani [13], the four oncologists finished their GTV
delineation in one month. Contouring was based on fused PET/CT images because the MR images were incomplete. Oncologist A was instructed to re-contour GTV because of a misun-derstanding of the contouri ng protocol. Oncologist B was directed to modify the volumes to eliminate lymph node involvement, which was not included in the GTV for the purposes of the study.
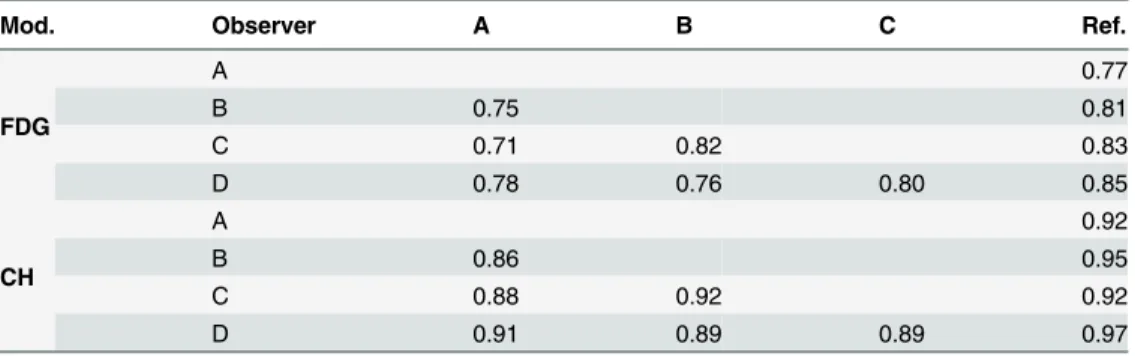
The GTV standard references (listed inTable 1) of11C-Choline volumes were significantly
larger than their FDG volumes (p<0.0001, mean ± SD = 18.21 ± 8.19). The mean results of
the inter-observer and inter-modality DSC comparison using the manual contouring method
are listed inTable 2. Significantly consistent results were detected between oncologists and the
standard references in the Choline and FDG volumes (p = 0.0025). Hence, conspicuous improvement of decreasing inter-observer variation was reflected. Significant consistency also occurred between the pairs of oncologists in the two types of PET volumes (p = 0.0001). No sig-nificant difference was observed between the results of pairs of oncologists in the same type of PET volumes.
Table 2. Results of inter-observer and inter-modality DSC analysis for average PET/CT fusion volumes.
Mod. Observer A B C Ref.
FDG
A 0.77
B 0.75 0.81
C 0.71 0.82 0.83
D 0.78 0.76 0.80 0.85
CH
A 0.92
B 0.86 0.95
C 0.88 0.92 0.92
D 0.91 0.89 0.89 0.97
Abbreviation: Mod. = Modality; Ref. = Standard GTV reference.
The mean results of the inter-modality DSC comparison with semi-automatic methods
were listed inTable 3. Semi-automatic methods tend to provide better result in11C-Choline
volumes than in FDG volumes (p = 0.076, CI = [–0.29, 0.025]).
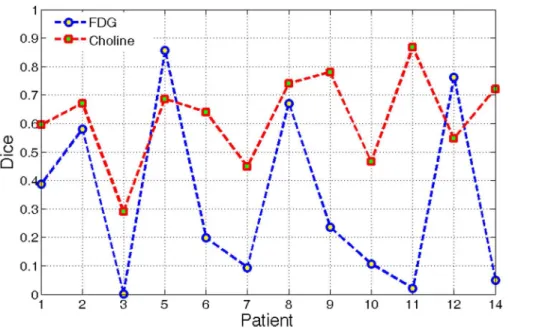
The RG method obtained a higher mean score but lower standard deviation of DSC than the threshold method. RG method produced a more stable outcome; hence, the performances of this method using the two modalities were compared. DSCs of 12 patients were illustrated
graphically in a polygon diagram [Fig 2].
The segmentation results of11C-Choline PET exhibited a relatively higher average score
than that of18F-FDG PET, although two exceptions were presented. A significant difference
was observed between the two types of PET volumes (p<0.001). This phenomenon objectively
revealed that11C-Choline PET images provided a better distinction of NPC than18F-FDG
images.
Discussion
In our previous study, qualitative visual assessment results suggested that the use of combined
11C-Choline PET/CT images could help prevent the risk of lesions that were not evidently
found during diagnosis [11]. In the current study, a systematic evaluation on inter-observer
Table 3. Results of inter-modality DSC analysis of semi-automatic methods.
Method FDG vs. Ref. CH vs. Ref.
SUV15% 0.28 0.38
SUV30% 0.35 0.42
SUV40% 0.36 0.44
RG 0.34 0.62
Abbreviation: Ref. = Standard GTV reference.
doi:10.1371/journal.pone.0131801.t003
Fig 2. DSC of RG results using FDG and Choline PET/CT fusion.
and inter-modality variations of GTV contouring with the use of11C-Choline and18F-FDG NPC PET images for radiotherapy was presented.
The aforementioned studies have frequently demonstrated the reduction of the
inter-observer variability when18FDG-PET is incorporated in GTV delineation of non-small cell
lung cancer [18]. Although the result is less consistent, this variation is also observed in patients
with head and neck cancer [19]. In our investigation, inter-observer variation in the11
C-Cho-line group was lower than that in the18F-FDG group. Oncologists obtain a consistent GTV
when contouring11C-Choline PET/CT images mainly because11C-Choline PET images
decrease the uncertainty of skull base or brain invasion of NPC, as observed in our previous assessment.
Significant difference in inter-modality variations was observed between the18F-FDG group
and the11C-Choline group. Oncologists likely contoured a larger region when they used
11C-Choline PET/CT fusions, and this result was observed mainly because of two factors. The
objective reason is that the use of18F-FDG PET for GTV definition usually underestimates
tumor invasion [20]. Similar underestimation was also found in our assessment [Fig 3]. The
subjective reason is that oncologists are conservative to the uncertainty of tumor invasion
when18FDG-PET images are used in diagnosis, particularly at sites where skull base or brain
invasion occurs because tumors in these sites exhibit comparable SUV with the surrounding tissues. Hence, semi-automatic contouring method was introduced in our assessment. In this way, the influence of random factors can be effectively minimized and subjective mistakes can be avoided.
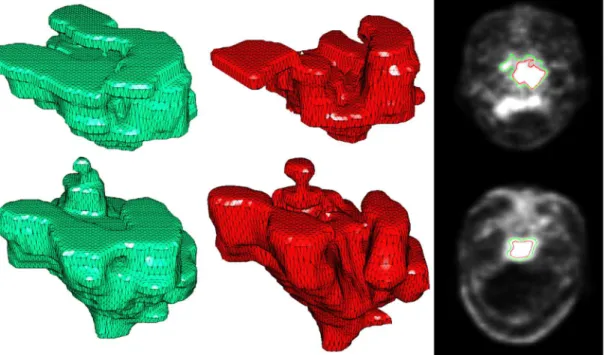
The shape of the ground truth and RG result of11C-Choline PET were more similar to each
other than that of18F-FDG PET. The semi-automatic contouring method possibly
underesti-mated the lesion when18F-FDG PET was used, but semi-automatic contouring was prone to
leak out at local areas adjacent to the encephalocoele. Computer-aided contouring methods reported in our investigation can be hardly admitted because the accuracy of the results was
Fig 3. Solid rendering of manually contoured reference (green) and RG result (red).The first row shows the result of18F-FDG; the second row shows the result of11C-Choline. The DSCs of the two modalities were 67.06% and 74.11%, respectively. (11C-Choline scans were obtained 3 d after18F-FDG).
relatively low. These methods did not exhibit relevant results mainly because uptake values of lesions were overlapped with nearby normal tissues, low spatial resolution of PET images, and absence of anatomical information. With limited human interaction, the algorithm can hardly obtain accurate results in the whole image volume and is usually entrapped in over-segmenta-tion (leakage) or under-segmentaover-segmenta-tion (shrinkage). However, the segmentaover-segmenta-tion results in some
slices were comparable to that of manual contouring, particularly in some11C-Choline slices
presenting apparent skull invasion. This superiority provides treatment planners with a clini-cally viable starting point for tumor delineation and minimizes the inter-observer variability in radiotherapy planning.
The manual contouring result confirmed that the inter-observer variations were lower in
the11C-choline group. The semi-automatic contouring method being used also revealed that
11C-Choline PET images are beneficial to the lesion targeting. However, whether or not
11C-Choline PET images can be used to define GTV in radiotherapy planning remains unclear,
because data of the treatment outcome obtained from this approach are insufficient. Moreover, the present study focused on GTV rather than on planned target volume (PTV). PTV is the volume at which a prescribed dosage is actually delivered, whereas GTV is the volume of gross disease. Hence, a study of PTV reproducibility under the same circumstances should be performed.
Clinical trials should first address the safety of this approach, and assessment of possible improvement of outcomes should be conducted. IEC (International Electro Technical Com-mission) phantoms, covering a range of spherical lesion sizes, contrast ratios, noise levels and voxel sizes, should be used to figure out the mechanism of significant difference in inter-modal-ity variations. In addition, the guidelines for GTV contouring using different PET images should be assessed on realistic non-uniform and non-spherical volumes simulated from patient lesions.
Conclusions
11C-Choline PET/CT images could be introduced as an important complementary tool to
decrease inter-observer variation in GTVs obtained for NPC.11C-Choline PET/CT images
pro-vided larger GTV volumes than FDG images. Phantom simulations and clinical trials should be conducted to prove the possible improvement of the treatment outcome.
Acknowledgments
This work was supported by the grants from the National Basic Research Program of China (973 Program) (No.2010CB732505), National Science & Technology Pillar Program of China (No.2012BAI14B02), Ministry of Science special fund for major instrument (No.2011YQ030114), National High-tech R&D Program of China (863 Program) (NO. 2012AA02A616) and National Natural Science Funds of China (NSFC, No. 81101109). We would also like to thank Ye Dong and Shaobo Wang from the Department of PET Center, Nanfang Hospital for their great support of GTV evaluation.
Author Contributions
References
1. Ashamalla H, Guirgius A, Bieniek E, Rafla S, Evola A, Goswami G, et al. The impact of positron emis-sion tomography/computed tomography in edge delineation of gross tumor volume for head and neck cancers. International Journal of Radiation Oncology*Biology*Physics 2007; 68:388–395.
2. Bagci U, Udupa J, Yao J, Mollura D. Co-segmentation of functional and anatomical images. Medical Image Computing and Computer-Assisted Intervention–MICCAI 2012 2012:459–467.
3. Bassi MC, Turri L, Sacchetti G, Loi G, Cannillo B, Mattina PL, et al. FDG-PET/CT imaging for staging and target volume delineation in preoperative conformal radiotherapy of rectal cancer. International Journal of Radiation Oncology*Biology*Physics 2008; 70:1423–1426.
4. Black QC, Grills IS, Kestin LL, Wong CY, Wong JW, Martinez AA, et al. Defining a radiotherapy target with positron emission tomography. International Journal of Radiation Oncology*Biology*Physics 2004; 60:1272–1282.
5. Chanapai W, Bhongmakapat T, Tuntiyatorn L, Ritthipravat P. Nasopharyngeal carcinoma segmenta-tion using a region growing technique. Internasegmenta-tional journal of computer assisted radiology and surgery 2012; 7:413–422. doi:10.1007/s11548-011-0629-6PMID:21671094
6. Day E, Betler J, Parda D, Reitz B, Kirichenoko A, Mohammadi S et al. A region growing method for tumor volume segmentation on pet images for rectal and anal cancer patients. Medical physics 2009; 36:4349. PMID:19928065
7. Devic S, Tomic N, Faria S, Menard S, Lisbona R, Lehnert R. Defining radiotherapy target volumes using18F-fluoro-deoxy-glucose positron emission tomography/computed tomography: Still a pandora's box? International Journal of Radiation Oncology*Biology*Physics 2010; 78:1555–1562.
8. Erdi YE, Mawlawi O, Larson SM, Lmbriaco M, Yeung H, Finn R, et al. Segmentation of lung lesion vol-ume by adaptive positron emission tomography image thresholding. Cancer 1997; 80:2505–2509. PMID:9406703
9. Houweling AC, Wolf AL, Vogel WV, Hamming-Vrieze O, Vliet-Vroegindeweij CV, Kamer JV, et al. FDG-PET and diffusion-weighted mri in head-and-neck cancer patients: Implications for dose painting. Radiotherapy and Oncology 2013.
10. Kato T, Shinoda J, Nakayama N, Miwa K, Okumura A, Yano H, et al. Metabolic assessment of gliomas using11C-methionine,18F-fluorodeoxyglucose, and11C-choline positron-emission tomography. Ameri-can Journal of Neuroradiology 2008; 29:1176–1182. doi:10.3174/ajnr.A1008PMID:18388218
11. King AD, Ma B, Yau Y, Zee B, Leung S, Wong J, et al. The impact of18F-FDG PET/CT on assessment of nasopharyngeal carcinoma at diagnosis. British Journal of Radiology 2008; 81:291–298. doi:10. 1259/bjr/73751469PMID:18344274
12. Li H, Thorstad WL, Biehl KJ, Laforest R, Su Y, Shoghi K, et al. A novel pet tumor delineation method based on adaptive region-growing and dual-front active contours. Medical physics 2008; 35:3711. PMID:18777930
13. Masa-Ah P, Tuntawiroon M, Soongsathitanon S. A novel scheme for standardized uptake value (SUV) calculation in pet scans. International Journal Of Mathematical Models And Methods In Applied Sci-ences, NAUN 2010; 4:291–299.
14. Nestle U, Walter K, Schmidt S, Licht N, Nieder C, Motaref B, et al. 18F-deoxyglucose positron emission tomography (FDG-PET) for the planning of radiotherapy in lung cancer: High impact in patients with atelectasis. International Journal of Radiation Oncology*Biology*Physics 1999; 44:593–597.
15. Potesil V, Huang X, Zhou XS. Automated tumor delineation using joint PET/CT information. Proc. SPIE International Symposium on Medical Imaging: Computer-Aided Diagnosis. 2007;6514:
16. Riegel AC, Berson AM, Destian S, Ng T, Tena LB, Mitnick RJ, et al. Variability of gross tumor volume delineation in head-and-neck cancer using ct and PET/CT fusion. International Journal of Radiation Oncology*Biology*Physics 2006; 65:726–732.
17. Troost EGC, Schinagl DAX, Bussink J, Oyen WJ, Kaanders JH. Clinical evidence on PET–CT for radia-tion therapy planning in head and neck tumours. Radiotherapy and Oncology 2010; 96:328–334. doi: 10.1016/j.radonc.2010.07.017PMID:20708808
18. Wu HB, Wang QS, Wang MF, Zhen X, Zhou WL, Li HS. Preliminary study of 11c-choline PET/CT for t staging of locally advanced nasopharyngeal carcinoma: Comparison with18F-FDG PET/CT. Journal of nuclear medicine: official publication, Society of Nuclear Medicine 2011; 52:341–346.
19. Xia Y, Eberl S, Wen L, Fulham M, Feng DD. Dual-modality brain pet-ct image segmentation based on adaptive use of functional and anatomical information. Computerized Medical Imaging and Graphics 2012; 36:47–53. doi:10.1016/j.compmedimag.2011.06.004PMID:21719257