Individualized threshold for tumor segmentation in
18F-FDG
PET/CT imaging: The key for response evaluation of neoadjuvant
chemoradiation therapy in patients with rectal cancer?
THEARA C. FAGUNDES1, ARNOLDO MAFRA2, RODRIGO G. SILVA3, ANA C. G. CASTRO1, LUCIANA C. SILVA4, PRISCILLA T. AGUIAR5,
JOSIANE A. SILVA5, EDUARDO P. JUNIOR6, ALEXEI M. MACHADO4, MARCELO MAMEDE4*
1Oncology Section, University Hospital, Universidade Federal de Minas Gerais (UFMG), Belo Horizonte, MG, Brazil 2Radiation Therapy Section, Instituto Mario Penna, Belo Horizonte, MG, Brazil
3Department of Surgery, Faculdade de Medicina da UFMG, Belo Horizonte, MG, Brazil 4Department of Anatomy and Imaging, Faculdade de Medicina da UFMG, Belo Horizonte, MG, Brazil 5Molecular Imaging Center, Faculdade de Medicina da UFMG, Belo Horizonte, MG, Brazil 6Department of Pathologic Anatomy, Faculdade de Medicina da UFMG, Belo Horizonte, MG, Brazil
S
UMMARYStudy conducted at Faculdade
de Medicina da Universidade Federal de Minas Gerais (UFMG),
Belo Horizonte, MG, Brazil
Article received: 6/24/2017
Accepted for publication: 7/17/2017
*Correspondence:
Departamento de Anatomia e Imagem Faculdade de Medicina, UFMG
Address: Av. Prof. Alfredo Balena, 190, sala 175
Belo Horizonte, MG – Brasil Postal code: 30130-100
http://dx.doi.org/10.1590/1806-9282.64.02.119
Introduction: The standard treatment for locally advanced rectal cancer (RC) consists of neoadjuvant chemoradiation followed by radical surgery. Regardless the extensive use of SUVmax in 18F-FDG PET tumor uptake as representation of
tumor glycolytic consumption, there is a trend to apply metabolic volume instead. Thus, the aim of the present study was to evaluate a noninvasive method for tumor segmentation using the 18F-FDG PET imaging in order to predict response
to neoadjuvant chemoradiation therapy in patients with rectal cancer.
Method: The sample consisted of stage II and III rectal cancer patients undergoing
18F-FDG PET/CT examination before and eight weeks after neoadjuvant therapy.
An individualized tumor segmentation methodology was applied to generate tumor volumes (SUV2SD) and compare with standard SUVmax and fixed threshold
(SUV40%, SUV50% and SUV60%) pre- and post-therapy. Therapeutic response was
assessed in the resected specimens using Dworak’s protocol recommendations. Several variables were generated and compared with the histopathological results.
Results: Seventeen (17) patients were included and analyzed. Significant differences were observed between responders (Dworak 3 and 4) and non-responders for SUVmax-2 (p<0.01), SUV2SD-2 (p<0.05), SUV40%-2 (p<0.05), SUV50%-2 (p<0.05) and
SUV60%-2 (p<0.05). ROC analyses showed significant areas under the curve (p<0.01)
for the proposed methodology with sensitivity and specificity varying from 60% to 83% and 73% to 82%, respectively.
Conclusion: The present study confirmed the predictive power of the variables using a noninvasive individualized methodology for tumor segmentation based on 18F-FDG PET/CT imaging for response evaluation in patients with rectal
cancer after neoadjuvant chemoradiation therapy.
Keywords: Rectal Neoplasms. Neoadjuvant Therapy. Fluorodeoxyglucose F18. Positron-Emission Tomography.
I
NTRODUCTIONColorectal cancer corresponds to the third more incident (9.7%) and the fourth deadlier (8.5%) cancer of all cancers in the world.1 In Brazil, it is the third more incident
can-cer.2 Clinical T3/T4 or node-positive rectal cancer
(lo-cally advanced rectal cancer) patients are usually assigned to preoperative or postoperative chemoradiotherapy.
Previous published studies have shown that preoperative chemoradiotherapy significantly improves disease-free survival and local control compared with postoperative chemoradiotherapy.3,4
response to therapy is usually done with the analysis of the surgical specimens, known as the gold standard. Tumor regression grade is mostly associated with prognosis and is of great interest due to survival.5 Complete and partial
regression have improved long-term outcome in patients with rectal carcinoma after preoperative chemoradiation.3-6
The ability to predict responders to preoperative chemo-radiation in RC using conventional imaging methods (CT, US, MRI) alone or in combination is a difficult task, with non-reliable data.7,8 Accurate restaging before operation is
important to determine the best surgical strategy. Surgical extension and aggressiveness, and sphincter preservation should be considered in light of the response to neoadjuvant treatment, ideally through a noninvasive test.9
Fluorine-18-labeled fluorodeoxyglucose-positron emis-sion tomography studies (18F-FDG) have been used to
evaluate response to therapy in different cancer types.10-13
In rectal cancer, previously published data have shown promising use of 18F-FDG PET/CT as an important tool
to discriminate responders from non-responders.7-9,14-19 18F-FDG PET/CT is a test capable of providing metabolic
information of viable cancer cells based on radiotracer retention in the compartment of interest, mediated by an enzyme-substrate reaction. However, there is no consensus on how the quantitative analysis should be used to predict response to therapy using 18F-FDG PET/CT.
18F-FDG-PET images have some limitations regarding
the provision of accurate information on external and internal contours of the tumor because of the limited spatial resolution associated with this imaging modality. Despite the extensive use of the most intense 18F-FDG
tumor uptake value (known as SUVmax) to represent tumor
glycolytic consumption using PET images, there is a trend to apply metabolic volume instead.
Due to the inherited heterogeneous behavior of cancer cells, expressing the glucose metabolism of the entire tumor in a single voxel might not be the best manner. Tu-mor metabolism using volume based on PET images seems a more precise representation than SUVmax. Thus, several
approaches have been used for tumor segmentation with
18F- FDG-PET images20-26 for the evaluation of the
meta-bolic pattern of the entire tumor. However, these results are still undergoing evaluation due to large variability de-pending on the choice of the threshold employed, and none of them were used as a non-subjective way to generate PET tumor volumes.20-26
Thus, the aim of our study was to evaluate a nonin-vasive and non-subjective method for tumor segmentation using 18F-FDG PET/CT imaging to predict response to
therapy in patients with rectal cancer that underwent
neoadjuvant chemoradiation therapy. To date and to our knowledge, this is the first study to use this methodology to evaluate response to therapy in rectal cancer patients.
M
ETHODThe study retrospectively evaluated 17 patients with histopathological confirmation of adenocarcinoma of rectum whom underwent 18F-FDG PET/CT before and
eight weeks after neoadjuvant chemoradiation at our institution. Staging was done according to the TNM system27 presented in the 7th edition of the American
Joint Committee on Cancer (AJCC) and included colo-noscopy, high-resolution magnetic resonance imaging (MRI) and abdominal and chest computerized tomog-raphy (CT) scans. Patients with baseline metastatic dis-ease were excluded. All patients underwent standard neoadjuvant long-course chemoradiation as previously described.4 Briefly, the regimen consisted of 50.4 Gy
de-livered on weekdays to the pelvis and a 9 Gy boost to the primary tumor. Concomitantly, chemotherapy (5-fluo-rouracil and leucovorin) was delivered on the 1st and 5th
week of radiation therapy. Surgical resection of the rec-tum was performed after the second PET scan for all patients. The study was approved by the human research ethics committee, and all of the study’s participants signed an informed consent form aware that their pri-vacy rights would be observed.
18F-FDG PET/CT scans were performed according
to our research protocol for oncological patients using a Discovery 690 PET/CT scanner (GE, Milwaukee, WI, USA). Patients fasted for at least six hours before the intravenous administration of 3.7 MBq/kg (mean 251.6 ± 62.9 MBq and 244.2 ± 66.6 MBq, before and after ther-apy, respectively) body weight of 18F-FDG. Blood glucose
levels was checked before tracer administration (mean 95.2 ± 9.1 mg/dL and 95.8 ± 9.3 mg/dL, before and after therapy, respectively) and patients with glucose levels higher than 190 mg/dL were excluded from the study. CT scans were performed from the top of the head to mid thigh approximately 60 minutes (mean 95.8 ± 9.3 minutes and 91.1 ± 11.4 minutes, before and after therapy, respec-tively) after intravenous injection of 18F-FDG using a
low-dose protocol (120 kV, smart mA) for attenuation map without diagnostic purpose and without oral or intrave-nous contrast media. Then, PET images were acquired with 2 minutes per bed position for the same region. All PET images were reconstructed using OSEM-like recon-struction algorithm with 2 interations and 24 subsets.
The 18F-FDG PET/CT images were evaluated
blinded to all imaging studies and clinical and patho-logical results. In case of discrepancy, the interpretation was made by consensus between the investigators. All lesions were analyzed semiquantitatively based on the maximum standardized uptake value (SUVmax) in the
transaxial plane method normalized by lean body mass and were considered pre- and post-therapy (SUVmax1 and
SUVmax2, respectively).
In order to evaluate volumetric tumor glucose con-sumption, an algorithm for tumor segmentation using PET images was applied, which was initially validated in esophageal cancer patients.28,29 This methodology uses
the 18F-FDG uptake in the liver as a control to
individual-ize threshold for tumor segmentation. Briefly, a region-of-interest comprising the entire organ on a transaxial slice was drawn in the liver and mean and standard de-viation of the uptake value of 18F-FDG (L
mean and LSD,
respectively) were calculated. Meanwhile, the highest tu-mor uptake value in a voxel (Tmax) was also calculated.
Then, to individualize the threshold for tumor segmenta-tion, a lower SUV value (T2SD) was generated as a result
of the following formula: T2SD = Tmax – (Lmean + 2xLSD).28
Figure 1 shows the segmentation methods applied. Using a region-growing methodology, volumes of interest from a seed point (voxel with highest uptake of
18F-FDG in the tumor: T
max) with an specific threshold
(T2SD) recognizes all surrounding areas to capture up
voxels with the difference of initial value based on the segmentation algorithm. For that, a dedicated worksta-tion was used (Advantage Windows Workstaworksta-tion, GE, Milwaukee, WI, USA).
After generating the target lesion volume (Vol2SD), the
program calculates the average SUV volume (SUV2SD), and
the product of Vol2SD with SUV2SD determines the total
lesion glycolysis (TLG2SD). Fixed thresholds (40%, 50% and
60%) were also applied to generate PET-volumes (Vol40%,
Vol50% and Vol60%, respectively), averaged SUVs (SUV40%,
SUV50% and SUV60%, respectively) and the total lesion
gly-colysis (TLG40%, TLG50%, and TLG60%, respectively). All
variables were calculated for each patient before and after neoadjuvant therapy. In addition, percentage of differ-ences between pre- and post-therapy analyses was also calculated for each parameter as follows: %∆SUV=[(SUV1
-SUV2)/SUV1]x100, %∆Vol=[(Vol1-Vol2)/Vol1]x100% and
%∆TLG=[(TLG1-TLG2)/TLG1] x100.
Response was assessed using the protocol recommen-dations by Dworak et al.30 Resected specimens were analyzed
by the same pathologist with particular expertise in gas-trointestinal diseases. Tumor response to neoadjuvant therapy was scored using the semiquantitative evaluation
of histological regression according to the tumor regression grade (TRG) scale:30 TRG 0, no response; TRG 1, residual
cancer cells outgrowing fibrosis; TRG 2, fibrosis outgrow-ing residual cancer cells; TRG 3, presence of residual cancer cells; TRG 4, complete histopathological response, i.e. no viable cancer cells in the resected specimen. Applying this rating method, tumors were classified as either non-re-sponders (TRG 0-2) or renon-re-sponders (TRG 3 or 4).
Statistical analysis was performed using MedCalc ver-sion 14.8.1 (MedCalc Software, Ostend, Belgium). Nu-merical variables were analyzed by Mann-Whitney test, and correlation test was applied to generate Pearson’s coefficient. Differences were considered statistically significant for p<0.05. ROC analysis was performed to determine the metabolic parameters in predicting response to treatment.
R
ESULTSFrom March 2012 to November 2013, 17 patients were eligible and underwent 18F-FDG PET/CT examination to
assess therapeutic response after neoadjuvant chemora-diation. All tumors were adenocarcinoma of rectum. Eight men and nine women were included in the study. Patient age varied between 26 to 73 years with mean of 49.5 years. There were seven (41.2%) patients with rectal cancer stage II and ten (57.8%) patients with stage III. In terms of response to therapy, there were 11 (64.7%) non-responders (Dworak 0-2) and six (35.3%) responders (Dworak 3 and 4).
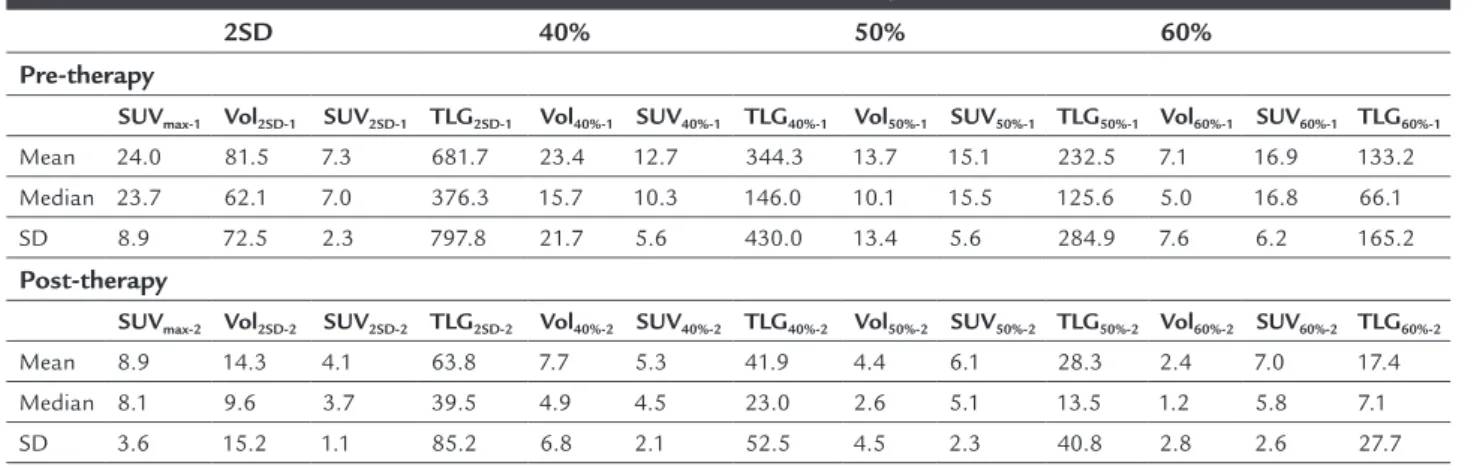
Table 1 shows various quantitative metabolic measure-ments using 18F-FDG PET/CT images pre- and
post-neo-adjuvant therapy using different methodologies. All vari-ables revealed significant reduction after chemoradiation therapy (p<0.01 for all). Table 2 shows the percentage changes among the variables evaluated in the present study. Among all variables calculated using 18F-FDG PET/CT
images (Table 1), there were significant differences between responders (Dworak 3 or 4) vs. non- responders (Dworak 0-2) for SUVmax-2 (5.8 ± 2.4 vs. 10.5 ± 3.0, p<0.01), SUV2SD-2
(3.3 ± 0.4 vs. 4.5 ± 1.2, p<0.05), SUV40%-2 (3.5 ± 0.9 vs. 6.2
± 1.9, p<0.05), SUV50%-2 (4.1 ± 1.0 vs. 7.1 ± 2.1, p<0.05) and
SUV60%-2 (4.7 ± 1.1 vs. 8.1 ± 2.4, p<0.05). However, there
was no significant difference between responders and non-responders for all of percentage change variables presented in Table 2.
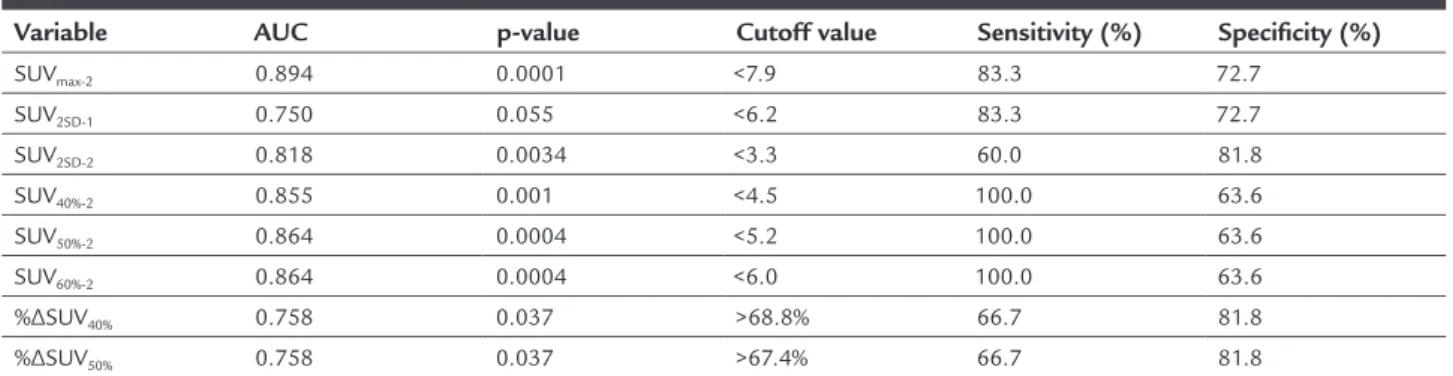
In order to determine the best cutoff values to differ-entiate responders from non-responders, ROC analyses were performed for all variables. Table 3 summarizes the variables with significant areas under the curve (p<0.05, except for the SUV2SD-1). However, the variable SUV2SD-1 did
TABLE 1 Metabolic measurements of 18F-FDG PET/CT pre- and post-neoadjuvant therapy.
2SD 40% 50% 60%
Pre-therapy
SUVmax-1 Vol2SD-1 SUV2SD-1 TLG2SD-1 Vol40%-1 SUV40%-1 TLG40%-1 Vol50%-1 SUV50%-1 TLG50%-1 Vol60%-1 SUV60%-1 TLG60%-1
Mean 24.0 81.5 7.3 681.7 23.4 12.7 344.3 13.7 15.1 232.5 7.1 16.9 133.2
Median 23.7 62.1 7.0 376.3 15.7 10.3 146.0 10.1 15.5 125.6 5.0 16.8 66.1 SD 8.9 72.5 2.3 797.8 21.7 5.6 430.0 13.4 5.6 284.9 7.6 6.2 165.2
Post-therapy
SUVmax-2 Vol2SD-2 SUV2SD-2 TLG2SD-2 Vol40%-2 SUV40%-2 TLG40%-2 Vol50%-2 SUV50%-2 TLG50%-2 Vol60%-2 SUV60%-2 TLG60%-2
Mean 8.9 14.3 4.1 63.8 7.7 5.3 41.9 4.4 6.1 28.3 2.4 7.0 17.4 Median 8.1 9.6 3.7 39.5 4.9 4.5 23.0 2.6 5.1 13.5 1.2 5.8 7.1
SD 3.6 15.2 1.1 85.2 6.8 2.1 52.5 4.5 2.3 40.8 2.8 2.6 27.7 SUV: standardized uptake value; 2SD: individualized algorithm for tumor segmentation; 40%, 50% and 60%: fixed thresholds for tumor segmentation; Vol: tumor volume; TLG: total lesion glycoly-sis.
TABLE 2 Percentage change for metabolic measurements of 18F-FDG PET/CT prior surgical resection.
Patient %ΔSUVmax 2SD 40% 50% 60%
%ΔVOl2SD %ΔSUV2SD %ΔTLG2SD %ΔVol40% %ΔSUV40%%ΔTLG40%%ΔVol50%%ΔSUV50% %ΔTLG50%%ΔVol60%%ΔSUV60%%ΔTLG60%
Mean 61.3 78.0 44.4 85.6 52.6 44.6 72.1 55.7 60.6 79.2 54.3 59.7 77.8
Median 63.3 82.9 40.3 93.3 59.6 60.7 88.5 72.1 56.8 91.7 70.2 56.8 90.7
SD 14.5 19.9 22.7 14.5 43.7 75.3 35.9 41.6 17.7 22.8 47.6 17.7 26.5
SUV: standardized uptake value; 2SD: individualized algorithm for tumor segmentation; 40%, 50% and 60%: fixed thresholds for tumor segmentation; %ΔSUVmax: percentage change in SUVmax; %ΔVol: percentage change in tumor volume; %ΔTLG: percentage change in total lesion glycolysis.
FIGURE 1 18F-FDG PET/CT tumor image segmentation methods. A. Region of interest (ROI) placed on a transaxial slice in liver. B. Tumor
segmentation generated using 2SD individualized algorithm. C. Tumor segmentation generated using 40% threshold. D. Tumor segmentation generated using 50% threshold. E. Tumor segmentation generated using 60% threshold.
A B C
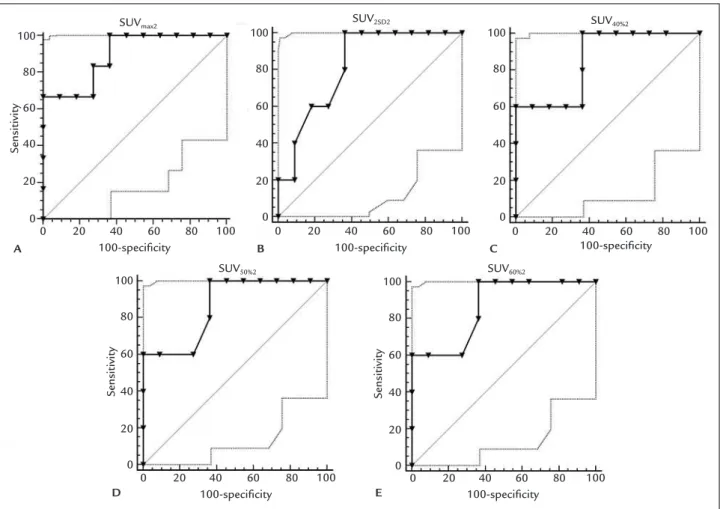
differentiate responders from non-responders with 60% and 82% of sensitivity and specificity, respectively. The proposed methodology showed lower sensitivity but high-er specificity to discriminate respondhigh-ers from non-respond-ers compared to fixed thresholds (Table 3). Figure 2 shows the significant ROC analyses for the thresholds applied. Figure 3 shows a typical example of 18F-FDG PET/CT
imag-ing tumor segmentation usimag-ing 2SD individualized algorithm.
D
ISCUSSIONThere is an undeniable interest in assessing response to neoadjuvant chemoradiation in rectal cancer noninvasive-ly with 18F-FDG PET/CT. Tumor metabolic changes using
volumetric analyses with PET images seem to be a more precise representation than SUVmax. However, there is no
consensus about the threshold used for tumor segmenta-tion in this matter. As far as we know, our study is the first in which the proposed methodology of using individualized threshold to segment tumor using 18F-FDG PET/CT
im-ages in rectal cancer patients is addressed. This methodol-ogy has been applied in esophageal cancer patients29 with
promising results to predict response to neoadjuvant therapy and patient outcome. By using this methodology, SUV2SD-1 enabled the discrimination of responders from
non-responders with reasonable sensitivity and specificity (83.3% and 72.7%, respectively), while the SUV2SD-2 showed
approximate values (60.0% and 81.8%, respectively). SUV2SD-1
takes into account tumor heterogeneity and, therefore, could be used to predict patients with better outcome before the beginning of neoadjuvant therapy.
Accurate therapeutic response evaluation is crucial because it can guide optimization of the surgical approach (i.e. sphincter-sparing surgery in low rectal tumors), or less aggressive treatment in minimally-advanced tumors. Con-ventional imaging modalities cannot differentiate fibrosis from viable tumor cells in residual masses after neoadju-vant chemoradiation therapy, therefore being of limited
impact on the prediction of pathological response.7,8 On
the other hand, 18F-FDG PET/CT has been proven to be
able to predict therapeutical response accurately.
Tumor response varies considerably and, in addition, not all patients benefit equally from treatment. Thus, assessment of potential predictors of histological response using 18F-FDG PET/CT in patients undergoing
preop-erative treatment could help develop tailored therapy strategies. Our study showed that among the 35.3% of responders (Dworak 3 and 4), some analyzed variables were able to discriminate them from non-responders (SUVmax-2, SUV2SD-2, SUV40%-2, SUV50%-2 and SUV60%-2) and
the effectiveness of neoadjuvant therapy was in accordance with a previous study.31
Guerra et al.32 showed that SUV
max after therapy was
the best predictor of pathologic complete response (pCR). The values found were 3.6 ± 1.4 for responders and 6.6 ± 2.1 (p=0.0009) for non-responders.32 Our study showed
similar results for SUVmax-2 with slightly higher values (5.3
± 2.2 and 10.4 ± 2.9, respectively) compared to the findings of Guerra et al.32 These differences could be related to the
methodologies applied: 1. SUV correction for the patients’ body weight rather than lean body mass, and 2. scan time after chemoradiation, twelve weeks instead of eight weeks applied in our study, respectively.
A study by Kim et al.33 conducted univariate and
mul-tivariate analyses and found post-chemoradiation SUVmax
as an independent predictor of complete pathological re-sponse (pCR). The predictive values of SUVmax
post-chemo-radiation proved to be a value for pCR with a sensitivity of 73.7%, specificity of 63.7% and accuracy of 64.9% for a cut-off value of 3.55. In our study, the cutcut-off value for SUVmax-2
of 7.9 showed sensitivity of 83.3% and specificity of 72.7% to discriminate responders (Dworak 3 and 4) from non-responders (Dworak 0-2), a slightly different approach due to the same sample evaluated. Thus, both studies found that the predictive values of post- chemoradiation SUVmax-2
TABLE 3 ROC analyses results (only significant values are shown).
Variable AUC p-value Cutoff value Sensitivity (%) Specificity (%)
SUVmax-2 0.894 0.0001 <7.9 83.3 72.7
SUV2SD-1 0.750 0.055 <6.2 83.3 72.7
SUV2SD-2 0.818 0.0034 <3.3 60.0 81.8
SUV40%-2 0.855 0.001 <4.5 100.0 63.6
SUV50%-2 0.864 0.0004 <5.2 100.0 63.6
SUV60%-2 0.864 0.0004 <6.0 100.0 63.6
%ΔSUV40% 0.758 0.037 >68.8% 66.7 81.8
%ΔSUV50% 0.758 0.037 >67.4% 66.7 81.8
FIGURE 3 Typical example of 18F-FDG PET/CT image tumor segmentation using 2SD individualized algorithm. A. Tumor segmentation
pre-therapy in non-responder. B. Tumor segmentation post-therapy in non-responder. C. Tumor segmentation pre-therapy in responder. D. Tumor segmentation post-therapy in responder.
A B
C D
FIGURE 2 ROC analyses.
SUVmax2 SUV2SD2 SUV40%2
SUV60%2 SUV50%2
100-specificity 100
80
60
40
20
0
100
80
60
40
20
0
100
80
60
40
20
0
100
80
60
40
20
0
100
80
60
40
20
0
100-specificity 100-specificity
100-specificity
0 0 0
0 0
20 20 20
20 20
40 40 40
40 40
60 60 60
60 60
80 80 80
80 80
100 100 100
100 100
Sensitivity
Sensitivity Sensitivity
100-specificity
A B C
present low sensitivity and specificity to motivate a change in the treatment plan for locally advanced rectal cancer.
In the meta-analysis with the largest number of pa-tients (n=1,527), Li et al.34 found SUV
max2 and ∆%TRP to
determine pCR alone. The results of subgroup analysis showed that ∆%SUVmax before and after therapy had
higher specificity to predict the degree of tumor regression than pCR alone. Unfortunately, ∆%SUVmax in our study
was not strong enough to separate responders from non-responders due probably to the small sample size, which constitutes a limitation. The other potential issue related to the weakness of this variable might be related to inflam-mation after radiotherapy. Inflammatory cells can take
18F-FDG up, mimicking viable cancer cells and limiting
the use of this methodology for response evaluation. The other variables SUV40%-2, SUV50%-2 and SUV60%-2
should be used with caution, since tumor segmentation using PET images with these thresholds has significant interference depending on the heterogeneity of the tumor. Thus, underestimation could be the main issue of this
meth-odology to evaluate tumor response with unreliable results.
C
ONCLUSIONOur study confirmed the predictive power of the variables using a noninvasive individualized methodology for tumor segmentation based on 18F-FDG PET/CT imaging for
response evaluation in patients with rectal cancer after neoadjuvant chemoradiation therapy. The reliability of these results should be applied to a larger number of patients and cannot exempt responders from radical sur-gery. It is also worth noting that there is a need to stan-dardize the methodology of the tests using 18F- FDG PET/
CT imaging so that the results can be compared. Although additional work remains to be done, the methodology presented in our study is of general interest, as it intro-duces a new perspective for the use of this imaging modal-ity on the evaluation of chemoradiation therapy response, with potential clinical impact due to the personalized-type analysis for therapeutic response evaluation in rectal cancer patients.
A
CKNOWLEDGMENTSThe authors thank FAPEMIG for the financial support and Sofia Lage for proofreading the manuscript.
R
ESUMOIndividualização na segmentação tumoral de imagens de
18F-FDG PET/CT: a chave para avaliação de resposta
te-rapêutica neoadjuvante em pacientes com câncer retal?
Introdução: O câncer retal (RC) é uma doença de impor-tância global, e o tratamento padrão para o câncer retal localmente avançado compreende quimiorradiação neoad-juvante seguida de cirurgia radical. Independentemente do uso extensivo da captação tumoral mais intensa do
18F-FDG (conhecida como SUV
max) como representativo
do consumo glicolítico do tumor nas imagens de PET, há uma tendência para aplicar volume metabólico. Dessa forma, o objetivo do presente estudo foi avaliar um mé-todo não invasivo de segmentação tumoral utilizando a
18F-FDG PET para predizer a resposta à
quimiorradiote-rapia neoadjuvante em pacientes com câncer de reto.
Método: A amostra consistiu em pacientes com câncer retal em estádios II e III submetidos ao exame de 18F-FDG
PET/CT antes e oito semanas após a terapia neoadjuvan-te. Foi aplicada uma metodologia de segmentação tumo-ral individualizada para gerar volumes tumorais (SUV2SD).
A resposta terapêutica foi avaliada nos espécimes resse-cados utilizando as recomendações do protocolo de Dwo-rak. Várias variáveis foram geradas e comparadas com os resultados histopatológicos.
Resultados: Dezessete (17) pacientes foram incluídos e analisados. Foram observadas diferenças significativas entre os respondedores (Dworak 3 e 4) e não responde-dores para SUVmax-2 (p<0,01), SUV2SD-2 (p<0,05), SUV40%-2
(p<0,05), SUV50%-2 (p<0,05) e SUV60%-2 (p< 0,05). As análises
ROC mostraram áreas significativas sob a curva (p<0,01) para a metodologia proposta, com sensibilidade e especifi-cidade variando de 60% a 83% e 73% a 82%, respectivamente.
Conclusão: O presente estudo confirmou o poder predi-tivo das variáveis utilizando uma metodologia não inva-siva individualizada para segmentação tumoral baseada em imagens 18F-FDG PET/CT para avaliação da resposta
em pacientes com câncer retal após tratamento com qui-miorradiação neoadjuvante.
Palavras-chave: Neoplasias Retais. Terapia Neoadju-vante. Fluorodesoxiglucose F18. Tomografia por Emis-são de Pósitrons.
R
EFERENCES1. GLOBOCAN 2012: Estimated Cancer Incidence, Mortality and Prevalence Worldwide in 2012. IARC 2017 (http://globocan.iarc.fr/Pages/fact_sheets_ cancer.aspx)
2. Estimativa 2016: incidência de câncer no Brasil / INCA - Instituto Nacional de Câncer José Alencar Gomes da Silva. (http://www.inca.gov.br/wcm/ dncc/2015/estimativa-2016.asp)
3. Sauer R, Liersch T, Merkel S et al. Preoperative versus postoperative chemoradiotherapy for locally advanced rectal cancer: results of the German CAO/ ARO/AIO-94 Randomized Phase III Trial after a median follow-up of 11 years. J Clin Oncol. 2012; 30:1926–1933. doi: 10.1200/JCO.2011.40.1836. 4. Roh MS, Colangelo LH, O’Connell, MJ, YoThers G, Deutsh, M, Allegra, CJ,
patients with carcinoma of the rectum: NSABP R-03 J Clin Oncol 2009, 27:5124-5130. doi: 10.1200/JCO.2009.22.0467.
5. Ryan JE, Warrier SK, Lynch AC, Heriot AG. Assessing pathological complete response to neoadjuvant chemoradiotherapy in locally advanced rectal cancer: a systematic review. Colorectal Dis. 2015; 17:849-61. doi: 10.1111/codi.13081. 6. Fokas E, Liersch T, Fietkau R, Hohenberger W, Beissbarth T, Hess C, et al. Tumor Regression Grading After Preoperative Chemotherapy for Locally Advanced Rectal Carcinoma Revised: Updated Results of the CAO/ARO/ AIO-94 Trial. J Clin Oncol. 2014; 32:1554-62. doi: 10.1200/JCO.2013.54.3769. 7. Dickman R, Kundel Y, Levy-Drummer R, Purim O, Wasserberg N, Fening E et al. Restaging locally advanced rectal cancer by different imaging modalities after preoperative chemoradiation: a comparative study. Radiat Oncol. 2013, 8:278. doi: 10.1186/1748-717X-8-278.
8. Lee SJ, Kim JG, Lee Sang-Woo, Chae YS, Kang BW, Lee YJ, et al. Clinical implications of FDG-PET/CT initial in locally advanced rectal cancer treated with neoadjuvant chemorradiotherapy. Cancer Chemother Pharmacol. 2013; 71(5):1201-1207. doi: 10.1007/s00280-013-2114-0.
9. Hopkins S, Fakih M, Yang GY. Positron emission tomography as predictor of rectal cancer response during or following neoadjuvant chemoradiation. World J Gastrointest Oncol. 2010; 2:213-217. doi: 10.4251/wjgo.v2.i5.213 10. Mohandas A, Marcus C, Kang H, Truong MT, Subramaniam RM. FDG PET/
CT in the management of nasopharyngeal carcinoma.AJR Am J Roentgenol 2014, 203:W146-157. doi: 10.2214/AJR.13.12420.
11. Tantiwongkosi B, Yu F, Kanard A, Miller FR. Role of (18)F-FDG PET/CT in pre and post treatment evaluation in head and neck carcinoma. World J Radiol 2014, 6:177-191. doi: 10.4329/wjr.v6.i5.177
12. Pyo J, Won Kim K, Jacene HA, Sakellis CG, Brown JR, Van den Abbeele AD. End-therapy positron emission tomography for treatment response assessment in follicular lymphoma: a systematic review and meta-analysis. Clin Cancer Res 2013, 19:6566-6577. doi: 10.1158/1078-0432.CCR-13-1511. 13. Bensch F, van Kruchten M, Lamberts LE, et al. Molecular imaging for monitoring treatment response in breast cancer patients. Eur J Pharmacol 2013, 717:2-11. doi: 10.1016/j.ejphar.2013.01.079.
14. Maffione AM, Chondrogiannis S, Marzola MC, Rampin L, Grassetto G, Ferretti A, et al. Biological Target Volume Overlapping Segmentation System Method for Avoiding False-Positive PET Findings in Assessing Response to Neoadjuvant Chemoradiation Therapy in Rectal Cancer. Clin Nucl Med 2014, 39:e215-e219. doi: 10.1097/RLU.0000000000000265.
15. Memon S, Lynch AC, Akhurst T, Ngan SY, Warrier SK, Michael M, et al. Systematic review of FDG-PET prediction of complete pathological response and survival in rectal cancer. Ann Surg Oncol 2014, 21:3598-3607. doi: 10.1245/s10434-014-3753-z.
16. Calvo FA, Sole CV, Mata D, Cabezón L, Gómez-Espí M, Alvarez E, et al. 18F-FDG PET/CT-based treatment response evaluation in locally advanced rectal cancer: a prospective validation of long-term outcomes. Eur J Nucl Med Mol Imaging 2013, 40:657-667. doi: 10.1007/s00259-013-2341-y. 17. Koo PJ, Kim SJ, Chang S, Kwak JJ. Interim Fluorine-18 Fluorodeoxyglucose
Positron Emission Tomography/Computed Tomography to Predict Pathologic Response to Preoperative Chemoradiotherapy and Prognosis in Patients With Locally Advanced Rectal Cancer. Clin Colorectal Cancer. 2016; 15:e213-e219. doi: 10.1016/j.clcc.2016.04.002.
18. Travaini LL, Zampino MG, Colandrea M, Ferrari ME, Gilardi L, Leonardi MC, Santoro L, Orecchia R, Grana CM. PET/CT with Fluorodeoxyglucose During Neoadjuvant Chemoradiotherapy in Locally Advanced Rectal Cancer. Ecancer-medicalscience. 2016;10:629.doi: 10.3332/ecancer.2016.629. eCollection 2016. 19. Rymer B, Curtis NJ, Siddiqui MR, Chand M. FDG PET/CT Can Assess the Response of Locally Advanced Rectal Cancer to Neoadjuvant
Chemoradiotherapy: Evidence From Meta-analysis and Systematic Review. Clin Nucl Med. 2016; 41:371-375. doi: 10.1097/RLU.0000000000001166. 20. Caldwell CB, Mah K, Ung YC, Danjoux CE, Balogh JM, Ganguli SN, et al.
Observer variation in contouring gross tumor volume in patients with poorly defined non-small-cell lung tumors on CT: the impact of 18FDG-hybrid PET fusion. Int J Radiat Oncol Biol Phys.2001;51:923–931.
21. Erdi YE, Mawlawi O, Larson SM, Imbriaco M, Yeung H, Finn R, et al. Segmentation of lung lesion volume by adaptive positron emission tomography image thresholding. Cancer 1997;80 Suppl 12:2505–9. 22. Erdi YE, Wessels BW, Loew MH, Erdi AK. Threshold estima- tion in single
photon emission computed tomography and planar imaging for clinical radioimmunotherapy. Cancer Res. 1995; 55 Suppl 23:5823–5826s. 23. Daisne JF, Sibomana M, Bol A, Doumont T, Lonneux M, Gregoire V.
Tri-dimensional automatic segmentation of PET volumes based on measured source-to-background ratios: influence of reconstruction algorithms. Radiother Oncol. 2003; 69:247–50.
24. Dos Anjos DA, Perez RO, Habr-Gama A, et al. Semiquantitative Volumetry by Sequential PET/CT May Improve Prediction of Complete Response to Neoadjuvant Chemoradiation in Patients With Distal Rectal Cancer. Dis Colon Rectum. 2016; 59:805-812. doi: 10.1097/DCR.0000000000000655 25. Li QW, Zheng RL, Ling YH, et al. Prediction of tumor response after
neoadjuvant chemoradiotherapy in rectal cancer using (18)fluorine-2-deoxy-D-glucose positron emission tomography-computed tomography and serum carcinoembryonic antigen: a prospective study. Abdom Radiol. 2016; 41:1448-1455. doi: 10.1007/s00261-016-0698-7.
26. Withofs N, Bernard C, Van der Rest C, et al. FDG PET/CT for rectal carcinoma radiotherapy treatment planning: comparison of functional volume delineation algorithms and clinical challenges. J Appl Clin Med Phys. 2014; 15:4696. doi: 10.1120/jacmp.v15i5.4696.
27. Edge S, Byrd DR, Compton CC, Fritz AG, Greene FL, Trotti A. AJCC Cancer Staging Manual, 7th Ed, 649p, Springer; 2010.
28. Mamede M, El Fakhri, Lima PA, Gandler W, Nosé V, Gerbaudo et al, Pre-operative estimation of esophageal tumor metabolic length in FDG-PET images with surgical pathology confirmation. Ann Nucl Med 2007, 21:553-562. 29. Mamede M, Abreu-e-Lima P, Oliva MR, Nosé V, Mamon H, Gerbaudo VH.
FDG-PET/CT tumor segmentation-derived indices of metabolic activity to assess response to neoadjuvant therapy and progression-free survival in esophageal cancer: correlation with histopathology results. Am J Clin Oncol 2007, 30:377-388.
30. Dworak O, Keilholz L, Hoffmann A. Pathological features of rectal cancer after preoperative radiochemotherapy. Int J Colorectal Dis 1997, 12:19-23. 31. Hur H, Kim NK, Yun M, Min BS, Lee KY, Keum KC, et al. 18Fluoro-Deoxy-Glucose Positron Emission Tomography in Assessing Tumor Response to Preoperative Chemoradiation Therapy for Locally Advanced Rectal Cancer. J Surg Oncol 2011, 103:17-24. doi: 10.1002/jso.21736.
32. Guerra L, Niespolo R, Di Pisa G, Ippolito D, De Ponti E, Terrevazzi Set al. Change in glucose metabolism measured by 18F-FDG PET/CT as a predictor of histopathologic response to neoadjuvant treatment in rectal cancer. Abdom Imag 2011, 36:38-45. doi: 10.1007/s00261-009-9594-8.
33. Kim JW, Kim HC, Park JW, Park SC, Sohn DK, Choi HS et al. Predictive value of 18FDG PET-CT for tumor response in patients with locally advanced rectal cancer treated by preoperative chemoradiotherapy. Int J Colorectal Dis 2013, 28:1217-1224. doi: 10.1007/s00384-013-1657-1.
34. Li C, Lan X, Yuan H, Feng H, Xia X, Zhang Y. 18F-FDG PET predicts pathological response to preoperative chemoradiotherapy in patients with primary rectal cancer: a meta-analysis. Ann Nucl Med 2014, 28:436-446. doi: 10.1007/s12149-014-0837-6.