David C. Wyld et al. (Eds) : CCSIT, SIPP, AISC, PDCTA, NLP - 2014
pp. 99–114, 2014. © CS & IT-CSCP 2014 DOI : 10.5121/csit.2014.4209
Ittipong Khemapech
11
School of Science and Technology, University of the Thai Chamber of Commerce, Bangkok, Thailand
A
BSTRACTEnergy conservation is one of the important issues in communication protocol development for Wireless Sensor Networks (WSNs). WSNs are a shared medium system, consequently a Medium Access Control (MAC) protocol is required to resolve contention. The feature of the MAC together with the application behavior determines the communication states which have different power requirements. The power level used for a transmission, will affect both the effective range of the transmission and the energy used. The Power & Reliability Aware Protocol (PoRAP) has been developed to provide efficient communication by means of energy conservation without sacrificing reliability. It is compared to Carrier Sense Multiple Access (CSMA), Sensor-MAC (S-MAC) and Berkeley-MAC (B-MAC) in terms of energy consumption. The analysis begins with a parameter space study to discover which attributes affect the energy conservation performance. Parameter settings in the Great Duck Island are used for comparative study. According to the results, PoRAP consumes the least amount of communication energy and it is applicable when the percentage of slot usage is high.
K
EYWORDSEnergy Aware, Sensor, Communication Protocols, Comparative Analysis
1.
I
NTRODUCTIONWireless sensor networks (WSNs) are an important area of research. Data is transmitted to a destination without the need for communication cables. There are power and resource constraints upon WSNs, in addition WSNs are a shared medium system. The features of the Medium Access Control (MAC) protocol together with the application behaviour shape the communication states of the node. As each of these states have different power requirements the MAC protocol impacts upon the operation and power consumption efficiency.
The Power & Reliability Aware Protocol (PoRAP) has been developed [1]. Its main objectives are to provide efficient data communication by means of energy conservation without sacrificing required reliability. This has been achieved by using direct communication, adaptive power adaptation and intelligent scheduling. There are some scenarios where direct communication is applicable and a significant amount of communication energy can be saved.
environments where it is appropriate to use PoRAP. The three protocols are Carrier Sense Multiple Access (CSMA) [2], Sensor Medium Access Control (S-MAC) [3] and Berkeley MAC (B-MAC) [4]. Both B-MAC and S-MAC are specifically developed for low duty cycle applications and CSMA is the default MAC protocol in TinyOS which is the chosen operating system for PoRAP development [5].
The remaining parts of this paper are organised as follows: Section 2 describes the methodology used in the comparative analysis. The Great Duck Island (GDI) [6], a production habitat monitoring system, and the calculation of energy consumption are summarized. Section 3 investigates how each parameter affects the energy consumption. The details of a comparative study are provided in Section 4. The GDI scenario is used and the methodology in [4] is adopted. Finally, the conclusion is stated in Section 5.
2.
M
ETHODOLOGYThis paper focuses on analysis of communication energy of the protocols. This section describes the Great Duck Island (GDI), a production habitat monitoring wireless sensor network (WSN) that is used in the analysis. Further, the calculation of energy consumption is outlined.
2.1. Great Duck Island (GDI)
The GDI is an important production WSN application. It is a habitat monitoring system [6]. Tiered architecture was used; the first tier consisted of sensor patches and gateways. There were up to 100 sensors in each patch. The gateway acted as a relay node. Data communication within each patch was either single or multi-hop depending on the distances between sensors and their gateway. The second tier provided connectivity between multiple patches.
The motes remained at their original positions throughout a 9-month operation. The selected sampling period in GDI was 5 minutes or 300s [6]. The data payload was 36 bytes and the required duty cycle was approximately 1.7% [4]. Several parameter settings in GDI and those given in [4] are used in this comparative study. Energy consumption required by each protocol is calculated and compared to the GDI scenario.
2.2. Calculation of Energy Consumption
In order to determine the effects of parameter space, the methodology given in [4] is adopted. The chosen metric is average energy usage per second. It is defined as a ratio of total energy consumed by a source to the total number of transmitted data bits in 1 second. The total energy consumption is the summation of energy used for control packet reception, data packet transmission, listening and sleeping. The data payload is used for calculating the total number of sent bits.
According to the methodology, communication delays required for a specific size of data payload is calculated with respect to a 1-second interval by taking the sampling period into consideration. The sampling period is defined as an interval in seconds between two data collections and transmissions. The inverse of the sampling period indicates the amount of data being collected and transmitted within a second or the data reporting rate. For example, a 10 second sampling period means that a source sends one piece of 36 byte data every 10 seconds. It can also be stated that, on average, the source sends 3.6 bytes of data every second.
Computer Science & Information Technology (CS & IT) 101 interval and the relevant power. As the communication protocol in [4] was developed for multi-hop sensor networks, each node located within the communication range of the sending node has to receive the transmitted packets and the number of neighbors is included in the calculation of reception energy. The duration computations are detailed as follows:
2.2.1. Transmission
The duration required for data transmission per second is equal to the product of the data reporting rate, which is dependent upon application’s requirement in packets per second, the number of bytes being transmitted and the duration required for transmitting 1 byte of data.
2.2.2. Reception
The receiving duration is equal to the products of the attributes used in the transmission and the number of neighbors. Hence, each source has to receive all of the incoming messages from its neighbors.
2.2.3. Listening
The listening period is equal to the product of total durations required for wakeup and carrier sensing in CSMA, B-MAC and also synchronization between nodes in S-MAC. The wakeup interval is obtained from [7] where the measurements were conducted directly from Tmote Sky motes. In total 4.18ms was required for starting the radio voltage regulator, starting the radio oscillator, preparing the packet, loading the radio FIFO and setting the radio to transmission mode.
2.2.4. Sleeping
The sleeping period is the average time per second after subtracting transmission, reception and listening.
After obtaining all communication durations, they will be multiplied by the power in milli-watts (mW) to get energy consumption. According to [8], the required power for data transmission depends upon the power settings. For example, the power of 25.50 and 52.20mW are used at the minimum and maximum settings. The required power for receiving, listening and sleeping is respectively 59.10, 1.10 and 0.06mW. The selected data payload size is set to 36 bytes. The number of neighbours ranges from 1 to 100 nodes. The data sampling periods of 10, 50, 100 and 300s are used in the parameter space study.
3.
A
NALYSIS OFP
ARAMETERS
PACE OFP
ROTOCOLSThe main objective of parameter space analysis is to investigate how each parameter affects the energy consumption. Several attributes required for the calculation are provided in the previous section. As each protocol has its own set of different message exchanges, the details of communication delay calculations are described separately.
3.1. Berkeley-MAC (B-MAC)
Three main parameters affecting the energy consumption include the check interval, the data sampling period and the number of neighbours. The check interval indicates the duration of the source listening to the incoming signal. An inverse of the check interval is therefore the channel sampling frequency. B-MAC provides reliable data reception by preamble transmission. The preamble length must be at least the check interval. The size of preamble must be included in the total number of sent and received bytes.
The data sampling period illustrates the duration between two consecutive data collections and transmissions and its inverse indicates the data reporting rate in packets per second. The number of neighbours is important to the calculation of reception duration as all nodes located within the communication range of the sending node have to receive the message.
3.1.1. Parameter Settings
The settings in [4] apply in this analysis such as data payload size and the check intervals of 10, 20, 50, 100 and 200ms. An average energy consumption of up to 100 neighbours is computed.
3.1.2. Results
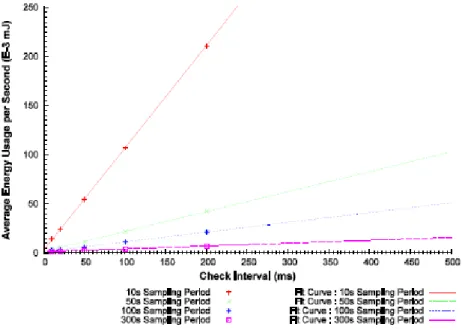
Figure 1 shows the effects of check interval and sampling period on the average energy usage in B-MAC.
Computer Science & Information Technology (CS & IT) 103
(b) At various sampling periods Figure 1. Average energy usage in B-MAC
Linear relationships are observed in Figure 1(a) whilst inverse relationships are used in the plots in Figure 1(b). The R-square values for both figures are over 0.99 or more than 99% of data can fit. A smaller amount of energy will be used if a shorter check interval is used. However, the shortest duration is 4.18ms as it is required for starting and initialising the hardware components [7].
More energy is required for a longer check interval if a sampling period is fixed. However, less energy is consumed if the sensors sample the data less frequently. A significant reduction in energy is observed when the sampling period is decreased from 10 to 100s. The degree of reduction is lower when a shorter check interval is used. For example, at a 200ms check interval, almost 10 times the energy is consumed if a sampling period of 100s is used instead of 10s whilst approximately 3 times the energy is saved at a 10ms check interval.
The data sampling rate and check interval affects the transmission and reception energy. The number of neighbours is included in order to compute the reception duration and corresponding energy. Preamble transmission and reception can be considered as an overhead in B-MAC and increases with the number of neighbours. The source transmits its data to all of its neighbours located within the communication range. Each neighbour has to listen and receive their data. Routing is also conducted in order to forward the data to its destination. The cost in terms of energy consumption is added to both sender and receiver to provide a reliable data reception at the receiver. The receiver’s wakeup schedule also affects the energy consumption.
3.2. Sensor-MAC (S-MAC)
also used for data reception acknowledgement. Transmissions and receptions of additional control frames affect the energy consumption.
The effects of the three main parameters; active duration, data reporting rate and number of neighbours on energy consumption per bit of data are studied. According to [3], the default active period is set to 115ms. Carrier sensing, frame transmissions and receptions occur within this period. Energy consumption is equal to the product of communication delay and power. The data reporting rate is required to compute the number of packets per second. The data reporting rate is the inverse of the data sampling rate per second.
3.2.1. Parameter Settings
Several settings in [3] and [9] apply in this analysis. The lengths of SYNC (Synchronization), RTS (Request-To-Send), CTS (Clear-To-Send) and ACK (Acknowledgement) are set to 8, 20, 14 and 14 bytes, respectively. The active intervals of 115, 250, 500, 750 and 1,000ms are used.
3.2.2. Results
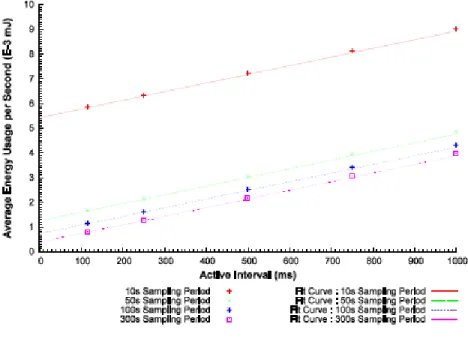
Figure 2 shows the effects of active interval and sampling period on the average energy usage in S-MAC.
At a specific sampling period, the average energy usage per second linearly increases with the active interval. However, the default duration is 115ms [3]. A lower active interval cannot accommodate the transmission and reception delays when there are many neighbours.
Computer Science & Information Technology (CS & IT) 105
(b) At various sampling periods Figure 2. Average energy usage in S-MAC
A considerable reduction in energy usage is observed at longer sampling periods. Up to 10 times the energy can be saved if the sensors sample every 300s instead of 10s. Figure 2(b) demonstrates an inverse technique used for fitting the plots of the relationship between the sampling period and energy usage. A significant reduction in energy consumption will be obtained if the sensors sample every 100s or longer. The main reason is that the sensor can be in sleep mode longer. The R-square values are over 0.99.
Several control frames including SYNC, RTS, CTS and ACK frames can be considered as overheads in S-MAC. The number of control transmissions and receptions increases with the number of neighbours. The sending source exchanges its scheduling information with its neighbors. An RTS is sent if the source has data to send. The DATA frame is not delivered unless the source receives the CTS. The receiver sends the ACK frame after the DATA is received. The minimum active duration is 115ms as specified in [3]. In order to yield a low duty cycle, the data sample period should be high. For example, the sources sample data every 11.5s to achieve a 1% duty cycle. For a higher number of neighbours, the source which samples data more frequently requires more energy than the one with a longer sampling period.
3.3. Carrier Sense Multiple Access (CSMA)
Carrier Sense Multiple Access with Collision Avoidance (CSMA/CA) is the default MAC protocol in TinyOS. Prior to transmission, the source senses the medium in order to detect whether there are ongoing activities. As the sources listen all the time, the listening energy accounts for a large proportion of the total communication energy. The effects of the data sampling period and the number of neighbors on energy consumption per bit of data are studied.
3.3.1. Parameter Settings
3.3.2. Results
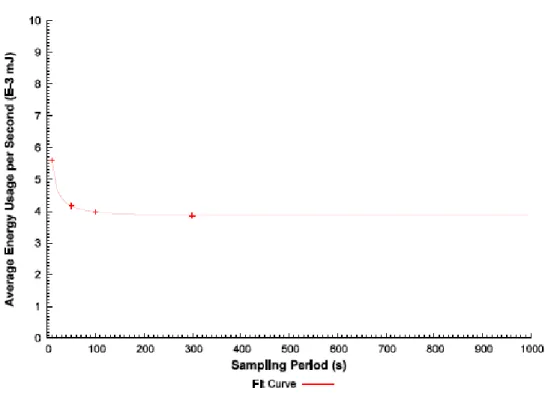
Figure 3 shows the effects of sampling period on the average energy usage in CSMA. Like B-MAC and S-B-MAC, less frequent data sampling results in less energy usage. This is because there are fewer data communications within a specific interval. Approximately 4 milli-joules (mJ) is required if the sensors sample every 100ms or longer.
Idle listening is an important overhead as the sources constantly listen to the signal. The sampling period and the number of neighbours affect the energy consumption. A high amount of energy is required when the network includes many sources and they sample the medium more often.
Figure 3. Average energy usage in CSMA
3.4. Power & Reliability Aware Protocol (PoRAP)
There are two main parameters in PoRAP. The control packet size is directly dependent upon the number of sources. A byte of payload is required in the control packet for notifying the transmission power adaptation to every four sources because two bits are required for signalling power adaptation to each source. The duration of the control packet reception and the corresponding energy requirement for the four sources is the same. The effects of sampling periods and number of sources on the energy consumption are considered in this section.
3.4.1. Parameter Settings
The selected number of sources, data payload size and application data sampling periods are the same as in the previous analyses. As PoRAP is specifically designed for direct communication, the maximum power is always used in the analysis.
3.4.2. Results
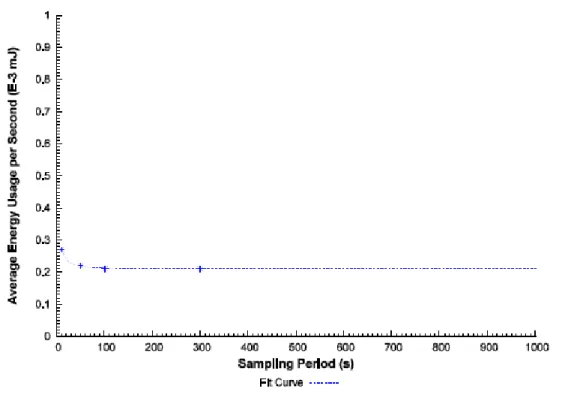
Computer Science & Information Technology (CS & IT) 107 results in a lower average energy usage per second. The reduction in energy in PoRAP is the least compared to B-MAC, S-MAC and CSMA. This is because the packet is delivered directly to the base station and no data forwarding is required. The overhead is only related to the number of sources. However, PoRAP cannot accommodate a high frequency of transmission especially when there are many sources as it is a schedule-based protocol. It has to wait for all sources to complete their transmissions to start a new communication cycle.
Control packet reception can be considered as an important overhead in PoRAP. The size of control packet is related to the number of sources. According to the parameter settings, a source consumes approximately 0.2 to 0.3 milli-joules (mJ) in transmitting one bit of data. Like other protocols, a higher amount of energy is required when there are more sources in the network and the sampling period is lower.
Figure 4. Average energy usage in PoRAP
4.
C
OMPARATIVES
TUDY(a) 10s sampling period
Computer Science & Information Technology (CS & IT) 109
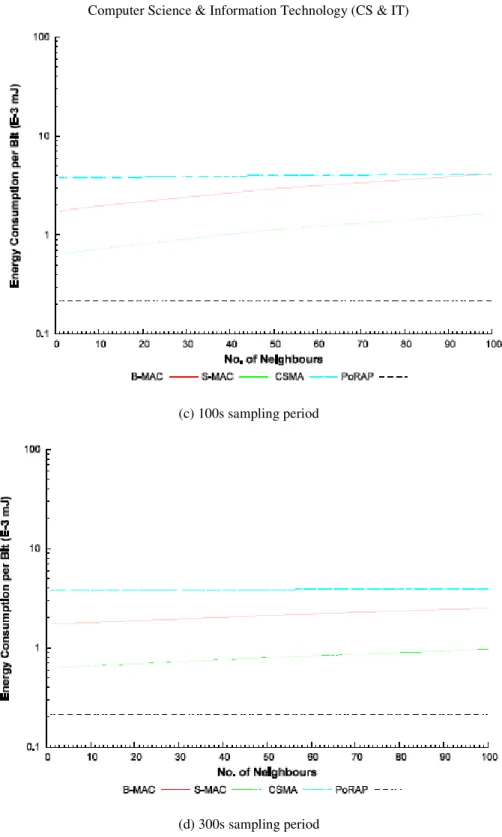
(c) 100s sampling period
(d) 300s sampling period
Figure 5. Comparison in energy consumption at various sampling periods
more energy when the sampling period is smaller and the number of sources is higher. For example, at the 300s sampling period and 50 sources, PoRAP consumes approximately 33%, 10% and 5% of that required by S-MAC, B-MAC and CSMA, respectively.
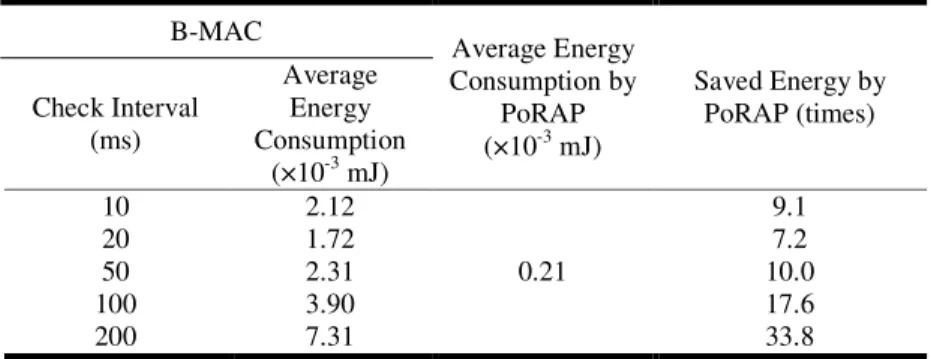
The amount of saved energy by PoRAP due to amendments in check interval and active interval settings in B-MAC and S-MAC are shown in Table 1 and 2, respectively. The selected sampling period is 300s. The average energy consumption is computed based upon the number of sources varying from 1 to 100 nodes.
Increases in the amount of conserved energy by PoRAP are observed in both Table 1 and 2 when check and active intervals are increased. The comparisons conducted in Table 1, 2 and Figure 5 are based upon the parameter settings with respect to the GDI scenario where the frequency of data transmission is low. In order to investigate whether PoRAP is applicable to applications which require a high frequency of transmission, an experiment using one source is performed. The chosen check interval for B-MAC and active interval for S-MAC are 10ms and 115ms, respectively. The results are shown in Figure 6.
Table 1. Comparison of energy consumption between B-MAC and PoRAP B-MAC
Average Energy Consumption by
PoRAP (×10-3 mJ)
Saved Energy by PoRAP (times) Check Interval (ms) Average Energy Consumption
(×10-3 mJ)
10 2.12
0.21
9.1
20 1.72 7.2
50 2.31 10.0
100 3.90 17.6
200 7.31 33.8
Table 2. Comparison of energy consumption between S-MAC and PoRAP
S-MAC Average
Energy Consumption
by PoRAP (×10-3 mJ)
Saved Energy by PoRAP (times) Active Interval (ms) Average Energy Consumption
(×10-3 mJ)
115 0.80
0.21
2.8
250 1.28 5.1
500 2.18 9.4
750 3.08 13.7
1,000 3.98 18.0
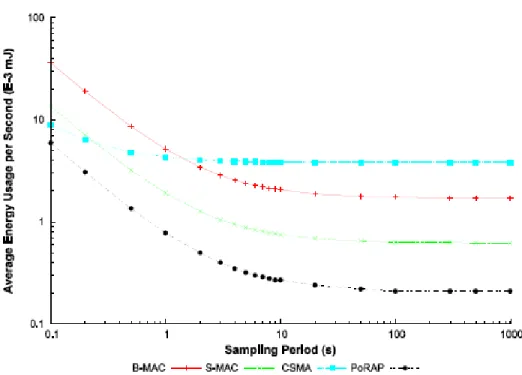
Figure 6. Effects of sampling periods on average energy usage per second
According to Figure 6, PoRAP is capable of supporting high frequency transmission. The main reason is that a time slot is allocated to a source so it can transmit again without waiting. The CSMA consumes higher energy than B-MAC and S-MAC when the sampling period is longer than 1.5s and 0.25s. In the case where a source sends every 0.1s, PoRAP uses 16%, 44% and 67%
Computer Science & Information Technology (CS & IT) 111
Figure 6. Effects of sampling periods on average energy usage per second
Previous results are based upon the assumption that the number of slots is equal to that of sources. However, there may be a case where the number of sources is unknown in advance. Further, the topology may be changed as some sources may leave or run out of energy. In such cases, the number of slots is higher than the number of sources. PoRAP is sometimes not applicable, for high duty cycle applications, as the source has to wait for the other slots to complete until the next communication cycle is started. Table 3 demonstrates the effects of the percentage of slot usage on minimum applicable sampling periods and corresponding average energy consumption in PoRAP. There is a single operating source in the network.
Table 3. Comparison of energy consumption at various sampling periods
Number of
Allocated Slots Slot Usage (%)
Minimum Applicable Sampling Period (s)
Average Energy Usage per Second
(×10-3 mJ)
100 1 3 0.40
50 2 1.5 0.59
20 5 0.6 1.17
10 10 0.3 2.12
5 20 0.2 3.08
2 50 0.1 5.96
1 100 0.1 5.96
sampling period) as it uses 16%, 43% and 48.5% of the energy of B-MAC, S-MAC and CSMA, respectively. A significant amount of energy can be saved by PoRAP when it is applicable.
In summary, several parameter settings such as data payload size and sampling interval in the Great Duck Island [6] and those in [4] are used in this comparative study. Longer communication durations result in a higher energy consumption. PoRAP is not significantly affected by the number of sources compared to S-MAC and B-MAC as intermediate nodes are not required for data forwarding. The main limitation of PoRAP is that it is not applicable to high duty cycle applications when the percentage of slot usage is low. However, it can conserve more energy than the other protocols when it can be used. The main reason is that it does not require multiple transmissions and receptions. Further, the sources are periodically switched to sleep mode to conserve energy.
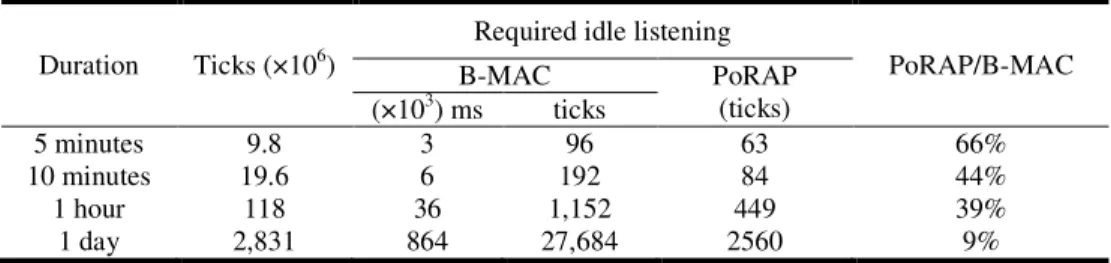
Apart from considering energy consumption per bit per second, idle listening is an important source of energy wastage. CSMA uses the most amount of energy on idle listening, especially when the sampling period is high. Preamble is used in B-MAC for reliable data reception and its length is at least a check interval. Idle listening energy becomes significant for B-MAC for longer check intervals. Further comparison of required idle listening periods between B-MAC and PoRAP is determined.
According to [1], four durations between two consecutive data transmissions including 5 minutes, 10 minutes, 1 hour and 1 day, are studied to determine additional duration required in PoRAP for tackling the effects of clock drift and achieving time synchronisation. For B-MAC, a 1s period is and 10ms check interval are used. This means that B-MAC has to conduct preamble communication for 10ms every second. Hence, the node running B-MAC has to listen for the preamble for (60×10) or 600ms within 1 minute. Table 4 compares the required idle listening periods between B-MAC and PoRAP. Note that a 32Khz timer is used in the comparison and there are 32 ticks in each millisecond.
Table 4. Comparison of required idle listening periods between B-MAC and PoRAP
Duration Ticks (×106)
Required idle listening
PoRAP/B-MAC
B-MAC PoRAP
(ticks) (×103) ms ticks
5 minutes 9.8 3 96 63 66%
10 minutes 19.6 6 192 84 44%
1 hour 118 36 1,152 449 39%
1 day 2,831 864 27,684 2560 9%
According to Table 4, PoRAP requires fewer ticks in all durations. A higher conservation in the idle listening period will be obtained if there are longer durations between transmissions. PoRAP uses only 9% of the ticks for accommodating time synchronisation compared to preamble communication in MAC when the source sends every day. One of the main reasons is that B-MAC is specifically developed for the multi-hop wireless sensor networks where routing is necessary amongst sources. The sources have to check if there are packets addressed to them. Unlike the multi-hop, PoRAP is applied to direct communication and each source knows its communication schedule. The source is therefore often in the sleep mode.
5.
C
ONCLUSIONComputer Science & Information Technology (CS & IT) 113 interest and they are wirelessly connected. Hence, communication and power cables are not necessary. However, energy and resource constraint are major drawback of WSNs application in the real-world. Energy aware protocols have been developed for WSNs. This paper presents a comparative analysis between Power & Reliability Aware Protocol (PoRAP) and B-MAC, S-MAC and CSMA in terms of energy consumption.
According to the parameter space analysis, the check interval and active period are overheads of B-MAC and S-MAC, respectively. In B-MAC, the preamble length is at least a check interval. An active period is used in S-MAC for carrier sensing, hidden node avoidance and synchronisation between neighbours. The default active interval of S-MAC is 115ms. Idle listening is an important overhead in CSMA as the sources listen all the time. Control packet reception is considered as an overhead in PoRAP. The size of a control packet directly relates to the number of sources.
In the comparative study, an average energy usage per second is computed. The selected sampling period and data payload are 300s and 36 bytes which are the same as [4]. The chosen check interval of B-MAC is 10ms. PoRAP is not applicable to the applications which require a low duty cycle when the percentage of slot usage is low. This is because the source has to wait until all slots are completed to start a new communication cycle. A network consisting of a single source is used. In the case of 20% slot usage and 2s sampling period, PoRAP uses 16%, 43% and 48.5% of the energy of B-MAC, S-MAC and CSMA, respectively.
PoRAP consumes approximately 0.2 to 0.3 × 10⁻³ mJ for transmitting one bit of data. It consumes less energy when the sampling is less often and the number of sources is higher. PoRAP consumes approximately 33%, almost 10% and almost 5% of that required by S-MAC, B-MAC and CSMA, respectively. A larger amount of conserved energy is achieved if the check and active intervals in B-MAC and S-MAC are increased. In the case where the 200ms and 1,000ms check and active intervals are respectively chosen in the B-MAC and S-MAC, PoRAP consumes approximately 3% and 5% of the energy required by such protocols.
Further analysis of the active period required by B-MAC for preamble communications and PoRAP for accommodating time synchronisation is conducted. The 10ms check interval is used. As energy consumption directly relates to the active duration, the results demonstrate that at a 300s sampling period and a 50source topology, up to approximately 10% of the energy can be conserved if PoRAP is used instead of B-MAC. The results demonstrate that PoRAP is applicable for the low duty cycle applications. The sources benefit more from PoRAP in terms of energy conservation compared to B-MAC, S-MAC and CSMA.
R
EFERENCES[1] I. Khemapech, I. Duncan & A. Miller, (2010) “Energy Preservation in Environmental Monitoring WSN”, In The Proceedings of IEEE International Conference on Sensor Networks, Ubiquitous and Trustworthy, pp 312-319.
[2] L. Kleinrock & F.A. Tobagi, (1975) “Packet Switching in Radio Channels: Part 1 – Carrier Sense Multiple-Access Modes and Their Throughput-Delay Characteristics”, IEEE Computer Communication.
[3] W. Ye, J. Heidemann & D. Estrin, (2003) “Medium Access Control with Coordinated, Adaptive Sleeping for Wireless Sensor Networks”, USC/ISI Technical Report ISI-TR-567.
[4] J. Polastre, J. Hill & D. Culler, (2004) “Versatile Low Power Media Access for Wireless Sensor Networks”, In The Proceedings of ACM International Conference on Embedded Networked Sensor Systems. ACM Press.
[6] A. Mainwaring, J. Polastre, R. Szewczyk, D. Culler, D & J. Anderson, (2002) “Wireless Sensor Networks for Habitat Monitoring”, In The Proceedings of ACM International Workshop on Wireless Sensor Networks and Applications. ACM Press.
[7] R. Lim, (2006) “Wireless Fire Sensor Network Demonstrator” M.S. thesis, Swiss Federal Institute of Technology, Zurich, Switzerland.
[8] Tmote Sky datasheet, http://www.eecs.harvard.edu/~konrad/projects/shimmer/references/ tmote-sky-datasheet.pdf
[9] M. Mjeku & N.J. Gomes, (2008) “Analysis of the Request to Send / Clear to Send Exchange in WLAN Over Fiber Networks”, Lightwave Technology, Vol. 26, pp 2531-2539.
AUTHOR