Graph Laplacian for spectral clustering and
seeded image segmentation
Graph Laplacian for spectral clustering and seeded
image segmentation
Wallace Correa de Oliveira Casaca
Advisor: Prof. Dr. Luis Gustavo Nonato
Co-Advisor: Prof. Dr. Gabriel Taubin
Doctoral dissertation submitted to the Instituto de
Ciências Matemáticas e de Computação - ICMC-USP,
Ficha catalográfica elaborada pela Biblioteca Prof. Achille Bassi e Seção Técnica de Informática, ICMC/USP,
com os dados fornecidos pelo(a) autor(a)
C334g Casaca, Wallace Graph Laplacian for spectral clustering and seeded image segmentation / Wallace Casaca; orientador Luis Gustavo Nonato; co-orientador Gabriel Taubin. -- São Carlos, 2015.
127 p.
Tese (Doutorado - Programa de Pós-Graduação em Ciências de Computação e Matemática Computacional) Instituto de Ciências Matemáticas e de Computação, Universidade de São Paulo, 2015.
Acknowledgements
Dedico esta tese a todos aqueles que, de alguma forma, contribu´ıram nesta ´ardua jornada desde meu ingresso no curso de doutorado at´e seu t´ermino. De fato, in´umeros desafios foram superados ao longo desta caminhada, os quais necessitaram de empenho, foco, comprome-timento e madrugadas a claro trabalhando no intuito de serem vencidos, entretanto, o maior benef´ıcio alcanc¸ado nesta fase n˜ao foi o produto final gerado - a tese e seus artigos decor-rentes, mas sim toda a experiˆencia vivenciada no decorrer deste percurso. Nesse sentido, tive a oportunidade de ter vivenciado uma prospera “vida acadˆemica” em termos de compartilhar experiˆencias acadˆemicas com alunos e pesquisadores da USP e de promover colaborac¸˜oes bastante frut´ıferas com outros grupos de pesquisadores no exterior, em particular da Brown e do MIT.
Ainda com relac¸˜ao `as experiˆencias de pesquisa vivenciadas deste per´ıodo, ´e importante ressaltar tamb´em que estive cercado de diversos amigos e familiares iluminados que, em etapas decisivas, me incentivaram a continuar mantendo o foco nos objetivos. Nesse sentido, reservo os par´agrafos a seguir para agradecer:
`
A Deus, pela oportunidade concedida de aprender com a matem´atica, com a computac¸˜ao, com as ciˆencias exatas e, principalmente, com as pessoas ao meu redor.
`
A minha querida m˜ae, Neuza, pelo apoio e amor incondicionais manifestados durante todo o desenvolvimento da tese.
`
A minha irm˜a, Aline, e meu cunhado, Cae, pelos momentos de descontrac¸˜ao, incentivo e pelos conselhos sempre bem-vindos.
`
A minha “amorzoquinha”, Marilaine, pela convivˆencia, amor infind´avel e pelo sorriso cont´ınuo que ela sempre consegue estampar no meu rosto, mesmo diante das circunstancias mais adversas.
Aos meus familiares, que me ensinaram que o aspecto humano deve ser valorizado acima de tudo. Em especial, agradec¸o `a minha tia Shirley, ao meu tio Edinho, e `a minha afilhada Dhara.
Aos amigos e tamb´em colaboradores, Marcos Proenc¸a, Erick Gomez-Nieto e Danilo Motta, pela amizade, pelas infinitas madrugadas em claro trabalhando e pelo engajamento na produc¸˜ao cient´ıfica.
Ao amigos, Vin´ıcius Malatesta, Eduardo Almeida, Carol Remondi, Vanessa Maria, K´arida Mateus, Juliana e Rafa EL, por toda a ajuda prestada na ocasi˜ao em que estive no exterior e pela valiosa amizade que l´a foi constru´ıda.
Ao meu orientador, Prof. Luis Gustavo Nonato, o qual tenho como modelo de profis-sional competente e pesquisador comprometido com a pesquisa, al´em de ser uma pessoa extremamente empenhada com a formac¸˜ao de seus orientandos.
Ao Prof. Gabriel Taubin (Brown) e Prof. Ramesh Raskar (MIT), pela confianc¸a, ex-periˆencia acadˆemica e pelas valiosas orientac¸˜oes durante a pesquisa conduzida no exterior.
Aos membros titulares de minha banca, Prof. Marcelo Siqueira (UFRN), Prof. Siome Goldenstein (IC-UNICAMP), Prof. Roberto Marcondes Cesar Junior (IME-USP), Prof. Jo˜ao Batista Neto (ICMC-USP), e tamb´em aos membros suplentes, Prof. Alexandre Falc˜ao (IC-UNICAMP), Prof. Aparecido Nilceu Marana (UNESP), Prof. Odemir Bruno (IFSC-USP),
Prof. Adilson Gonzaga (EESC-USP) e Prof. Afonso Paiva Neto (ICMC-USP), pelas valiosas sugest˜oes e contribuic¸˜oes.
A todos meus amigos de longa data, pela amizade incondicional ao longo dos anos e por me apoiarem principalmente nos momentos mais conturbados do curso.
Aos professores do ICMC, Antonio Castelo Filho e Maria Cristina Ferreira de Oliveira, e do IBILCE-UNESP, Alagacone Sri Ranga, Maur´ılio Boaventura e Cleonice Bracciali que, diretamente, contribu´ıram no enriquecimento de minha formac¸˜ao acadˆemica e intelectual.
Aos amigos de p´os-graduac¸˜ao e do LMACC-USP, pelos momentos de descontrac¸˜ao, estudo e conv´ıvio acadˆemico.
Aos colegas de graduac¸˜ao dos cursos de Bacharelado em Matem´atica Aplicada e Com-putacional, Matem´atica Pura e Licenciatura, pela amizade e apoio. Tamb´em agradec¸o `a minha professora Cl´ecia, pela ajuda e dedicac¸˜ao prestadas.
`
As agˆencias de fomento CAPES, FAPESP e seus acessores, pela oportunidade conce-dida e pelo financiamento durante toda a pesquisa de doutorado e, tamb´em, durante minha estadia no exterior.
Finalmente, finalizo minhas considerac¸˜oes vislumbrando a possibilidade de aprender cada vez mais com o exerc´ıcio da docˆencia e da pesquisa cient´ıfica, as quais me motivam a prosseguir trabalhando cada vez mais com mais afinco.
“I’m a great believer in luck, and I find the harder I work
the more I have of it.”
Abstract
I
mage segmentation is an essential tool to enhance the ability of computer systems to efficiently perform elementary cognitive tasks such as detection, recognition and tracking. In this thesis we concentrate on the investigation of two fundamental topics in the context of image segmentation: spectral clustering and seeded image segmentation. We introduce two new algorithms for those topics that, in summary, rely on Laplacian-based operators, spectral graph theory, and minimization of energy functionals. The effectiveness of both segmentation algorithms is verified by visually evaluating the resulting partitions against state-of-the-art methods as well as through a variety of quantitative measures typi-cally employed as benchmark by the image segmentation community.Our spectral-based segmentation algorithm combines image decomposition, similarity metrics, and spectral graph theory into a concise and powerful framework. An image decom-position is performed to split the input image into texture and cartoon components. Then, an affinity graph is generated and weights are assigned to the edges of the graph according to a gradient-based inner-product function. From the eigenstructure of the affinity graph, the im-age is partitioned through the spectral cut of the underlying graph. Moreover, the imim-age par-titioning can be improved by changing the graph weights by sketching interactively. Visual and numerical evaluation were conducted against representative spectral-based segmentation techniques using boundary and partition quality measures in the well-known BSDS dataset.
Unlike most existing seed-based methods that rely on complex mathematical formula-tions that typically do not guarantee unique solution for the segmentation problem while still being prone to be trapped in local minima, our segmentation approach is mathemati-cally simple to formulate, easy-to-implement, and it guarantees to produce a unique solu-tion. Moreover, the formulation holds an anisotropic behavior, that is, pixels sharing similar attributes are preserved closer to each other while big discontinuities are naturally imposed on the boundary between image regions, thus ensuring better fitting on object boundaries. We show that the proposed approach significantly outperforms competing techniques both quantitatively as well as qualitatively, using the classical “GrabCut” dataset from Microsoft as a benchmark.
While most of this research concentrates on the particular problem of segmenting an image, we also develop two new techniques to address the problem of image inpainting and photo colorization. Both methods couple the developed segmentation tools with other computer vision approaches in order to operate properly.
Keywords: image segmentation, spectral graph theory, seeded image segmentation,
opti-mization techniques, laplacian operator, image inpainting, image colorization, computer vi-sion applications
Resumo
S
egmentar uma image ´e visto nos dias de hoje como uma prerrogativa para melho-rar a capacidade de sistemas de computador para realizar tarefas complexas de na-tureza cognitiva tais como detecc¸˜ao de objetos, reconhecimento de padr˜oes e monitoramento de alvos. Esta pesquisa de doutorado visa estudar dois temas de fundamental importˆancia no contexto de segmentac¸˜ao de imagens: clusterizac¸˜ao espectral e segmentac¸˜ao interativa de imagens. Foram propostos dois novos algoritmos de segmentac¸˜ao dentro das linhas suprac-itadas, os quais se baseiam em operadores do Laplaciano, teoria espectral de grafos e na minimizac¸˜ao de funcionais de energia. A efic´acia de ambos os algoritmos pode ser con-statada atrav´es de avaliac¸˜oes visuais das segmentac¸˜oes originadas, como tamb´em atrav´es de medidas quantitativas computadas com base nos resultados obtidos por t´ecnicas do estado-da-arte em segmentac¸˜ao de imagens.Nosso primeiro algoritmo de segmentac¸˜ao, o qual ´e baseado na teoria espectral de grafos, combina t´ecnicas de decomposic¸˜ao de imagens e medidas de similaridade em grafos em uma ´unica e robusta ferramenta computacional. Primeiramente, um m´etodo de decomposic¸˜ao de imagens ´e aplicado para dividir a imagem alvo em duas componentes: textura e cartoon. Em seguida, um grafo de afinidade ´e gerado e pesos s˜ao atribu´ıdos `as suas arestas de acordo com uma func¸˜ao escalar proveniente de um operador de produto interno. Com base no grafo de afinidade, a imagem ´e ent˜ao subdividida por meio do processo de corte espectral.
Al´em disso, o resultado da segmentac¸˜ao pode ser refinado de forma interativa, mudando-se, desta forma, os pesos do grafo base. Experimentos visuais e num´ericos foram conduzidos tomando-se por base m´etodos representativos do estado-da-arte e a cl´assica base de dados BSDS a fim de averiguar a eficiˆencia da metodologia proposta.
Ao contr´ario de grande parte dos m´etodos existentes de segmentac¸˜ao interativa, os quais s˜ao modelados por formulac¸˜oes matem´aticas complexas que normalmente n˜ao garantem soluc¸˜ao ´unica para o problema de segmentac¸˜ao, nossa segunda metodologia aqui proposta ´e matematicamente simples de ser interpretada, f´acil de implementar e ainda garante unici-dade de soluc¸˜ao. Al´em disso, o m´etodo proposto possui um comportamento anisotr´opico, ou seja, pixels semelhantes s˜ao preservados mais pr´oximos uns dos outros enquanto descon-tinuidades bruscas s˜ao impostas entre regi˜oes da imagem onde as bordas s˜ao mais salientes. Como no caso anterior, foram realizadas diversas avaliac¸˜oes qualitativas e quantitativas en-volvendo nossa t´ecnica e m´etodos do estado-da-arte, tomando-se como referˆencia a base de dados “GrabCut” da Microsoft.
Enquanto a maior parte desta pesquisa de doutorado concentra-se no problema espec´ıfico de segmentar imagens, como conte´udo complementar de pesquisa foram propostas duas no-vas t´ecnicas para tratar o problema de retoque digital e colorizac¸˜ao de imagens.
Keywords: segmentac¸˜ao de imagens, teoria espectral de grafos, segmentac¸˜ao interativa de
imagens, t´ecnicas de otimizac¸˜ao, operador laplaciano, retoque digital, colorizac¸˜ao de ima-gens, aplicac¸˜oes em vis˜ao computacional.
Contents
Abstract . . . vii
Resumo . . . ix
Summary . . . xi
List of Figures . . . xv
List of Tables . . . xxiii
1 Introduction 1 1.1 Contributions . . . 3
1.2 Scientific Dissemination and Awards . . . 6
1.3 Thesis Outline . . . 9
CONTENTS CONTENTS
2 Graph Laplacian: Review and Fundamental Concepts 11
2.1 The Discrete Laplacian Operator . . . 12
2.2 Laplacian Operator and Spectral Segmentation . . . 14
2.3 Graph Laplacian-based Energy Functionals . . . 17
3 Spectral Image Segmentation 23
3.1 Spectral Image Segmentation Methods . . . 23
3.1.1 Normalized Cut Segmentation . . . 25
3.1.2 Multiscale-based Segmentation . . . 27
3.2 Spectral Image Segmentation via Cartoon-Texture Decomposition and Inner
Product-based Metric . . . 28
3.2.1 Pipeline Overview . . . 30
3.2.2 Results, Comparisons and Evaluation . . . 40
3.2.3 Discussion and Limitations . . . 49
4 Seeded Image Segmentation 51
4.1 Seed-based Image Segmentation Methods . . . 51
4.1.1 Graph Cut-based Approach. . . 54
4.1.2 Random Walker-based Approach . . . 57
4.1.3 Watersheds/Maximum Spanning Forest . . . 58
CONTENTS CONTENTS
4.1.4 Shortest Path Forest . . . 59
4.2 Laplacian Coordinates for Image Segmentation . . . 60
4.2.1 Minimizing the Laplacian Coordinates Energy Functional on Graphs 63
4.2.2 Results, Comparisons and Evaluation . . . 74
4.2.3 Discussion and Limitations . . . 81
5 Laplacian Coordinates as an Effective Tool for Computer Vision Applications 83
5.1 User-Friendly Interactive Image Inpainting with Laplacian Coordinates . . 84
5.1.1 Pipeline Overview . . . 86
5.1.2 User-steered Selection of the Inpainting Domain . . . 87
5.1.3 Filling Order Assignment . . . 87
5.1.4 Dynamic Processing of the Sampling Region . . . 90
5.1.5 Block-based pixel replication . . . 91
5.1.6 Experimental Results and Comparisons . . . 93
5.2 Interactive Image Colorization using Laplacian Coordinates. . . 99
5.2.1 Pipeline Overview . . . 101
5.2.2 Prior Segmentation . . . 101
5.2.3 Color Assignment . . . 101
5.2.4 Interactive Manipulation of the Colorization Result . . . 103
5.2.5 Results and Comparisons . . . 104
CONTENTS CONTENTS
6 Conclusion 107
References 127
List of Figures
1.1 Some results obtained during the PhD research period. . . 4
1.2 Dissemination of the technologies originated during the PhD to the wider
public. . . 7
1.3 Some visual results obtained by the awarded papers.. . . 8
2.1 A trivial connected graph with five vertices and its combinatorial Laplacian
matrixK. . . 15
2.2 The partitioning of the graph from Fig. 2.1 using the signs (“zero-set”
cri-terium) of the Fiedler vector (second column) taken from the matrix of
eigen-vectorsV. . . 16
2.3 Simple illustrative graph with six vertices. . . 16
2.4 Graph partition obtained by the Fiedler vector. . . 16
2.5 Graph partition obtained by the 3rd order eigenvector. . . 16
LIST OF FIGURES LIST OF FIGURES
2.6 Graph partition obtained by the 4th order eigenvector. . . 16
2.7 Graph partition obtained by the 5th order eigenvector. . . 17
2.8 Graph partition obtained by the 6th order eigenvector. . . 17
3.1 (a) Original image, (b) ground truth, (c) the result obtained by the NCut
technique [Shi and Malik, 2000] and (d) NCut multiscale [Cour et al., 2005]. 25
3.2 Optimal cut (in green) obtained by NCut algorithm for a trivial connected
graph. . . 27
3.3 First row: from the left to right, the ground truth image and the result
ob-tained with our method without user intervention. Second row: illustrates
the user interaction (green scribes) to improve the segmentation. . . 30
3.4 Pipeline of the proposed image segmentation framework. . . 31
3.5 Image decomposition into a cartoon and texture component. . . 32
3.6 Fine-to-coarse step illustration obtained from [Shuai et al., 2007]. . . 33
3.7 Geometric interpretation of the inner product-based metric. Maximum weights
occur when the gradient and the direction defined from the graph edge point
to the same direction (a). Moderate weight is highlighted in (b) and the third
case, where opposite directions (c) produce minimum weights (zero). . . . 35
3.8 Spectral cut pipeline to partition the image from the zero-set of the Fiedler
vector. . . 36
3.9 Hierarchical segmentation by recursively computing the spectral
decompo-sition for multiple parts of the image. . . 36
3.10 Automatic result with the proposed framework. . . 37
LIST OF FIGURES LIST OF FIGURES
3.11 Improving segmentation of the noise-textured image from user’s strokes. . . 39
3.12 A simple stroke (greenish region between the two owls) is sufficient to
im-prove the segmentation. . . 39
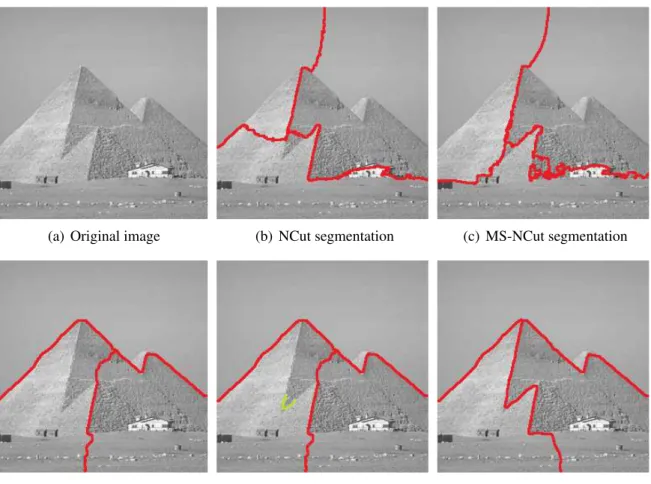
3.13 The influence of the user intervention in comparison with static approaches. 41
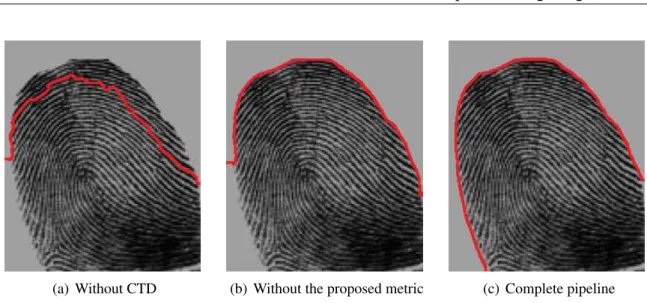
3.14 The result of applying NCut, MS-NCut, and the proposed approach (in
au-tomatic mode) in a fingerprint image.. . . 42
3.15 Our approach (in automatic mode) produces smoother segmentation curves
when compared to NCut and MS-NCut. . . 42
3.16 Quantitative comparison for the recall, precision and the f-score
segmenta-tion measures. For all images, we compute the average of the recall and
precision quantities forR= 8,9,10,11and12[Estrada and Jepson, 2009]. 45
3.17 From left to right: The input image, the segmentations resulting from NCut,
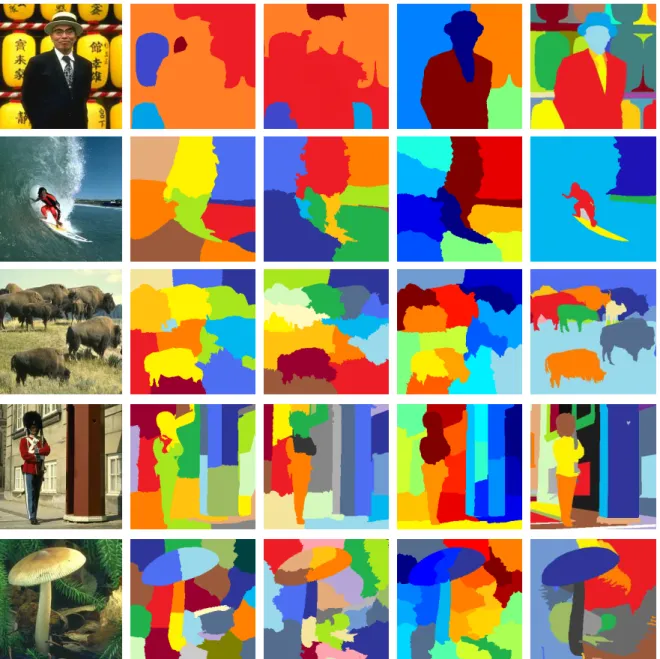
MS-NCut, our approach and the human-drawn ground-truth. . . 46
3.18 From left to right: The input image, the segmentations resulting from NCut,
MS-NCut, our approach and the human-drawn ground-truth. . . 47
3.19 Segmentation driven by user produced by our technique (top row),
RWS-EP (middle row) and RWS-RWS-EPP (bottom row). Fig. 3.19(a) is required by
our approach, while the target image and the initial setup with 2000 seeds
(blue and green pieces) must be provided by the user in random walker-based
methods (Figs. 3.19(e) and 3.19(i)) . . . 48
4.1 Segmentations taking as input the seeded image (a). (b) Depicts the ground
truth, (c) the result obtained by the Graph-Cut technique [Boykov and
Funka-Lea, 2006], (d) Power Watershed [Couprie et al., 2011], (e) Geodesic-based [Anh
et al., 2012] and (f) Random Walker [Grady, 2006]. . . 54
LIST OF FIGURES LIST OF FIGURES
4.2 Application of the binary graph cut model for a very simple connected graph.
(a) Shows the input graph where the seeded links (in red) are managed by
the term Di in Eq. (4.2) and the quantityVi,j manages the connections (in
black) between graph nodes. (b) Shows the partitioning into two disjunct sets. 55
4.3 Segmentation from a user-provided box proposed in [Rother et al., 2004].
(a) Presents in red the selection performed by the user and (b) shows the
segmentation result. . . 56
4.4 Interpretation of the Random Walker approach in terms of probability of a
random walkerPreaching a seeded point (ForB). . . 58
4.5 (a)-(b) Segmentations obtained by the Livewire-based approach (extracted
from the paper [Hamarneh et al., 2005]). . . 60
4.6 Segmentations produced by the Laplacian Coordinates approach, where red
and green scribes indicate the seedings. . . 62
4.7 Geometric interpretation of the differential operator δi at vertex i = 5. It
measures the deviation betweenx5 and its center of mass d15
P
j∈N(5)wijxj. 66
4.8 Comparison between the solution obtained from Laplacian Coordinates and
the classical Random Walker algorithm under the same initial conditions.
Line graphs are shown in the top row with seeded vertices in yellow and
purple while the corresponding edge weights are shown in the second row.
The solution with and without the mentioned weights are given in the third
and fourth rows. . . 68
4.9 Random Walker and Laplacian Coordinates image boundary fitting
capabil-ity. (First and Third rows) Seeded images and the segmentation results
ob-tained from Random Walker and Laplacian Coordinates, respectively, and
(Second and Fourth rows) Graphs of the solution associated to First and
Third rows, respectively. . . 70
LIST OF FIGURES LIST OF FIGURES
4.10 Geometric sketch showing the solution xi (i = 7) in terms of its
neighbor-hood pixels. In the example, the purple circle illustrates the points used for
calculating the differential coordinateδiat pixeli= 11. . . 71
4.11 Selecting different objects from the image by exploiting the seed sensitivity
of the Laplacian Coordinates. First row: multiple selections are given as
input to the method and Second row: the corresponding segmentations. . . 72
4.12 Extension of the Laplacian Coordinates (4.9) for multiple segmentation. First
row: multiple seeds are sketched as colored strokes, from which Laplacian
Coordinates produced the multiple segmented regions. Middle and bottom
row: sketched seeds, the final segmentation and the six solution vectorsx(j)
that give rise to the multiple segmentation. . . 73
4.13 The ”Grabcut“ dataset benchmark. (a) Depicts the original image, (b) the
input tri-map seeds, (c) the ground truth and (d) the unsegmented region. . . 74
4.14 Comparison of six seed-based segmentation methods regarding to RI and
GCE quality metrics. In both cases, the proposed Laplacian Coordinates
framework has presented better results then all other five evaluated techniques. 77
4.15 Comparison of six seed-based segmentation methods regarding to VoI and
BDE quality metrics. In general, Laplacian Coordinates outperforms all
other methods.. . . 78
4.16 F-score quality metric. Laplacian Coordinates is considerably better than
other methods when parameterRincreases. . . 78
4.17 From left to right: Ground-truth, the tri-map images (seeds and the unknown
region) provided by the Grabcut dataset, the segmentations resulting from
GC, MSFK, MSKP and LC approach. . . 79
LIST OF FIGURES LIST OF FIGURES
4.18 From left to right: Ground-truth, the tri-map images (seeds and the unknown
region) provided by the Grabcut dataset, and segmentations resulting from
PWS, RW and LC approach. . . 80
5.1 Image inpainting and colorization using the proposed frameworks. . . 84
5.2 Pipeline of our interactive inpainting framework. . . 86
5.3 Illustration of our interactive image inpainting framework. . . 87
5.4 Representation of the gradient field in an illustrative image. . . 88
5.5 Illustration of the priority filling order mechanism (Equation (5.2)).. . . 90
5.6 The use of the dynamic sampling scheme to deal with huge photography for
a given processing time . . . 91
5.7 Illustrative sketch of the dynamic sampling and the completion process. (a)
ΛΩp (gray and blue parts) is the region insideHL(p)(green square) which
provides candidate pixels. (b) Comparison between content of patchesHn(p)
and Hn(bq) (optimal patch) and (c) result after copying the information of
interest. . . 92
5.8 Comparison with existing inpainting methods. [Efros and Leung, 1999]
(pure texture synthesis), [Bertalm´ıo et al., 2003] (cartoon/texture inpainting)
and [Criminisi et al., 2004] (exemplar-based inpainting). . . 95
5.9 Comparison with existing inpainting methods. [Cao et al., 2011] (
skeleton-guided inpainting) and [Kawai et al., 2009] (optimization-based inpainting).
. . . 96
LIST OF FIGURES LIST OF FIGURES
5.10 Comparison with sparse representation-based inpainting. (a) Input images
(with missing block in black), (b) inpainted by Guleryuz [2006], (c)-(d)
in-painted by Elad et al. [2005] and Fadili et al. [2009], (e) inin-painted by Xu
and Sun [2010], (f) inpainted by Li [2011], (g) inpainted by our method,
respectively from top to down and (h) the ground-truth images. . . 98
5.11 Pipeline of the proposed colorization framework. . . 101
5.12 Illustration of our interactive image colorization framework. . . 102
5.13 The use of our colorization framework when allowing for user intervention. 103
5.14 Comparison between our framework and Casaca et al. [2012b] technique. . 105
5.15 Comparison between our framework and Levin et al. [2004] technique.. . . 105
5.16 Comparison between our framework against Levin et al. [2004], Yao et al.
[2011], Yatziv and Sapiro [2006] methods. . . 106
List of Tables
3.1 Comparative timing table (in seconds) with respect to experiment involving
user autonomy (Fig. 3.19, image dimension: 256 ×256). The timing+4
means the time taken for the inclusion of seeds. . . 49
4.1 Variation of the parameters p and q in Equation (4.1) versus classical
seg-mentation algorithms [Couprie et al., 2011]. . . 53
5.1 Quantitative evaluation using PSNR (in dB) for all comparative images from
Figure 5.10. . . 98
C
HAPTER
1
Introduction
The use of the Laplacian operator has been extensively exploited in a variety of scientific applications where smoothness of the resulting data is a characteristic of paramount impor-tance. The mathematical community, for instance, employs the Laplacian operator when investigating fluid dynamics, graph theory and spectral analysis of signals. The Laplacian operator also appears as an indispensable tool in the context of image segmentation, pat-tern recognitionandclustering. Indeed, Laplacian-based mechanisms have turned out quite effective for processing information, assisting a great deal of sophisticated applications, spe-cially those that rely on image segmentation as an intermediate step to high-level tasks and computer vision systems such as object recognition and tracking.
In fact, the capability of handling images as graphs [Diaz et al., 2002, Tolliver and Miller,2006] rendered Laplacian operators an effective and flexible segmentation procedure, as different choices can be made towards defining the connectivity of pixels as well as edge weights of the graph. Such pliability as to graph construction and edge weighting can be
2
successfully combined with the human capability of distinguishing patterns, structures and shapes, making Laplacian-based methods even more versatile.
Inspired mainly by visual human skill and the solid mathematical foundation of graph theory [Bollob´as, 1998, Spielman, 2007], semi-supervised image segmentation techniques have become a trend, allowing users to interact with images in order to properly settle the Laplacian operator and further improve the segmentation. The user-assisted mechanism of-ten defines the Laplacian operator in a similarity/affinity graph matrix which encodes image information such as colors, textures, gradients and other inherent image patters. Moreover, it involves a cost function defined on the graph [Boykov and Funka-Lea,2006,Casaca et al.,
2014b, Cousty et al., 2009b, Grady, 2006] or solving a spectral-cut problem [Casaca et al.,
2013b, Maji et al., 2011, Shi and Malik, 2000, Taylor, 2013]. However, as pointed out in [Peng et al.,2013,Vicente et al.,2008,Yi and Moon,2012], existing partitioning techniques are circumstantially prone to fail in many pragmatic situations. For instance, common draw-backs not tackled by state-of-the-art algorithms are:
1. The resulting segmentation generally exhibits low adherence on the contours of the image regions, failing to capture fine details or, in many cases, producing a low quality segmentation output.
2. Make use of sophisticated optimization tools to be effective, impacting negatively on the computational cost, implementation and portability of the code.
3. Demand great computational effort, specially for processing high resolution images, such those obtained nowadays by mobile devices, thus undermining user interactivity.
4. They are highly sensitive to the adjustment of the edge weights in the graph.
This thesis focus on the use of Laplacian operator for the task of image segmentation and also to support general computer vision applications such asimage inpainting[Bertalm´ıo et al.,2003, Casaca et al.,2014a, Xu and Sun, 2010] andimage colorization[Casaca et al.,
3 1. Introduction
spectral cutsandsegmentation from energy functional minimization, in an effort to address the issues raised above. Moreover, we overview the Laplacian operator in the context of graph theory, spectral analysis and energy optimization on graphs. As a result, the notion of the Laplacian operator can be understood from different perspectives enabling a compre-hensive practical and theoretical review about its use in the field of image segmentation and image enhancement.
1.1
Contributions
The main contribution of this thesis are two new computer-assisted image partitioning techniques, one addressing the particular topic of spectral segmentation and, another focused on seeded image segmentation. The technique derived from spectral clustering family (re-ported in Chapter3) combines image decomposition, similarity metrics, and spectral graph theory into a unified and powerful framework. The proposed algorithm holds attractive prop-erties such as awareness of noise and texture data, accuracy in detecting image edges, low computational cost when performing the spectral decomposition and it enables human inter-vention. The novel seed-based segmentation method, described in Chapter4, was designated to propagate a scalar field throughout the image graph so that pixels sharing similar attributes are kept closer to each other in terms of the assigned scalars while big jumps take place the boundary between distinct regions of the image. Furthermore, the algorithm is mathemati-cally simple, easy-to-code, and guaranteed to produce a unique solution. The effectiveness of both techniques are assessed by comparisons with state-of-the-art methods using a variety of measures and datasets typically employed as benchmark by the community of computer vision.
1.1. Contributions 4
5 1. Introduction
The list below provides a summary of the main publications originated during the de-velopment of this thesis:
Publications Directly Related to the Thesis
• [Casaca et al., 2011b] Casaca, W., Paiva, A., Nonato, L.G., Spectral Segmentation using Cartoon-Texture Decomposition and Inner Product-based Metric, 24th Confer-ence on Graphics, Patterns and Images (SIBGRAPI’2011), IEEE Computer Society,
pp. 266-273, 2011.
• [Casaca et al., 2012b] Casaca, W., Gomez-Nieto, E., Ferreira, C. de O., Tavares, G., Pagliosa, P., Paulovich, F., Nonato, L.G., Paiva, A., Colorization by Multidimensional Projection, 25th Conference on Graphics, Patterns and Images (SIBGRAPI’2012), IEEE Computer Society, pp. 32-38, 2012.
• [Casaca et al.,2013b] Casaca, W., Paiva, A., Gomez-Nieto, E., Joia, P., Nonato, L.G., Spectral Image Segmentation using Image Decomposition and Inner Product-based Metric, Journal of Mathematical Imaging and Vision (JMIV), Springer US, Volume 45(3), pp. 227-238, 2013.
• [Casaca et al.,2014a] Casaca, W., Almeida, M.P., Boaventura, M., Nonato, L.G., Com-bining Anisotropic Diffusion, Transport Equation and Texture Synthesis for Inpainting Textured Images,Pattern Recognition Letters (PRL), Volume 36, pp. 36-45, 2014.
• [Casaca et al., 2014b] Casaca, W., Nonato, L.G., Taubin, G., Laplacian Coordinates for Seeded Image Segmentation, IEEE Conference on Computer Vision and Pattern Recognition (CVPR), IEEE Computer Society, pp. 384-391, 2014.
Other Publications
1.2. Scientific Dissemination and Awards 6
• [Joia et al.,2012] Joia, P., Gomez-Nieto, E., Batista Neto, J., Casaca, W., Botelho, G., Paiva, A., Nonato, L.G., Class-specific Metrics for Multidimensional Data Projection applied to CBIR, The Visual Computer (TVC), Springer Berlin, Volume 28(10), pp. 1027-1037, 2012.
• [Casaca et al., 2013a] Casaca, W., Almeida, M.P., Boaventura, M., Denoising Tex-tured Images via Regularized Anisotropic Diffusion,Chapter Book: An Introductory Guide to the Emerging Areas of Digital Image Processing(available at amazom.com), editors: Akshaya Mishra, Zafir Nawaz, Zafir Shahid, 1st Edition, iConcept Press (Aus-tralia), pp. 48-71, 2013.
• [Gomez-Nieto et al., 2013] Gomez-Nieto, E., Casaca, W., Nonato, L.G., Taubin, G., Mixed Integer Optimization for Layout Arrangement, 26th Conference on Graphics, Patterns and Images (SIBGRAPI’2013), IEEE Computer Society, pp. 115-122, 2013.
• [Gomez-Nieto et al., 2014] Gomez-Nieto, E., Roman, F.S., Pagliosa, P., Casaca, W., Helou, E.S., Oliveira, M.C.F., Nonato, L.G., Similarity Preserving Snippet-Based Vi-sualization of Web Search Results,IEEE Transactions on Visualization and Computer Graphics (TVCG), IEEE Computer Society, Volume 20(3), pp. 457-470, 2014.
• [Casaca et al., 2015] Casaca, W., Gomez-Nieto, E., Motta, D., Hartmann, I., Taubin, G., Nonato, L.G., Dealing with Multiple Requirements in Geometric Arrangements, IEEE Transactions on Visualization and Computer Graphics (TVCG), 13 pgs, IEEE
Computer Society, 2015 (accepted for publication).
1.2
Scientific Dissemination and Awards
7 1. Introduction
Figure 1.2: Dissemination of the technologies originated during the PhD to the wider public.
• News published onwww.usp.br
Title: “Pesquisadores do ICMC recebem prˆemio internacional em computac¸˜ao gr´afica” Link on web: www.icmc.usp.br/e/53ddb
• Report published onwww.usp.br
Title: “ICMC desenvolve ferramenta inovadora para segmentac¸˜ao de imagens” Link on web: www.icmc.usp.br/e/f37b3
• Report published onwww.dci.com.br
Title: “Pesquisadores desenvolvem nova ferramenta para imagem” Link on web: www.icmc.usp.br/e/0ebf1
• Special TV report broadcasted onTV Rede Globo
Title: “Programa criado pela USP S˜ao Carlos remove pessoas de foto de forma f´acil” Link on web: www.icmc.usp.br/e/49c86
• TV report broadcasted onTV Educativa de S˜ao Carlos
1.2. Scientific Dissemination and Awards 8
Figure 1.3: Some visual results obtained by the awarded papers.
The following works have been awarded “Best Paper” or selected for “Honorable Men-tion” during the doctoral period (see Figure1.3for an illustration).
• Best Paper Award in Image Processing and Computer Vision at SIBGRAPI’2011:
9 1. Introduction
• Best Paper AwardinGraphics and Visualizationat SIBGRAPI’2013: Mixed Integer
Optimization for Layout Arrangement, 26th Conference on Graphics, Patterns and Images, IEEE Computer Society, pp. 266-273, 2011.
• Honorable MentioninPoster/Demo Sectionat ICCP’2013: Image Colorization based
on Multidimensional Projection, 5th IEEE Conference on Computational Photography, IEEE Computer Society, 2013.
1.3
Thesis Outline
This thesis is structured in six chapters as summarized below:
Chapter 2 [Graph Laplacian: Review and Fundamental Concepts]: covers the studies
about Laplacian operator on graphs and its use in image segmentation and graph clustering.
Chapter 3 [Spectral Image Segmentation]: presents the proposed algorithm for spectral
image segmentation and clustering analysis. A review about the topic as well as a full eval-uation against competing methods are also provided.
Chapter 4 [Seeded Image Segmentation]: describes the proposed technique designated to
segment images by minimizing a novel functional of energy. Existing seed-based segmenta-tion methods were also revisited and compared against our methodology.
Chapter 5 [Laplacian Coordinates as an Effective Tool for Computer Vision
Applica-tions]: introduces two novel frameworks that tackle the problem of image inpainting and
photo colorization. Comparison with representative state-of-the-art methods are also pro-vided.
C
HAPTER
2
Graph Laplacian: Review and
Fundamental Concepts
The Laplacian operator has appeared in a multitude of theoretical and applied scenarios leveraging new technologies and improving the effectiveness of existing ones. The possi-bility of defining the Laplacian operator on graphs has attracted great amount of research in important scientific fields such asgraph theory[Diaz et al., 2002, Mohar, 1997], computer vision[Casaca et al., 2011b, Milyaev and Barinova, 2013], computer graphics [Petronetto et al.,2013,Zhang et al.,2007] anddata exploration and visualization[Gomez-Nieto et al.,
2013, 2014]. In particular, the Laplacian operator plays an important role in clustering graphs, specially due to its good mathematical properties and its capability in promoting visual analysis.
In this chapter, we focus particularly on the use of graph Laplacian for graph cluster-ing problems. From the graph Laplacian, one can obtain important information about the
2.1. The Discrete Laplacian Operator 12
topology and geometry of the graph, which allow to perform partitions by simply process-ing spectral content. In order to clarify those aspects and better contextualize our work, we review key concepts aboutdiscrete Laplacian operator,Laplacian operator for spectral segmentationandgraph Laplacian-based energy functionals.
2.1
The Discrete Laplacian Operator
LetG= (V, E, WE)be a undirected graph. There are many ways to define the discrete
Laplacian operator, which varies mainly in terms of its numerical applicability as well as the branch of mathematics under study [Godsil and Royle, 2001, Merris, 1994, Wardetzky et al.,2007,Zhang,2004]. In this work, the general Laplacian operator is locally formulated through the weighted average of a discrete functionf = (fi)defined at vertexi∈V, that is,
(Lf)i = (bi)−1
X
j∈N(i)
wij(fi−fj), (2.1)
wherewij represents the weight assigned to the edge(i, j)∈E,bi is a tuning parameter and
N(i) indicates the set of vertices connected to i. Operator (2.1) is a first order Laplacian since it covers only first order neighbors. Furthermore, Laplacian operator (2.1) can be rewritten in terms of the following matrix factorization:
L=B−1S, (2.2)
whereB−1is a diagonal matrix built from the coefficients(bi)−1andSis a symmetric matrix
with entries given by:
Sij =
−wij, if eij ∈E
P
k∈N(i)
wik, if i=j
0, otherwise
13 2. Graph Laplacian: Review and Fundamental Concepts
A fully symmetry matrix L can be obtained by using the auxiliary symmetric matrix
Lsym=B−1/2SB−1/2as follows:
L=B−1S=B−1/2B−1/2SB−1/2B1/2 =B−1/2LsymB1/2. (2.4)
Equation (2.4) ensures thatL andLsym have the same eigenvalues which are all
non-complex numbers. Moreover, this decomposition states thatvi is an eigenvector of Lsym
andλi is its corresponding eigenvalue, iff the eigenvector ofLthat matches λi is given by
ui =B−1/2vi.
The eigenvectors ofLsymin Equation (2.4) are orthogonal, which may not be true for
the Laplacian matrixL, however, one can make the eigenvectors ofLorthogonal using the biased inner product:
<ui,uj>B=uiTBuj =viTvj =δij, (2.5)
beingLpositive semi-definite ifwij ≥0. In other words:
<f,Lf>B=fTB(B−1S)f =fTSf =
1 2
n
X
i,j=1
wij(fi−fj)2 ≥0. (2.6)
The Laplacian operator (2.1) holds other attractive properties such as the zero-sum prop-erty which ensures that the sum of entries in each row/column is equal to zero. Indeed, taking
f as a constant vector (all its entries are formed by a unique real number), one realizes that
2.2. Laplacian Operator and Spectral Segmentation 14
2.2
Laplacian Operator and Spectral Segmentation
In this section we describe how to easily generate partitions in a graph by exploiting spectral properties of the Laplacian operator.
The combinatorial graph Laplacian, denoted by K = K(G), is the matrix built as follows:
Kij =
−1, if eij ∈E
di, if i=j
0, otherwise
, (2.7)
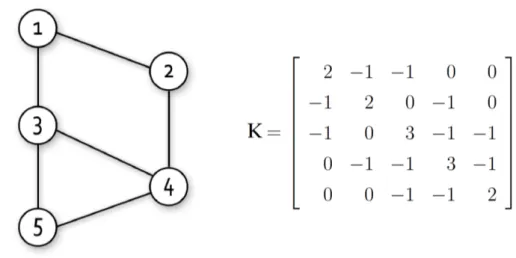
wheredi = #N(i)(the valency of vertexi). Figure2.1depicts a simple graph and its
combi-natorial Laplacian matrixK. Matrix (2.7) establishes a relationship between the spectra and the topology of the graph [Diaz et al., 2002]. Notice that expression (2.7) can be generated by taking b−i 1 = 1and wij = 1in the general Laplacian operator (2.2). Indeed, if weights
wij are set to the graph edgeseij, then the so-calledgraph LaplacianLassumes the form of
Matrix (2.3), that is:
L=S. (2.8)
Matrix (2.8) accounts for the similarity between the nodes of the graph, since it embeds into its structure the edge weights wij. By employing the graph LaplacianL, one can
parti-tion the set of nodesV into disjoint setsV1, V2, ..., Vnso that the similarity among nodes inVi
is high and similarity acrossViandVj is low. In fact, a typical procedure to partition a graph
15 2. Graph Laplacian: Review and Fundamental Concepts
Figure 2.1: A trivial connected graph with five vertices and its combinatorial Laplacian matrixK.
Lx=λx, (2.9)
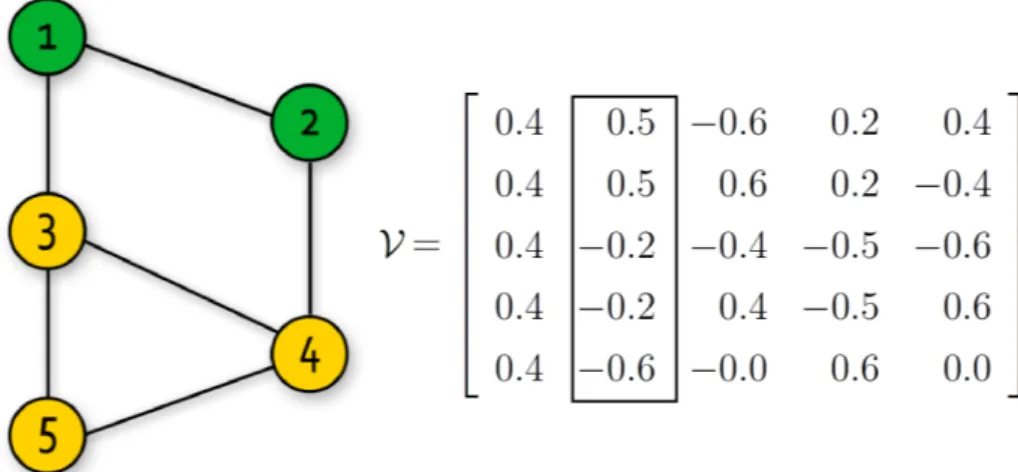
is given by non-negative real eigenvalues with respective real eigenvectors. According to Courant Nodal Domain Theorem[Biyikoglu et al.,2007], the “zero-set” of the Fiedler vec-tor splits the graphGinto two disjoint graphs, thus the recursive computation of the Fiedler vector partitions the graph hierarchically as a binary tree. Figure 2.2 shows an illustrative example of the Fiedler vector and the provided partitioning. This strategy has been suc-cessfully used in several approaches to cluster graphs as [Jameson et al., 2008, Sarkar and Soundararajan, 2000, Soundararajan and Sarkar, 2001] (Average Cut) and [Shi and Malik,
2000, Taylor, 2013] (Normalized Spectral Cut). Similarly to the traditional Fiedler vector, other eigenvectors can be also employed to clustering the graph as shown in the trivial ex-ample in Figs.2.4-2.8.
2.2. Laplacian Operator and Spectral Segmentation 16
Figure 2.2: The partitioning of the graph from Fig.2.1using the signs (“zero-set” criterium) of the Fiedler vector (second column) taken from the matrix of eigenvectorsV.
Figure 2.3: Simple illustrative graph with six vertices.
Figure 2.4: Graph partition obtained by the Fiedler vector.
Figure 2.5: Graph partition obtained by the 3rd order eigenvector.
17 2. Graph Laplacian: Review and Fundamental Concepts
Figure 2.7: Graph partition obtained by the 5th order eigenvector.
Figure 2.8: Graph partition obtained by the 6th order eigenvector.
typically demand intricate post-processing steps when segmenting images, since boundaries are not captured accurately.
2.3
Graph Laplacian-based Energy Functionals
Graph clustering problems are usually modeled in terms of discrete formulations: their solutions are partitions of a finite set, the set of graph vertices. However, methods that rely on minimization of energy functionals face this problem by employing continuous tools, in-stead. This is a trend observed in many complex discrete problems in recent years, specially those in the field of computer sciences.
In this spirit, energy minimization-based approaches have been proposed in a variety of practical scenarios. For instance, the computer graphics community has combined graph Laplacian energy functional minimization and concepts of riemannian manifolds to perform mesh partitioning and geometry processing [Chartrand et al.,2014,Liu et al.,2007]. In fact,
Mohar [1997] has proved that the Laplacian matrix (2.8) can be interpreted as a discrete version of the Laplace-Beltrami operator defined on a riemannian manifold.
2.3. Graph Laplacian-based Energy Functionals 18
and Malik[2000] is a good example of technique that relies on the minimization of a graph energy functional to proceed with the segmentation. Their energy cost function is built in terms of the classical minimum-cut measure:
cut(A, B) = X
i∈A,j∈B
wij, (2.10)
where A and B are disjoint partitions of the set of vertices V. Minimizing the cut(A, B) will give a partition with the maximum disassociation w.r.t. edge weights. The partitioning provided by Equation (2.10) is not unique and the minimum cuts of the graph can be com-puted in polinomial time, as pointed out in [Nagamochi et al.,1997]. Despite its simplicity, the Minimum-Cut (2.10) will often choose a cut with one small cluster, thus constraining it for a reduced number of applications [Shi and Malik,2000].
To avoid the “small cluster” bias,Shi and Malik [2000] have proposed to minimize the normalized version of Equation (2.10), that is:
N Cut(A, B) = cut(A, B) vol(A) +
cut(A, B)
vol(B) , (2.11)
wherevol(A) = Pi∈A,j∈V wij. LettingDbe a diagonal matrix such thatDii=Pk∈N(i)wik.
Equation (2.11) can be algebraically rearranged as follows:
N Cut(A, B) = y
tLy
ytDyt, (2.12)
subject to ytD1 = 0andy ∈ X = {(y1, y2, ... , yn)| yi ∈ {a, b}, a, b ∈ R∗, ytD1 = 0}.
The hard constraintytD1= 0is imposed to get rid of the denominator in the cost function,
19 2. Graph Laplacian: Review and Fundamental Concepts
yi =
a, if vi ∈A
b, if vi 6∈A
, (2.13)
whereaandbare real numbers,a 6=b. So, from Equations (2.12) and (2.13), we have that
N Cut(A, B) = y
tLy
ytDyt,
if and only if
aα+b(d−α) = 0,
with d = 1tD1and α = vol(A). On the other hand, one may easily note that ytD1 = aα+b(d−α) = 0. Moreover, ifaandbare nonzero scalars,aα+b(d−α) = 0results in
b =− α
(d−α)α .
Computing the NCut Energy (2.12) so that Equation (2.13) is held is a NP-Complete problem, so an approximation is needed [Shi and Malik, 2000]. To overcome this problem, [Shi and Malik,2000] make use of the Courant-Fischer Formula, which states the following:
Theorem 1. LetQbe an×nsymmetric matrix with eigenvalues
λn ≥ . . . ≥λ2 ≥λ1 ≥0.
If {u1,u2, . . . ,un} is an orthogonal basis of eigenvectors for Q, where ui is the unitary
eigenvector associated toλi, then:
λ1 = min
x6=0
xtQx
xtx
and
λi = min
x6=0,x∈{u1,...,ui−1}⊥
xtQx
xtx ,
2.3. Graph Laplacian-based Energy Functionals 20
By using the Theorem (1) while relaxing Equation (2.12) to take real numbers, one may writex=D12y⇐⇒y=D−
1
2xso that
ytDy= 1⇐⇒xtx= 1,
ytD1= 0 ⇐⇒xtD121= 0,
ytLy⇐⇒xtD−12LD−
1 2x.
Finally, Equation (2.12) is simplified to the following quadratic energy function:
E(x) =xT |D−1/2{zLD−1/}2
Ln
x, (2.14)
subject to the orthogonal penalty x ⊥ D1/21, being as the approximation of the minimal solution the Fiedler vector from the following generalized eigenvector problem:
Lx=λDx. (2.15)
Similar to the Expression (2.15), the technique advocated byGrady[2006] also makes use of the Laplacian operator to produce segmentations. Grady [2006] solves the classi-cal Random Walk-based problem for the unlabeled vertex vector xsubject to given labels provided by the user:
Lx= 0⇐⇒(D−W)x= 0⇐⇒Px=x, (2.16)
21 2. Graph Laplacian: Review and Fundamental Concepts
can be obtained by taking bi = di when assuming the general form of Laplacian
opera-tor (2.1). Moreover, one can prove that P is similar to Ln from Equation (2.14), that is,
P=D−1/2LnD1/2.
Rewriting Equation (2.16) in terms of a minimization problem, the following quadratic energy is derived:
E(x) =xTLx, (2.17)
being mathematically constrained to the graph labels A and B provided by the user, that is, xA = 1, xB = 0. The linear algebra formulation of Equation (2.16) allows a unique
minimizer for the energy functional (2.17), as described in [Grady,2006].
C
HAPTER
3
Spectral Image Segmentation
In this chapter we introduce a novel user-assisted image segmentation technique, first reported in [Casaca et al.,2011b,2013b], which combines three classical approaches usually exploited by the computer vision community: image decomposition,similarity metrics, and spectral graph theory. As part of the related work in the image segmentation field, we also briefly discuss a variety of existing methods that rely on spectral clustering on graphs. Finally, we end this chapter by conducting experimental evaluations against state-of-the-art spectral segmentation methods through a qualitative and quantitative analysis of the results.
3.1
Spectral Image Segmentation Methods
Image segmentation is no doubt one of the most important tasks in digital image pro-cessing and computer vision. The wide range of important applications that rely on image
3.1. Spectral Image Segmentation Methods 24
segmentation such asimage coding[Jiang et al.,2013,Wu, 1992],content-based image re-trieval[Bruno et al., 2008, Ozden and Polat, 2007] and object recognition [Li et al., 2007,
Tu et al., 2005], have motivated the development of an enormous quantity of techniques for segmenting images. In particular, graph-based techniques figure among the most effective methods, mainly due to the flexibility it provides to handle specific attributes of the im-age [Diaz et al., 2002, Falc˜ao et al., 2004, Noma et al., 2012, Pratt, 2008, Shi and Malik,
2000].
The strength of graph-based approaches comes from the solid mathematical founda-tion it relies on, since most of the well-established graph theory [Bollob´as, 1998] can be directly used to manipulate the image segmentation problem. For instance, spectral graph theory [Chung,1997] has been the basic tool for the so-called spectral cut method [Maji et al.,
2011,Mohar,1997,Shi and Malik,2000,Spielman,2007], which exploits the eigenstructure of an image affinity graph so as to perform clustering. In fact, spectral graph theory enables great flexibility in the segmentation process, as different choices can be made towards defin-ing the similarity graph connectivity as well as the assignment of weights to the edges of the graph. Such a flexibility has leveraged a multitude of techniques, making spectral cuts an attractive image segmentation approach.
Among the vast amount of techniques inspired in spectral cuts, three approaches have gain a lot of attention in recent years, being widely used as source of segmentations in many practical applications:
1. Spectral and Normalized Cuts-based algorithms [Carvalho et al.,2010a,b, Ma et al.,
2008,Maji et al.,2011,S´aez et al.,2014,Shi and Malik,2000,Tao et al.,2007,Taylor,
2013];
2. Multiscale Segmentation-based algorithms [Cai and Chung, 2006, Cour et al., 2005,
Maire and Yu,2013,Sun and He,2009,Yu,2004];
25 3. Spectral Image Segmentation
(a) (b)
(c) (d)
Figure 3.1: (a)Original image, (b) ground truth, (c)the result obtained by the NCut tech-nique [Shi and Malik,2000] and(d)NCut multiscale [Cour et al.,2005].
Figure 3.1 presents some results obtained from the approaches listed above. In the following, we briefly describe the first two groups (spectral-computed based) while the third one (energy functional based) is detailed in the Section4.1.
3.1.1
Normalized Cut Segmentation
Shi and Malik [2000] introduced the concept of Normalized Cut (NCut), a graph op-timization problem that aims to subdivide a graph so as to minimize the normalize sum of weights of the graph edges. They show that finding the optimal normalized cut is an NP-Hard problem, but feasible solutions can be reached from the Fiedler vector (see Section2
3.1. Spectral Image Segmentation Methods 26
More specifically, the NCut methodology builds a graphG= (V, E, WE)from the given
imageIby associating each pixelPi ∈Iwith a node of the graph and connecting two pixels
PiandPj with an edgeeij ∈E, if Equation (3.1) holds:
kPi−Pjk2 < r, (3.1)
where Pi and Pj are the corresponding pixels to the nodes i ∈ V and j ∈ V whiler is a
parameter that measures how local the edges should be. The weights wij = w(eij) ∈ WE
assigned to the edges are computed from the following formula:
wij = exp
−kPi−Pjk
2 2
σ2 P
− kIi−Ijk
2 2 σ2 I , (3.2)
where Ii andIj account for the intensity values inPi andPj. The pair (σP, σI)are tuning
parameters used to control the scope of each term (position and intensity) in Equation (3.2). Variations of the pairwise function (3.2) have also been proposed in the literature of spectral cut which rely on learning local grouping cues from the image spectrum [Kim et al., 2013] or inferring graph node connections through random forest computation [Zhu et al.,2014].
The optimal cut separating the setsAandB such that A∩B = ∅andA∪B = V is performed by minimizing the normalized cut penalty function:
N Cut(A, B) = cut(A, B) vol(A) +
cut(A, B)
vol(B) , (3.3)
being cut(A, B) = Pi∈A,j∈Bwij and vol(A) = Pi∈A,k∈V wik. For an illustration, see
27 3. Spectral Image Segmentation 2 9 6 11 5 3 4 7 10 1 8
1
1
1
1
1
20
15
20
20
15
15
20
15
20
Figure 3.2: Optimal cut (in green) obtained by NCut algorithm for a trivial connected graph.
The main disadvantage of the NCut approach is its poor performance when dealing with texture segments in the image. Moreover, computing the eigenvectors of a graph de-mands an excessive computational effort, making use of this approach unfeasible for large images [Casaca et al.,2011b].
Many variants of the NCut method have emerged in the literature, most of which propos-ing alternative graph construction and weight assignment. For instance, nodes of the graph and weights may be defined from watershed segmentation [Carvalho et al.,2010a,Tao et al.,
2007], graph order reduction [Taylor, 2013], color and texture descriptors [Ma et al.,2008,
S´aez et al.,2014], and normalized cut relaxations [Luxburg,2007,Maji et al.,2011], just to cite a few.
3.1.2
Multiscale-based Segmentation
Aiming at achieving multiscale image segmentation, some authors have proposed to por-tray the representative graph in different levels, varying progressively the number of nodes and edges. Multiscale approaches aim to capture both local and global geometric relations among the structures of image.
3.2. Spectral Image Segmentation via Cartoon-Texture Decomposition and Inner
Product-based Metric 28 For instance, the multiscale technique proposed byCour et al.[2005] attempts to decom-pose the affinity graph in multiple scales so that the local grouping cues are better propagated along image segments when the radius of the graph neighborhood increases. Given an initial radiusr, an affinity matrixWis built from a sequence of subgraph matrices Wsat scales, where the scale reflects pixels sampled at(2r+ 1)s−1 distance:
W=W1+W2+...+Ws. (3.4)
Performing the spectral clustering from Matrix (3.4) allows for capturing coarse as well as fine details of the image, as pointed out in [Cour et al.,2005]. A drawback of this algorithm is that to reach a good level of clustering refinement, the value ofrmust be large, rendering the method not so feasible for segmenting moderate or large size images.
Multiscale-based techniques for image partition have also appeared in the context of multidimensional projection [Cai and Chung, 2006], quad-tree decomposition [Carvalho et al.,2010b] and texture descriptors [Sun and He,2009].
3.2
Spectral Image Segmentation via Cartoon-Texture
De-composition and Inner Product-based Metric
Despite their effectiveness and powerfulness, methods inspired on spectral cuts present some weaknesses that must be observed when performing segmentation. For example, the accuracy in detecting the boundaries between image regions is highly dependent on the weights assigned to the edges of the graph. Although automatic schemes have been proposed to accurately compute those weights [Cai and Chung, 2006, Cour et al., 2005, Kim et al.,
29 3. Spectral Image Segmentation
many pragmatic situations. Another important issue in the context of spectral cuts is the computational cost, as computing the eigenstructure of a graph is a very time consuming task, hampering the direct use of spectral segmentation in high resolution images [Koutis et al.,2009].
In this chapter we introduce a new methodology for image segmentation that relies on spectral cuts but addresses the issues raised above. The proposed methodology, first reported in [Casaca et al.,2011b,2013b], can be summarized in the following steps:
• We decompose the target image into two new images: the smooth and texture com-ponents. This mechanism is based on a cartoon-texture image decomposition scheme [Vese and Osher, 2003, 2006] that facilitates the identification of different features contained in the image.
• Next, we provide a novel mechanism to assign weights to the edges of the affinity graph that results in accurate segmentation in most cases.
• In the third step, we describe how to build the similarity graph from a coarse represen-tation of the input image without degrading the quality of the segmenrepresen-tation.
• In contrast to other spectral cut-based approaches, our technique allows for user inter-vention in critical situations, enabling users to interactively modify weights according to their perception.
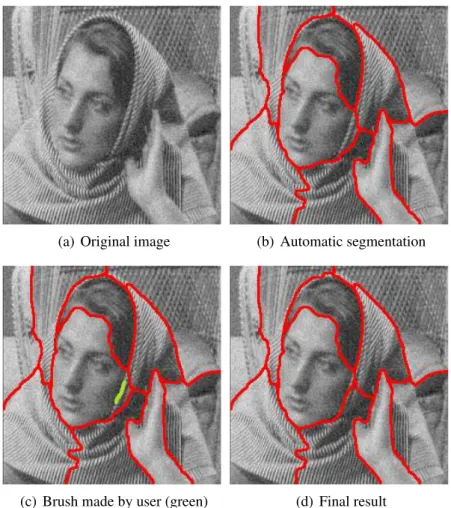
We show in Section3.2.2that the proposed approach outperforms classical spectral seg-mentation techniques in aspects such as accuracy and robustness on the well-known image dataset from UC-Berkley [Martin et al.,2001]. Figure3.3shows an example of the proposed framework. We can summarize the novelties introduced by our methodology as:
3.2. Spectral Image Segmentation via Cartoon-Texture Decomposition and Inner
Product-based Metric 30
Figure 3.3: First row: from the left to right, the ground truth image and the result obtained with our method without user intervention. Second row: illustrates the user interaction (green scribes) to improve the segmentation.
2. A novel method to compute and assign weights to the edges of the similarity graph using the cartoon component extracted from the image;
3. A new strategy to modify the weights of the graph according to user interaction, taking into account the texture component of the image.
3.2.1
Pipeline Overview
31 3. Spectral Image Segmentation
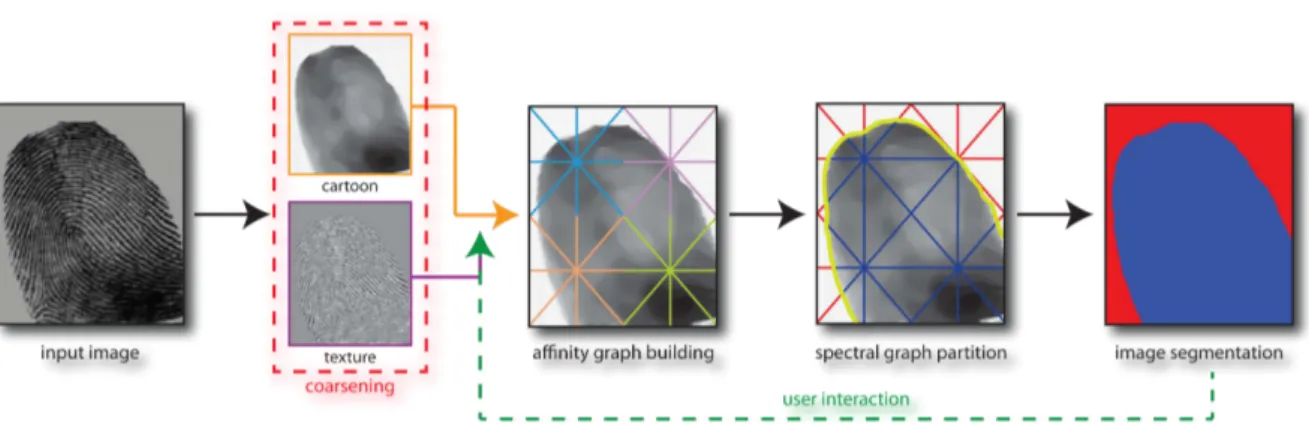
Figure 3.4: Pipeline of the proposed image segmentation framework.
weight assignment stage, which allow us to handle large images. Weights are derived from an inner product-based metric defined on the coarse cartoon image. The spectral decomposition is carried out in the spectral partition step, being the result mapped back to the original image through a coarse-to-fine interpolation procedure. The user can change the partition by stroking the resulting segmentation. This step is performed by combining the coarse texture component with a recent technique of harmonic analysis [Demanet and Ying, 2007a,b] in order to incorporate the high-level oscillatory information into the spectral cut process.
Details about each step of the pipeline are provided below.
Cartoon-Texture Image Decomposition
The Cartoon-Texture Decomposition (CTD) splits the input imageI into two disjoint images, C and T. The cartoon component C holds the geometric structures, isotopes and smooth-pieces ofI while the texture component contains textures, oscillating patterns, fine details and noise.
3.2. Spectral Image Segmentation via Cartoon-Texture Decomposition and Inner
Product-based Metric 32
cartoonC and textureT components are computed by solving the following system of equa-tions:
C =I −∂xg1−∂yg2+
1 2λdiv
∇C |∇C|
µp g1 g2
1 +g22
= 2λ
∂
∂x(C − I) +∂
2
xxg1+∂xy2 g2
,
µp g2 g2
1 +g22
= 2λ
∂
∂y(C − I) +∂
2
xyg1+∂yy2 g2
(3.5)
with initial conditions forC,g1, andg2 given by
∇C
|∇C| ·(nx, ny) = 0
(I − C −∂xg1 −∂yg2)·nx = 0
(I − C −∂xg1 −∂yg2)·ny = 0
. (3.6)
Mathematically, the cartoon componentCis a bounded variation function,−→g = (g1, g2)∈
L2(R2)where the texture componentT = div(−→g), and the constantsλ, µ >0are tuning
pa-rameters. Equations (3.5) are usually discretized by a semi-implicit finite difference schemes and solved using an iterative algorithm based on fixed point iteration (for more details about numerical aspects, see [Vese and Osher, 2003, 2006]). Figure3.5 shows the result of the CTD scheme applied to a digital image.
(a) Input Image (b) Cartoon (c) Texture
33 3. Spectral Image Segmentation
In our methodology, bothCandT are used to compute the weights assigned to the edges of the affinity graph. SinceCis a texture-free denoised image, edge and shape detectors work well when applied toC as pointed out in [Vese and Osher, 2003]. This fact is exploited to define the weights, as we detail later. Information contained inT is handled only at the end of pipeline, during user interaction stage.
Image Coarsening
In order to reduce the size of the affinity graph towards alleviating the computational burden during the spectral decomposition, we perform a fine-to-coarse transformation onC
(resp. T), resulting in a coarse scale C˜(resp. T˜) of C (resp. T). Such a transformation is accomplished using the bicubic interpolation method described in [Shuai et al., 2007], which minimizes the blurring effect while still preserving gradients in the coarse image (see Figure3.6for an illustration). Other downsampling techniques such as [Zhang et al., 2011] can be alternatively used to convey essential image information among scales.
Our experiments showed that coarsening the image to one-fourth of its original resolu-tion is a good trade-off between computaresolu-tional time and accuracy, speeding up the processing up to 6 times. In fact, this performance gain can be seen in the evaluation shown in Table3.1.
Building the Affinity Graph
The affinity graphGis built by associating each pixel fromC˜to a node of the graph, con-necting the nodes according to the distancerbetween corresponding pixels, in mathematical
(a) Cartoon image coarsening (b) Texture image coarsening
3.2. Spectral Image Segmentation via Cartoon-Texture Decomposition and Inner
Product-based Metric 34
words,
kPi−Pjk∞ < r . (3.7)
The weight assigned to each edge ofGis derived from the proposed inner product-based metric. In contrast to the original NCut, which takes into consideration only spatial positions and pixel intensities (Eq. (3.2)), our inner product-based metric considers the variation of the image in the directions defined by the edges of the graph. More specifically, the weightwij
associated to the edgeeij is defined as:
wij =
1 1 +ηh2
ij
, hij = max
(
∂C˜(Pi)
∂−d→ij
,∂C˜(Pj) ∂−d→ji
,0
)
, (3.8)
∂C˜(x)
∂−d→ij
=h∇C˜(x),−d→iji, with
−→
dij =
−−→
PiPj
|−−→PiPj|
. (3.9)
The left most term in Equation (3.9) is the directional derivative of C˜in the direction
−→
dij, which is defined from the graph G and η > 0 is a tuning constant. Therefore, image
properties as well as the adjacency structure of the affinity graph is taken into account when assigning weights to the edges of G. In other words, similarly to Equation (3.2), our for-mulation accounts for the intensity and geometric information to define the weights through the inner-product in the edge direction. Figure3.7provides a geometric interpretation of the proposed metric.
The effective weightswij are chosen from Eq. (3.8) rather then using the exponential
measure usually employed by other authors [Carvalho et al., 2010b, Shi and Malik, 2000,
35 3. Spectral Image Segmentation
∇C˜(Pj)
Pj
∇C˜(Pi)
Pi
−→
dij
−→
dji
(a) Same direction
∇C˜(Pj)
Pj
−→
dji
∇C˜(Pi)
Pi
−→
dij
(b) Oblique and orthogonal direc-tion
Pj ∇C˜(P
j)
−→
dji
∇C˜(Pi)
Pi −→
dij
(c) Opposite direction
Figure 3.7: Geometric interpretation of the inner product-based metric. Maximum weights occur when the gradient and the direction defined from the graph edge point to the same direction(a). Moderate weight is highlighted in(b)and the third case, where opposite direc-tions(c)produce minimum weights (zero).
which was originally used for establishing the notion of anisotropy in partial differential equations. Moreover, the inner product-based metric (3.8) holds that wij = wji, which
ensures symmetry for the graph Laplacian matrixL. This fact is of paramount importance to guarantee that the eigenstructure ofLis made up of only real numbers.
Spectral Cutting and Coarse-to-Fine
Given the affinity graph G built from C˜and the number of partitions initially defined by the user, we carry out the spectral decomposition using the same methodology proposed in [Shi and Malik,2000]. More specifically, we first decompose the graph Laplacian matrix asL =D−W, whereDandWcontain the diagonal and off-diagonal elements ofL. Then, the Fiedler vectorf is obtained by solving the generalized eigenvalue problem
(D−W)x=λDx, (3.10)
3.2. Spectral Image Segmentation via Cartoon-Texture Decomposition and Inner
Product-based Metric 36
____
____
____
____
____
Solution of the
f =
Eigenproblem
____
________
____
____
Fiedler vector
Affinity matrix
Figure 3.8: Spectral cut pipeline to partition the image from the zero-set of the Fiedler vector.
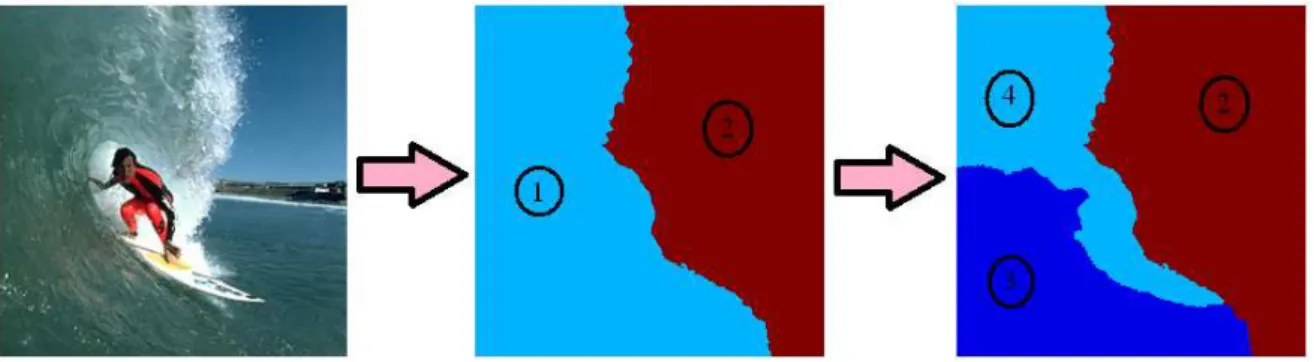
The Fiedler vector splitsC˜into two subsets, one containing the pixels corresponding to nodes of the graph where the entries of f are positive and other containing the pixels with negative values of f. Therefore, the zero-set off is a curve that separates the regions with different signs. Figure3.8portrays the spectral cut procedure. The partitioning created inC˜
is then brought back toC using bicubic interpolation fromf.
Multiple partitions can also be reach by recursively computing the spectral decomposi-tion for each part of the image before the interpoladecomposi-tion process, as depicted in Figure 3.9. This recursive process, namely “two-way” cut, was employed rather than the simultaneous “k-way” procedure [Shi and Malik,2000] due to the supervised step of our algorithm, which manages the computational burden of the spectral decomposition by only performing new cuts in the regions modified by the user. In fact, the recursive process may be driven by the user, who can specify the highest level of recursion, moreover, the user can brush any pieces of the image during each one of recursion steps in order to better set weights and thus improve the segmentation quality (see the next section for details).
Figure3.10 shows the result of applying our methodology to segment a fingerprint