António Afonso, José Alves
Stock-Flow Adjustments and Interest
Rates
WP05/2017/DE/UECE
_________________________________________________________
De pa rtme nt o f Ec o no mic s
W
ORKINGP
APERSStock-Flow Adjustments and Interest Rates
∗
Ant´onio Afonso
†, Jos´e Alves
‡2017
Abstract
We assess the effects of stock-flow adjustments (SFA) on short and long-term interest rates for 14 European countries between 1970 and 2015, in panel and SUR analysis. We conclude that an increase in SFA reduces long- and short-term interest rates, with higher reductions for short-term rates. Furthermore, the decreasing effects of an increment in the stock-flow have reduced since the 2008-2009 financial crisis. As expected, there is also an upward push on both interest rates from a rise in the debt ratio.
Keywords: Stock-flow adjustment; Debt; Interest rates; SUR; Panel.
JEL:C33, E43, H63, H83.
∗The opinions expressed are those of the authors and not necessarily those of the respective employers.
†ISEG/UL - University of Lisbon, Department of Economics; UECE – Research Unit on Complexity
and Economics. UECE is supported by Funda¸c˜ao para a Ciˆencia e a Tecnologia (Portuguese Foundation
for Science and Technology). email: [email protected].
‡ISEG/ULisbon – University of Lisbon, R. Miguel Lupi 20, 1249-078 Lisbon, Portugal; UECE –
Introduction
Since 2008 government debt and fiscal policy dynamics in the context of the financial and economic crisis, have been widely discussed and addressed in the institutional forum and in the literature, and some articles studied the effect of public debt on growth. Reinhart and Rogoff (2010), Afonso and Jalles (2013), Baum et al. (2013) and Afonso and Alves (2015) stressed a nonlinear debt effect on economic growth, providing government debt threshold values. On the other hand, public debt sustainability became a paramount issue as well. For instance, Collignon (2012) and Ghosh et al. (2013) shed light on the links between sustainable debt paths policies taken by politicians.
Commonly, the variation of public debt should equal the inverse of the government budget balance. However, stock-flow adjustments also play a role for debt dynamics, notably related to balance-sheet effects. According to the European Commission (2005), the stock-flow adjustment ensures the match between net borrowing flows and the change in the government gross debt, which includes financial assets accumulation, variations in public debt value denominated in foreign currency and other statistical adjustments.
Although some existing studies tackle this component of debt dynamics (see Weber (2012), Panizza (2013) and Irwin (2015)) there is no literature regarding the stock-flow adjustments (SFA) effects on interest rates. Furthermore, following Jaramillo et al. (2016) which shed light on the composition of stock-flow adjustments, the liquidity degree compos-ing stock-flows can differently impact on interest rates. As demonstrated in this work, the illiquid asset accumulation is the main contributor for stock-flow accumulation, which may increase the difficulty of liquidation of those assets. Such are associated with a greater risk degree, and, therefore, jeopardizing the sustainability of public debt and causing a pressure on short and long-term interest rates. Therefore, we assess the financial impact of such stock-flow adjustments discrepancies on short and long-term interest rates in 14 European economies.
Methodology and Data
The SFA is given in (1) for country i (i= 1, ..., N) and timet (t = 1, ..., T):
SFi,t =
(debti,t−debti,t−1)−defi,t
Yi,t
, (1)
the nominal stock of government debt, defi,t, the nominal general government budget
balance and Yi,t is nominal GDP. Our data is retrieved from the AMECO database for
the period 1970-2015 for 14 European countries: Austria (AT), Belgium (BE), Denmark (DK), Finland (FI), France (FR), Germany (DE), Greece (GR), Ireland (IE), Italy (IT), the Netherlands (NL), Portugal (PT), Spain (SP), Sweden (SW) and the United Kingdom (UK) (see Table 1).
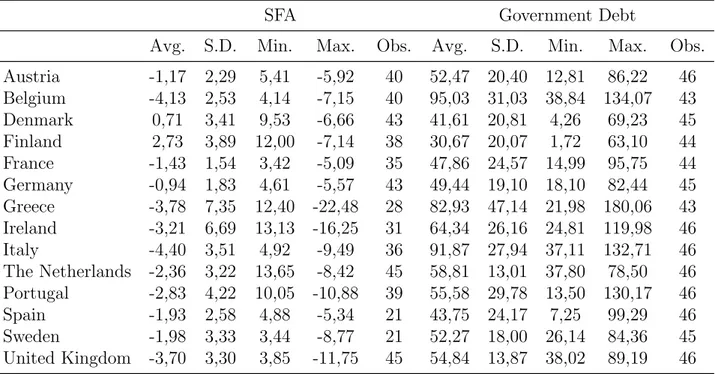
Table 1: Statistics for SFA and government debt, 1970-2015 (% of GDP).
SFA Government Debt
Avg. S.D. Min. Max. Obs. Avg. S.D. Min. Max. Obs.
Austria -1,17 2,29 5,41 -5,92 40 52,47 20,40 12,81 86,22 46
Belgium -4,13 2,53 4,14 -7,15 40 95,03 31,03 38,84 134,07 43
Denmark 0,71 3,41 9,53 -6,66 43 41,61 20,81 4,26 69,23 45
Finland 2,73 3,89 12,00 -7,14 38 30,67 20,07 1,72 63,10 44
France -1,43 1,54 3,42 -5,09 35 47,86 24,57 14,99 95,75 44
Germany -0,94 1,83 4,61 -5,57 43 49,44 19,10 18,10 82,44 45
Greece -3,78 7,35 12,40 -22,48 28 82,93 47,14 21,98 180,06 43
Ireland -3,21 6,69 13,13 -16,25 31 64,34 26,16 24,81 119,98 46
Italy -4,40 3,51 4,92 -9,49 36 91,87 27,94 37,11 132,71 46
The Netherlands -2,36 3,22 13,65 -8,42 45 58,81 13,01 37,80 78,50 46
Portugal -2,83 4,22 10,05 -10,88 39 55,58 29,78 13,50 130,17 46
Spain -1,93 2,58 4,88 -5,34 21 43,75 24,17 7,25 99,29 46
Sweden -1,98 3,33 3,44 -8,77 21 52,27 18,00 26,14 84,36 45
United Kingdom -3,70 3,30 3,85 -11,75 45 54,84 13,87 38,02 89,19 46
Sources: AMECO and own calculations. S.D. – standard deviation.
After computing the SFA, we estimate (2) using panel data, with the nominal short-and long-term interest rates as dependent variables for the 1970-2015 period. We use OLS, OLS-Fixed Effects and 2SLS, this last one to correct for possible endogeneity problems:
interesti,t =γ+β1∗SFi,t+β2∗SFi,t∗d2009 +β3∗Debti,t+ηi+ϕt+εi,t, (2)
where interest represents short (and long-term) interest rates, SF is the stock-flow ad-justments, d2009 a dummy variable with the value 1 between 2009 and 2015, Debt is the annual change of government debt-to-GDP ratio, and ηi and ϕt are the country-specific
Furthermore, we make a SUR estimation of both equations to assess the impact of SFA in each country.
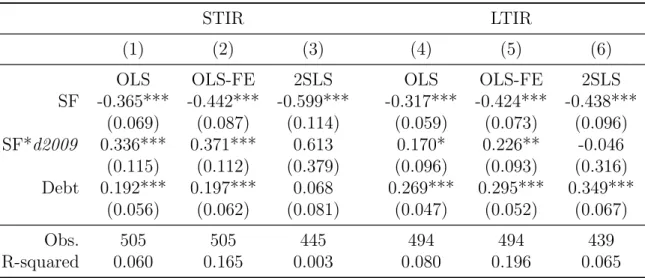
Results
Table 2 reports the results for the panel estimations of (2). We can conclude that an increase in SFA tends to reduce long- and short-term interest rates. However, the magnitude of the reduction is greater for short-term rates. Furthermore, the decreasing effects of an increment in the stock-flow have reduced since the 2008-2009 financial crisis. In addition, and as we expected, there is an upward push on both interest rates from a rise in the debt ratio. Furthermore, before the crisis an increase in the SFA counterbalances the effect of an increase of public debt on interest rates. After the crisis, both SFA and debt increases increase both rates.
Table 2: Panel results for short and long-term interest rates.
STIR LTIR
(1) (2) (3) (4) (5) (6)
OLS OLS-FE 2SLS OLS OLS-FE 2SLS
SF -0.365*** -0.442*** -0.599*** -0.317*** -0.424*** -0.438***
(0.069) (0.087) (0.114) (0.059) (0.073) (0.096)
SF*d2009 0.336*** 0.371*** 0.613 0.170* 0.226** -0.046
(0.115) (0.112) (0.379) (0.096) (0.093) (0.316)
Debt 0.192*** 0.197*** 0.068 0.269*** 0.295*** 0.349***
(0.056) (0.062) (0.081) (0.047) (0.052) (0.067)
Obs. 505 505 445 494 494 439
R-squared 0.060 0.165 0.003 0.080 0.196 0.065
Table 3: SUR estimation of SFA effects on short and long-term interest rates.
STIR LTIR STIR LTIR
Austria SF 0.203 -0.128 Ireland SF -0.056 -0.123*
(0.186) (0.176) (0.111) (0.065)
SF*d2009 -0.089 -0.058 SF*d2009 0.077 0.178**
(0.227) (0.214) (0.124) (0.074)
Debt -0.241 0.113 Debt 0.023 0.108***
(0.157) (0.148) (0.066) (0.040)
Belgium SF -0.732*** -0.788*** Italy SF -1.426*** -1.137***
(0.117) (0.080) (0.132) (0.112)
SF*d2009 0.450* 0.531*** SF*d2009 0.273 0.200
(0.254) (0.174) (0.391) (0.337)
Debt 0.479*** 0.500*** Debt 0.958*** 0.887***
(0.076) (0.051) (0.128) (0.108)
Denmark SF 0.208 0.278 Netherlands SF -0.116 -0.227**
(0.169) (0.189) (0.104) (0.092)
SF*d2009 -0.270 -0.512 SF*d2009 0.365** 0.431***
(0.290) (0.322) (0.165) (0.147)
Debt 0.282** 0.296** Debt 0.126 0.207**
(0.117) (0.132) (0.092) (0.081)
Finland SF 0.616*** 0.250** Portugal SF -0.622* -0.668*
(0.120) (0.111) (0.364) (0.403)
SF*d2009 -0.566 -0.464 SF*d2009 0.158 0.397
(0.356) (0.324) (0.297) (0.326)
Debt -0.137 0.024 Debt 0.390 0.536
(0.107) (0.100) (0.309) (0.326)
France SF 0.897* 0.696 Spain SF -0.419 -0.361
(0.527) (0.506) (0.299) (0.261)
SF*d2009 -0.110 0.010 SF*d2009 0.263 0.383
(0.428) (0.411) (0.286) (0.251)
Debt -0.516* -0.429 Debt 0.050 0.163*
(0.294) (0.292) (0.105) (0.090)
Germany SF 0.334* 0.083 Sweden SF -0.445*** -0.515***
(0.200) (0.153) (0.096) (0.105)
SF*d2009 -0.040 0.075 SF*d2009 0.002 0.257
(0.274) (0.209) (0.247) (0.270)
Debt -0.181 0.003 Debt 0.295*** 0.281***
(0.132) (0.101) (0.083) (0.091)
Greece SF -0.712 -0.940** United Kingdom SF -0.182 -0.365***
(0.434) (0.407) (0.142) (0.128)
SF*d2009 0.179 -0.409* SF*d2009 0.576*** 0.415**
(0.295) (0.247) (0.213) (0.191)
Debt 0.480 0.995*** Debt -0.213** 0.056
(0.336) (0.314) (0.107) (0.096)
Regarding the SUR estimations (Table 3), we find statistically significant evidence of a downward effect of the SFA on interest rates for the cases of Ireland, Belgium, Italy, the Netherlands, the UK, Portugal, Sweden, and Greece. On the other hand, SFA operations have increased both interest rates for Finland, while for France and Germany this effect of stock-flow adjustments are observed only for short-term rates.
In addition, an increase in government debt pushes up both short and long-term interest rates in many countries. For some countries as Greece and Ireland, this increasing effect of debt is only significant for long-term rates. On the other hand, we observe that for France and the UK, the increase in public debt reduces short-term interest rates. However, after the 2008-2009 crisis an increase of the SFA mitigates the overall upward pressure on the long-term interest rates in Ireland and in the UK, while in Greece the crisis reinforced the downward effect of the SFA on the long-term yields (see summary Table 4).
Table 4: Summary effects.
Increase in STIR up LTIR up STIR down LTIR down
SFA FI, FR, DE FI BE, IT, PT, SW IR, BE, IT, NL,
PT, SW, GR, UK
Debt BE, IT, DK, SW IR, BE, IT, DK,
NK, SP, SW, GR FR, UK
Conclusions
We assessed the effects of SFA on short- and long-term interest rates for 14 European countries for a 45-year time span. In general, the panel results show more cases of interest rate relief effects from an increase in the SFA.
Moreover, the 2008-2009 crises had a strong impact on interest rates dynamics caused by both SFA and increasing debt ratios. Before 2008, SFA partially compensates in some countries an upward pressure caused by increasing government debt.
References
Afonso, A. and Alves, J. (2015). The Role of Government Debt in Economic Growth.
Hacienda P´ublica Espa˜nola/Review of Public Economics, 25:384 – 407.
Afonso, A. and Jalles, J. T. (2013). Growth and productivity: The role of government debt. International Review of Economics & Finance, 25:384 – 407.
Baum, A., Checherita-Westphal, C., and Rother, P. (2013). Debt and growth: New evi-dence for the euro area. Journal of International Money and Finance, 32:809 – 821.
Collignon, S. (2012). Fiscal Policy Rules and the Sustainability of Public Debt in Europe.
International Economic Review, 53(2):539–567.
European Commission (2005). General Government Data, General Government Expendi-ture, Balances and Gross Debt. Technical report, European Comission, Brussels, Bel-gium.
Ghosh, A. R., Kim, J. I., Mendoza, E. G., Ostry, J. D., and Qureshi, M. S. (2013). Fiscal
Fatigue, Fiscal Space and Debt Sustainability in Advanced Economies. The Economic
Journal, 123(566):F4–F30.
Irwin, T. C. (2015). Defining the Government’s Debt and Deficit. Journal of Economic Surveys, 29(4):711–732.
Jaramillo, L., Mulas-Granados, C., and Kimani, E. (2016). The Blind Side of Public Debt Spikes. (WP/16/202).
Panizza, U. (2013). The Origins and Resolution of Debt Crises: It Is Not Always Fiscal!
Comparative Economic Studies, 55(3):431–453.
Reinhart, C. M. and Rogoff, K. S. (2010). Growth in a Time of Debt. American Economic Review, 100(2):573–78.