Hypotonic Activation of the Myo-Inositol
Transporter SLC5A3 in HEK293 Cells Probed
by Cell Volumetry, Confocal and
Super-Resolution Microscopy
Joseph Andronic1, Ryo Shirakashi2, Simone U. Pickel1, Katherine M. Westerling1, Teresa Klein1, Thorge Holm1, Markus Sauer1, Vladimir L. Sukhorukov1*
1Department of Biotechnology and Biophysics, University of Würzburg, Biozentrum, Am Hubland, Würzburg, Germany,2Institute of Industrial Science, The University of Tokyo, Tokyo, Japan
Abstract
Swelling-activated pathways formyo-inositol, one of the most abundant organic osmolytes in mammalian cells, have not yet been identified. The present study explores the SLC5A3 protein as a possible transporter ofmyo-inositol in hyponically swollen HEK293 cells. To ad-dress this issue, we examined the relationship between the hypotonicity-induced changes in plasma membrane permeability tomyo-inositolPino[m/s] and expression/localization of
SLC5A3.Pinovalues were determined by cell volumetry over a wide tonicity range (100– 275 mOsm) inmyo-inositol-substituted solutions. While being negligible under mild hypoto-nicity (200–275 mOsm),Pinogrew rapidly at osmolalities below 200 mOsm to reach a
maxi-mum of*3 nm/s at 100–125 mOsm, as indicated by fast cell swelling due tomyo-inositol influx. The increase inPinoresulted most likely from the hypotonicity-mediated incorporation
of cytosolic SLC5A3 into the plasma membrane, as revealed by confocal fluorescence mi-croscopy of cells expressing EGFP-tagged SLC5A3 and super-resolution imaging of immu-nostained SLC5A3 bydirectstochastic optical reconstruction microscopy (dSTORM).
dSTORM in hypotonic cells revealed a surface density of membrane-associated SLC5A3 proteins of 200–2000 localizations/μm
2
. Assuming SLC5A3 to be the major path formyo -inositol, a turnover rate of 80–800myo-inositol molecules per second for a single transport-er protein was estimated from combined volumetric anddSTORM data. Hypotonic stress also caused a significant upregulation of SLC5A3 gene expression as detected by semi-quantitative RT-PCR and Western blot analysis. In summary, our data provide first evidence for swelling-mediated activation of SLC5A3 thus suggesting a functional role of this trans-porter in hypotonic volume regulation of mammalian cells.
OPEN ACCESS
Citation:Andronic J, Shirakashi R, Pickel SU, Westerling KM, Klein T, Holm T, et al. (2015) Hypotonic Activation of the Myo-Inositol Transporter SLC5A3 in HEK293 Cells Probed by Cell Volumetry, Confocal and Super-Resolution Microscopy. PLoS ONE 10(3): e0119990. doi:10.1371/journal. pone.0119990
Academic Editor:Ben C.B. Ko, The Hong Kong Polytechnic University, HONG KONG
Received:June 26, 2014
Accepted:January 21, 2015
Published:March 10, 2015
Copyright:© 2015 Andronic et al. This is an open access article distributed under the terms of the
Creative Commons Attribution License, which permits unrestricted use, distribution, and reproduction in any medium, provided the original author and source are credited.
Data Availability Statement:All relevant data are within the paper and its Supporting Information files.
Funding:This publication was funded by the German Research Foundation (DFG) and the University of Wuerzburg in the funding programme Open Access Publishing. The funders had no role in study design, data collection and analysis, decision to publish, or preparation of the manuscript.
Introduction
Most animal cells are able to regulate their volume in anisotonic media [1,2]. Efficient volume regulatory mechanisms are essential for cell survival because they protect cells against excessive osmotic shrinkage or swelling [3]. In general, cell volume restoration is achieved by activation of volume-sensitive membrane pathways, which enable the cells to accumulate or to release os-motically active substances. In hypertonic media, shrunken cells undergo regulatory volume increase (RVI) via the uptake of extracellular electrolytes (e.g. NaCl) and osmotic water influx, whereas hypotonically swollen cells release KCl and shrink via regulatory volume decrease (RVD). A variety of channels and transporters are involved in the uptake or release of electro-lytes (K+, Na+, Cl-, etc.) during cell volume regulation [4–8].
In addition to inorganic ions, a wide range of small organic osmolytes (SOOs), such as myo-inositol, sorbitol, taurine, etc., are important for maintaining the osmotic balance of cells [9– 11]. A key role of these molecules in cell volume regulation is supported by the fact that various cell types possess considerable pools of SOOs [12]. Moreover, many mammalian cell types re-spond to hypertonicity by replacing cytosolic electrolytes with SOOs, thus avoiding detrimental effects of high ionic strength on structure and function of cytosolic proteins [9,13]. During hy-pertonic conditions, myo-inositol, as one of the most abundant SOOs, is synthesized by cells or accumulated from extracellular medium by the sodium-dependent cotransporter SMIT [1,5,14]. SMIT belongs to the solute carrier (SLC) superfamily and it is referred hereafter as SLC5A3, according to the established nomenclature [15].
Long-term exposure of cells to hypertonic solutions upregulates the transcription of SLC5A3 gene, which in turn leads to an increased SLC5A3-mediated uptake ofmyo-inositol [16,17]. There is a body of evidence in the literature indicating that the hypertonicity-induced expression of a battery of genes, including SLC5A3, crucial for the adaptation of mammalian cells to hypertonic stress is regulated by the tonicity enhancer-binding protein (TonEBP) or NFAT5 [18–21]. When expressed inXenopusoocytes, SLC5A3 transports, besides myo-inosi-tol, a wide range of substrates including glucose, galactose and others monomeric sugars and carbohydrates [22]. Compared to the mechanisms operating under chronic hypertonic condi-tions, the transport pathways involved in the release ofmyo-inositol and other SOOs from hypotonically swollen cells are much less understood [5]. Particularly, the potential impact of acute hypotonic stress on the expression and localization of SLC5A3 protein has not yet been investigated.
In previous studies on several mammalian cell types [23,24], we have demonstrated two dis-tinct swelling-activated mechanisms differing in their osmotic thresholds and molecular selec-tivity. Particularly we have shown that moderate cell swelling under mild hypotonic conditions (200 mOsm) activates electrolyte pathways allowing the cells to accomplish RVD by releasing cytosolic ions. Neither myo-inositol nor other tested monomeric carbohydrates are able to per-meate through the electrolyte pathways. But upon excessive cell swelling in 100-mOsm media, insertion of a yet-unknown pathway into the cell membrane from cytosolic vesicles renders it highly permeable to monomeric carbohydrates, including myo-inositol, sorbitol, glucose, ga-lactose, etc. [23–25].
In view of its broad substrate specificity and tonicity-modulated expression mentioned above [16,17,22], the myo-inositol transporter SLC5A3 appears to be a promising candidate for a swelling-activated pathway for small carbohydrates. To test this hypothesis in the present study we analyzed the relationship between the amount of membrane-associated SLC5A3 pro-tein and the hypotonically activated plasma membrane permeability to myo-inositol. To this end, we evaluated the membrane permeability coefficients for myo-inositolPinoover a wide
hypotonic myo-inositol-substituted solutions. In parallel experiments, we applied confocal fluorescence microscopy to study cells expressing EGFP-tagged SLC5A3 and super-resolution imaging bydirectstochastic optical reconstruction microscopy (dSTORM) [26,27] to immu-nostained cells to examine the hypotonically induced changes in the intracellular and plasma membrane localization of myo-inositol transporters. In addition, we analyzed the impact of hy-potonic stress on SLC5A3 gene expression using Western blot and semiquantitative RT-PCR.
Material and Methods
Cell culture
HEK293 cells were grown in DMEM with high glucose (4.5 g/L). The complete growth medium (CGM) also contained 10% fetal calf serum, 2 mM glutamine, 100 U/mL penicillin, 100μg/mL streptomycin and 1% non-essential amino acids (all purchased from PAA
Labora-tories, Linz, Austria) in a humidified atmosphere (5% CO2) at 37°C. The cells were kept in
ex-ponential growth by replating three times a week.
Hypotonic perfusion solutions and cell volumetry
myo-Inositol, sucrose and inorganic salts of the highest purified grade were purchased from Sigma (Munich, Germany). For cell volumetry, perfusion solutions of varying osmolalities (100, 125,. . ., 275, 300 mOsm) were used containing either myo-inositol or sucrose as the major osmolyte. In addition to the organic solute (*85–285 mM), all perfusion solutions con-tained 0.9 mM magnesium acetate, 0.1 mM calcium acetate, and 12 mOsm K2HPO4/KHPO4,
pH 7.4. The total osmolality of inorganic electrolytes was*15 mOsm. The solution osmolality was determined with a cryoscopic osmometer (Gonotec, Berlin, Deutschland).
Cell volume changes were monitored by video microscopy using a flow chamber designed for rapid medium exchange [23,25]. The chamber, fabricated of PDMS, was mounted on a mi-croscope slide and sealed with a poly-d-lysine coated glass coverslip. Before measurements, cells were detached by shake-off without trypsin treatment. An aliquot of cell suspension in iso-tonic CGM (*300 mOsm) at a density of*105cells/mL was injected into the chamber and the cells were allowed to settle and to adhere to the chamber floor. The chamber was placed on the stage of a microscope (Leica Leitz DMRM, Hamburg, Germany) and the cells were viewed with a 20x objective in transmitted light.
Cell volume changes were induced by perfusing the chamber with an inositol- or sucrose-substituted solution of varying osmolality (100–300 mOsm). The perfusion rate was set to 20μL/s, using a syringe pump (KD Scientific, Holliston, USA). The cells were photographed
every 10 s, starting 30 s before and up to 60 min after medium exchange with a CCD camera (uEYE, IDS GmbH, Obersulm, Deutschland) attached to the microscope. The response of cells to a strongly-hypotonic sucrose-substituted solution is illustrated by a time-lapse video in the Supporting material (S1 Video). The volumeVof an individual cell was determined from its cross-section area assuming spherical geometry, using the software ImageJ (National Institutes of Health, Bethesda, Maryland). The cell volume was normalized to the original isotonic vol-umeV0as:v=V/V0. The meanvvalues (± SE, N = 20–40 cells) were calculated from a
Derivation of the membrane permeability coefficients for myo-inositol
P
inoIn addition to experiments involving a single perfusion, a separate set of measurements was conducted in which the same cell sample was perfused twice. The first perfusion with hypoton-ic sucrose solution (100–275 mOsm) gave rise, independent of the osmolality, to a rapid initial cell swelling followed by RVD. The occurrence of RVD implies that the plasma membrane re-mains impermeable to the disaccharide sucrose over the entire hypotonicity range. At different time intervals after the first perfusion (e.g. 5, 20. . .or 40 min) the sucrose solution was re-placed by an inositol-substituted medium of the same tonicity.
Theequiosmoticreplacement of sucrose by inositol at tonicities below 200 mOsm not only abolished RVD but also induced a considerable secondary cell swelling. Unlike the initial hypo-tonic swelling caused by an osmotic shift (e.g. 300!100 mOsm), the secondary swelling oc-curred under isosmotic conditions, i.e.noosmotic pressure gradient existed across the cell membrane. In our experiments, the isosmotic cell swelling implies an influx of the major extra-cellular solute myo-inositol into cells through swelling-activated pathways. In contrast, the is-osmotic cell shrinkage during RVD involves the release of intracellular electrolytes.
As outlined in the Supporting Material (S1 Text), the isosmotic cell volume changes during RVD and secondary swelling can be used for the evaluation of membrane permeability coeffi-cients, respectively, for electrolytesPeland myo-inositolPino. From the slope of cell shrinkage
during RVD (dv/dtRVD) in a sucrose-substituted solution, we first calculated thePelvalue, for
each osmotic condition, by applyingEq. 1.
Pel¼
R0 3
ðCo elþC
o sucÞ Co suc dv dt RVD
ð1Þ
whereR0= 7.9μm is the mean radius of HEK293 cells; the extracellular concentration of
elec-trolytes and sucrose were, respectively,Co
el15mOsmandC o
suc85 285mOsm, according
to the composition of perfusion solutions (see above).
We further determined the rate of secondary swelling dv/dtinoinduced by myo-inositol and
appliedEq. 2to calculatePino:
Pino¼
R0 3
ðCo elþC
o inoÞ Co ino dv dt ino
þPel ð2Þ
whereCo
el15mOsmandCoino85 285mOsm. Equations1and2are derived in the
Sup-porting Material section (S1 Text) using the two-parameter formalism [28,29].
The calculatedPinovalues were plotted against the osmolality and fitted to a logistic sigmoid
function of the form:
Pino ¼Pminþ
Pmax Pmin
1þ ðC=C 50Þ
w ð3Þ
wherePmin,Pmax, andware the parameters of the sigmoid.Cis osmolality andC50is the
osmo-lality at which the myo-inositol permeability was of half-activated.
RNA-Extraction
RNA extraction from hypotonically treated cells was performed using a peqGOLD TriFast kit (PEQLAB Biotechnologie GMBH, Erlangen, Germany). The adherently growing HEK293 cells were seeded in 6-well plates (2105cells/well) and grown to 80
which the cells were incubated for 10, 20 or 30 min at room temperature. For RNA extraction, the hypotonic cell samples were lysed with 1 mL TriFast according to the manufacturer’s rec-ommendations. The RNA pellets were dissolved in 50μL of nuclease-free water (Sigma). The
concentration of RNA was determined with a NanoPhotometer Pearl (Implen, Munich, Ger-many). After that, 1 u/μL of RNase inhibitor (RiboLock, Fermentas) was added to the samples
and RNA was immediately used for cDNA synthesis. Isotonic controls were treated similarly, except for hypotonic treatment.
cDNA Synthesis
A 1-μg aliquot of freshly prepared RNA was reverse transcribed (RT) into cDNA using
Rever-tAid (Fermentas), following the manufacturer’s instructions. The reaction mixtures contained 0.5 mM dNTPs, 5X RT Buffer (Fermentas), 1 u/μL RiboLock Ribonuclease inhibitor
(Fermen-tas) and 25 ng/μL random hexamers (Promega). Prior to cDNA synthesis, RNA samples,
ran-dom hexamers and dNTP’s were incubated at 60°C for 5 min. The reaction was carried out at 42°C for 60 min in a C1000 Thermal Cycler (BioRad, Munich, Germany). After that, the sam-ples were heated to 70°C for 10 min to denature the enzyme, and then cooled to 4°C.
Semiquantitative RT-PCR
The mRNA levels of the genes encoding SLC5A3 and SLC6A6 were semi-quantified by the RT-PCR (reverse transcription PCR) method with respect to the mRNA level of transcripts of
β-actin. Freshly prepared samples of cDNA from hypotonically treated cells were used for am-plification of the genes SLC5A3 and actin using, respectively, the following primer sequences:
SLC5A3 5’-GGATCC(BamHI)ATGAGAGCTGTACTGGACACAGCAGAC-3’and
5’- GGATCC(BamHI)GCTAAGGAGAAATAAACAAACATGAAAATTC-3’
ß- Actin 5’- GAATTC(EcoRI)GAAGCATTTGCGGTGGACG-3’and 5’-GAATTC(EcoRI)
ATGGATGATGATATCGCCGCGCTC-3’.
TwoμL of cDNA products were typically amplified with 1 unit of Phusion DNA polymerase
(Finnzyme) in the 5x HF buffer provided by the manufacturer and in the presence of 0.25μM
specific primers (purchased from biomers, Ulm, Germany) and 0.25 mM dNTPs. The opti-mum temperature for annealing of SLC5A3 primers was determined using a temperature gra-dient program. Reactions were carried out in a C1000 Thermal Cycler (BioRad, Munich, Deutschland). A first cycle of 30 s at 98°C was followed by 10 s at 98°C, 20 s at 48°C (SLC5A3) or 60°C (actin) and 50 s at 72°C for 26 cycles. A final extension step for 5 min at 72°C was fol-lowed by cooling to 4°C.
The amplified fragments were analyzed using ethidium bromide stained 1% agarose gels in sodium borate buffer [30]. A DNA molecular weight marker (FastRuler Middle Range DNA Ladder, Fermentas) was run on every gel to confirm the expected molecular weight of the PCR products. Images of the gels were acquired using a Gel iX-System (Intas, Göttingen, Deutsch-land) and quantification of the actin bands intensities were determined by ImageJ software (US National Institutes of Health). mRNA expression of SLC5A3 was normalized toβ-actin. The correctness of the amplified SLC5A3 PCR product was verified by sequence analysis (GATC, Konstanz, Germany).
Cloning
cloning vector pJET (Fermentas) using the CloneJET PCR Cloning Kit (Fermentas). After-wards the insert was cloned into the vector pEGFPN1 (Clonetech) in frame with the GFP cod-ing sequence uscod-ing the BAMHI restriction sites (restriction sites at the insert were delivered by the amplification primers). The correctness of SLC5A3-EGFP construct was verified by se-quencing (GATC, Konstanz, Deutschland).
Immunoblotting
Membrane protein extraction from hypotonically treated and isotonic cell samples was carried out using Mem-PER Plus Membrane Protein Extraction Kit (Pierce, Perbio, Bonn, Germany). The cells were seeded out into T25 cell culture flasks and grown to*90% confluence. Hypo-tonic stress was induced by substitution of the isoHypo-tonic CGM with diluted 100-mOsm CGM. The cells were exposed to hypotonicity for 10, 20, and 30 min at room temperature. Thereafter, membrane proteins were extracted from isotonic and hypotonic samples, according to the manufacturer’s recommendations. Protein concentrations were determined using the Roti-Quant Universal assay (Roth, Karlsruhe, Germany). For each experimental condition, equal amounts of protein (*10μg) were subjected to SDS-PAGE on 10% polyacrylamide gels and
blotted onto a nitrocellulose membrane (life technologies, Darmstadt, Germany). After the transfer, the membranes were stained with Ponceau-S solution (0.5% Ponceau-S in 1% acetic acid) and analyzed as described elsewhere [31]. The Ponceau-S stained membranes were scanned with a flatbed scanner (Canon LiDE 110), and the blot images were analyzed with the ImageJ software. The blots were then blocked with 5% bovine serum albumin in TBST (1% Tween-20 in TRIS buffered saline), for 1h at room temperature. Thereafter the blots were incu-bated with the primary antibody rabbit anti-SLC5A3 (ab110368; abcam, Cambridge, UK; 1:1000) over night at 4°C. After washing, the blots were incubated for 1 h at room temperature with a horseradish peroxidase conjugated anti-rabbit antibody (New England Biolabs; 1:2000). Bound antibodies were visualized with tetramethyl benzidine (TMB) solution for immunoblots (life technologies, Darmstadt, Germany). Western blots were scanned (Canon LiDE 110), and band densities were determined using the ImageJ software. The results were corrected for back-ground and protein loading differences (determined by Ponceau-S staining).
Confocal laser microscopy
HEK293 cells were transiently transfected with the SLC5A3-EGFP construct using FuGene HD (Promega) according to the manufacturer’s instructions, inμ-slide flow chambers (IBIDI,
Mu-nich, Germany). Microscopic analysis was performed*30 hours after transfection.
Confocal fluorescence images were taken with an LSM 710 using a Plan-Apochromat 63x/ 1.40 oil immersion objective (Zeiss, Jena, Germany) and argon laser light excitation at 488 nm. Fluorescence intensity distribution was quantified using ImageJ software. The cross section through a hypotonic cell was selected to match that for isotonic conditions. Hypotonicity was applied to cells by replacing isotonic CGM with 100-mOsm myo-inositol-substituted medium. Confocal images were analyzed with theplot profilefunction of ImageJ software.
d
STORM (
direct
stochastic optical reconstruction microscopy)
1 h at 37°C, and then washed twice with PBS. Hypotonic shock was applied by substitution of isotonic PBS with 100-mOsm inositol- (or sucrose-) substituted medium. Control isotonic samples were incubated in PBS. Cell fixation without permeabilization was performed by treat-ment with 4%(v/v) formaldehyde (Sigma) for 30 min.
Cells were then washed with PBS, and incubated for 1h at room temperature with 5% (w/v) BSA (Sigma) in PBS to prevent nonspecific antibody binding. Afterwards, cells were incubated for 30 min in 5% (w/v) BSA in PBS comprising 1:500 mouse mAB anti-SLC5A3 clone 3A6 (SAB1402920, Sigma) at room temperature. Specificity of the primary antibody was verified by comparing the SLC5A3-EGFP-signal with the fluorescence signal derived from immunolabel-ing with Alexa Fluor 568 (data not shown). Accordimmunolabel-ing to the SLC5A3 protein structure pre-dicted in [34] the primary antibody recognizes an extracellular epitope. The cells were then washed thoroughly with PBS and incubated in Alexa Fluor 647-conjugated F(ab0)2 fragments of goat anti-mouse-IgG (A-21237, Invitrogen) 1:200 diluted in 5% (w/v) BSA in PBS for 20 min at room temperature. The negative control sample was incubated with the secondary antibody alone. Afterwards cells were thoroughly washed with PBS and post-fixated in 4% (v/v) formaldehyde in PBS for 10 min.
dSTORM of Alexa Fluor 647 was performed in 100 mMβ-mercaptoethylamine (MEA; Sigma) in PBS, pH 7.4–8.0 (with KOH), containing an oxygen scavenger system of 5–10 u/ml glucose oxidase (Sigma),*120 u/ml catalase (Sigma) and 4% w/v glucose [27]. To illuminate only a thin membrane layer highly inclined illumination mode was used. For excitation of Alexa Fluor 647 a laser emitting at 639 nm (Genesis MX STM 640; Coherent, USA) was used. For eachdSTORM image, 15.000 frames were recorded with an exposure time of typically 15 ms and at a frame rate of*65 Hz and constant irradiation intensity ranging between 1 and 5 kW cm-2.
For data processing and image reconstruction, the open access software for single-mole-cule–based localization microscopy rapidSTORM 3.2 [35,36] was used as previously described [27]. For analysis only fluorescent spots that contain more than 769 photons were used. Multi-fluorophore events were identified by point-spread function analysis [36] and discarded. For each cell, the density of Alexa Fluor 647 localizations was calculated as the number of localized fluorophores per cellular membrane cross-section area, determined from the corresponding transmitted light image.
Results
Swelling activated myo-inositol permeability
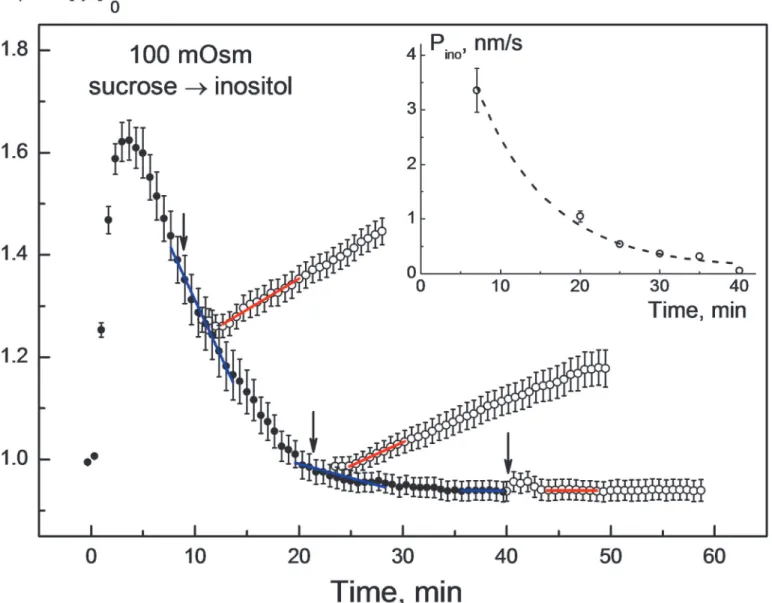
In agreement with previous studies on numerous mammalian cell lines [23,25], hypotonically swollen HEK293 cells are capable of RVD in strongly hypotonic sucrose-substituted solutions (Fig. 1). As seen inFig. 1(filled symbols), 100-mOsm sucrose solution caused the cells to swell rapidly within*2–3 min from their isotonic volume (v0= 1) to a transient maximum
vmax1.6. After that the cells shrank gradually and recovered their original isotonic volume
within*20 min after hypotonic shock. The occurrence of RVD clearly shows that, despite their permeability to cytosolic electrolytes, swelling-activated membrane pathways in HEK293 cells are impermeable to the disaccharide sucrose.
secondary swelling with a rateΔv/Δtinoof*1.8 10–4s-1occurred if inositol was added shortly
after the onset of RVD (t7 min). Thereafter,Δv/Δtinoprogressively decreased the later
inosi-tol was applied, e.g. to*1.5 10–4s-1at 20 min. After*40 min, 100-mOsm myo-inositol did not cause any significant cell swelling. TheΔv/Δtinovalues were determined from the slopes of
the red fitted lines (Fig. 1). The corresponding RVD ratesΔv/ΔtRVD(indicated byblue lines) Fig 1. Changes in the normalized volumev= V/V0of HEK293 cells in response to sequential application of sucrose andmyo-inositol solutions of the same osmolality of 100 mOsm.The cells were bathed initially (time<*30 s) in isotonic growth medium (300 mOsm) and then exposed to a 100-mOsm sucrose solution. The strongly hypotonic sucrose solution (filled symbols) caused fast cell swelling to a transient maximum volumevmaxof*1.6 within
the first 2–3 min. After the initial swelling, the cells underwent RVD, i.e. they gradually shrank to reach the original isotonic volume (v01) within*20 min in
the presence of sucrose. The replacement of sucrose by an equiosmotic amount ofmyo-inositol (arrows) abolished RVD and caused secondary cell swelling (empty symbols). The rate of secondary swelling (Δv/Δtino,red fitted lines) decreased with time during and after RVD (7–35 min). The addition ofmyo-inositol 40 min after hypotonic shock did not cause any significant cell swelling. Each data point represents the mean±SE of 25–42 individual cells measured in 2–3 independent experiments. For each time point ofmyo-inositol addition, the rates of RVDΔv/ΔtRVD(blue lines) and the rates of secondary swellingΔv/Δtino
(red lines) were determined to calculate the permeability coefficients for myo-inositolPinoby applying Eqs.1and2. The inset illustrates the decay ofPinowith
time during RVD.
were*8 10–4, 2 10–4and 0 s-1, respectively, for the time intervals 7, 20, and 40 min after hypotonic shock.
By applying Eqs.1and2to theΔv/ΔtRVDandΔv/Δtinodata derived from the volumetric
curves shown inFig. 1, we calculatedPinovalues during RVD and plotted them against the
total time of hypotonic exposure (insetinFig. 1). For these calculations we used a mean radius of HEK293 cellsR0= 7.9μm,Ciel¼100mOsm, andCoel¼15mOsm, according to our
experi-mental conditions. Shortly after the onset of RVD (t7 min),Pinowas*3.3 nm/s. After that,
Pinodecreased steadily with time and vanished at*40 min after hypotonic shock. These data
clearly show that after a transient activation ofmyo-inositol pathways by hypotonic swelling, cells restore their original membrane impermeability to myo-inositol during RVD.
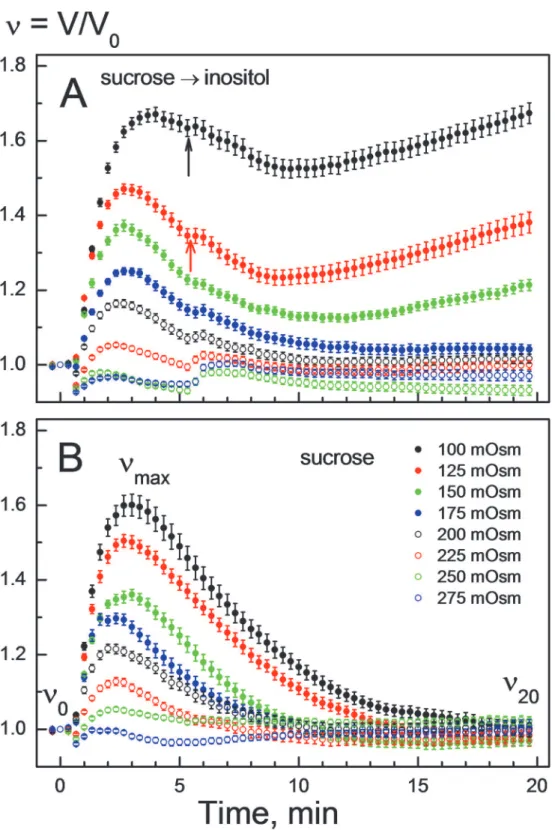
To analyze the impact of osmolality on swelling-activated membrane permeability to myo-inositol, we conducted volumetric experiments by varying the tonicity of perfusion solutions over a wide range, i.e. from mildly hypotonic (e.g. 275 mOsm) to strongly hypotonic conditions (100 mOsm). In the experiments illustrated inFig. 2A, the cells were first exposed to a hypo-tonic sucrose solution, which was replaced, shortly after the onset of RVD (t5 min), by a myo-inositol solution of the same osmolality. For comparison,Fig. 2Bshows the volumetric data of cells treated with hypotonic sucrose solutions only. Independent of osmolality, the di-saccharide allowed RVD in HEK293 cells over the entire tonicity range studied (Fig. 2B).
Under mild hypotonic conditions of 200–275 mOsm, isosmotic replacement of sucrose by myo-inositol had little, if any, effect on the RVD of HEK293 cells (open symbolsinFig. 2A). But at osmolalities below 175 mOsm, myo-inositol not only abolished RVD but also induced secondary cell swelling (filled symbolsinFig. 2A). The cells achieved the fastest swelling rates (Δv/Δtino) not immediately but with a delay of about 4-min after application of myo-inositol.
After that (t>9 min), cell volume increased linearly with time. Therefore, we derived theΔv/
Δtinovalues for the time interval 9–14 min after hypotonic shock. At tonicities between 175
and 275 mOsm, cell swelling was negligible (Δv/Δtino0), whereas at 150, 125 and 100 mOsm
theΔv/Δtinovalues were 0.2 10−4, 1.8 10−4and 1.9 10−4s−1, respectively. The corresponding
rates of RVD (Δv/ΔtRVD), derived from the data shown inFig. 2Bfor the time interval 10 ±
2 min, were*4 10−4, 6.8 10−4, 7.8 10−4s−1in 150-, 125- and 100-mOsm sucrose solutions,
respectively.
By substituting theΔv/ΔtRVDvalues intoEq. 1, we first calculated the permeability
coeffi-cients for electrolytePel[nm/s] during RVD at different osmolalities. For these calculations we
usedCi
el¼ ð100 275ÞmOsmandCoel¼15mOsm, according to our experimental conditions.
After that, the permeability coefficients for myo-inositolPino[nm/s] were calculated by
apply-ingEq. 2and using the correspondingPelvalues andΔv/Δtinodata of myo-inositol-mediated
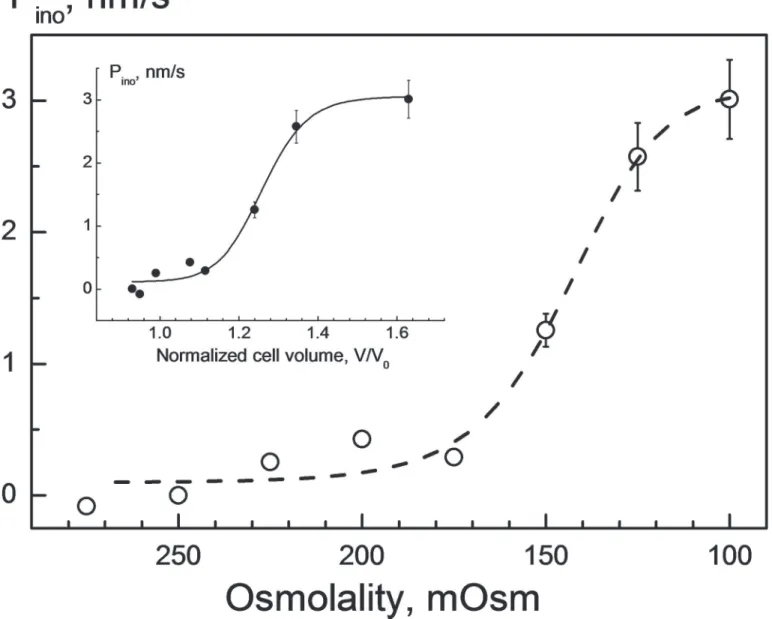
swelling. The dependence ofPinoon osmolality is illustrated inFig. 3. In contrast to the inset in
Fig. 1, which illustrates the reduction ofPinowith time during RVD in 100-mOsm sucrose
solu-tion,Fig. 3shows near-maximalPinovalues revealed shortly after the onset of RVD in cells
ex-posed to a wide range of tonicities (Fig. 2).
As seen inFig. 3(symbols),Pinowas relatively low, i.e. between*0 and*0.3 nm/s, under
mild hypotonic conditions of 175–275 mOsm. But decreasing osmolality below 175 mOsm re-sulted in a rapid increase ofPino, e.g. to*3 nm/s at 100 mOsm. Fitting the data to a sigmoidal
function (Eq. 3) yields aC50value of 144 ± 10 mOsm corresponding to the tonicity of
half-maximal activation ofmyo-inositol permeability. The inset inFig. 3shows the samePinodata
plotted versus the cell volumev= V/V0duringmyo-inositol application. Fitting withEq. 3
gives av50value of*1.26, indicating that half-activation ofPinowas induced by an about 26%
Intracellular localization of SLC5A3-EGFP affected by hypotonicity
In the following experiments we address the solute carrier protein SLC5A3 as a possible candi-date for a swelling-activated transporter of myo-inositol in cells exposed to severe hypotonic conditions. We have shown previously [23–25] that transport pathways for a range of small carbohydrate molecules including the polyols myo-inositol and sorbitol are inserted into the
Thereafter (t9–20 min) the cells exhibited sustained secondary swelling (A), which is indicative of myo-inositol uptake by cells. For each tonicity, the rates of RVDΔv/ΔtRVDand secondary swellingΔv/Δtinowere
used to calculate the permeability coefficients for electrolytesPeland inositol by applying Eqs.1and
2, respectively.
doi:10.1371/journal.pone.0119990.g002
Fig 3. Impact of hypotonicity on the myo-inositol permeabilityPinoin HEK293 cells.ThePinovalues were calculated usingEq. 2from the rates of
secondary swelling, using the volumetric data shown inFig. 2A. The fit ofEq. 3to the data yielded aC50value of 144±10 mOsm, i.e. the tonicity at which the
myo-inositol permeability was half-activated. In the inset, the samePinodata are plotted as function of the cell volume at the time point ofmyo-inositol
plasma membrane from cytosolic vesicles via swelling-mediated exocytosis in strongly hypo-tonic solutions (*100 mOsm). This finding prompted us to analyze the impact of hypotonic shock on the intracellular localization of the myo-inositol transporter SLC5A3. To this end, we constructed an SLC5A3-EGFP fusion protein and overexpressed it in HEK293 cells by tran-sient transfection. Thirty hours after plasmid transfection, we evaluated the expression and lo-calization of SLC5A3-EGFP in cells by confocal laser scanning microscopy. Endogenous expression of SLC5A3 mRNA in HEK293 cells was proved in separate experiments using semi-quantitative RT-PCR (seebelow).
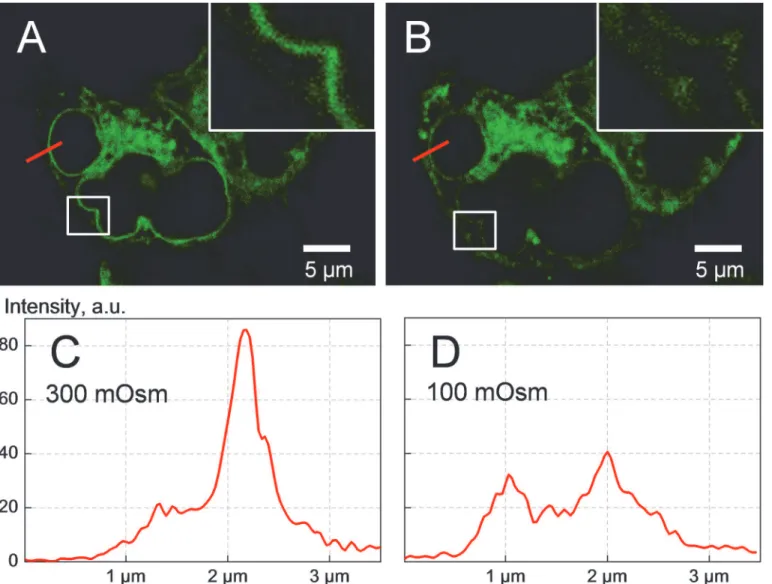
As evident from the microphotographs shown inFig. 4, the transfected cells express the fu-sion protein mainly in the cytoplasm, whereas the nuclei are practically devoid of fluorescence. Moreover, under isotonic conditions (Fig. 4A), the fluorescence is mainly localized in the endo-plasmic reticulum and close to the nuclear envelope, which seems to be typical for
Fig 4. Confocal fluorescence imaging of HEK293 cells overexpressing the fusion protein SLC5A3-EGFP.The imagesAandBwere taken, respectively, under isotonic conditions and 10 min after application of a strongly hypotonic 100-mOsm myo-inositol-substituted solution. Hypotonic cell swelling is clearly seen in (B). The insets and the intensity diagrams (CandD) illustrate the impact of hypotonic stress on the intracellular distribution of the fusion protein. Comparison of the diagramsCandDreveals a marked hypotonicity-mediated depletion of the protein in the perinuclear regions along with its increase in the peripheral cytoplasm. Together, these findings suggest that hypotonic swelling caused translocation of a large portion of SLC5A3-EGFP towards the plasma membrane.
overexpressed membrane proteins [37]. In contrast, the dim fluorescence of the peripheral cy-toplasm suggests that only a small portion of the fusion protein resides in/near the plasma membrane in control isotonic cells. The subcellular protein distribution in isotonic cells, pre-sented by the intensity diagram inFig. 4C(along the radial red-colored lines indicated in
Fig. 4A) clearly shows a major perinuclear peak with a magnitude of*85 a.u. at x2.2μm
and a minor shoulder at x1.2μm corresponding to the peripheral cytoplasm/
plasma membrane.
Besides the expected increase in cell size (compareFig. 4B vs 4A), the exposure of cells to a strongly hypotonic myo-inositol solution (100 mOsm) causes marked changes in the subcellu-lar localization of SLC5A3-EGFP. Comparison of the radial intensity distributions revealed that the perinuclear fluorescence (x2μm inFig. 4C and 4D) decreases by*50%, i.e. from the
isotonic 85 a.u. to the hypotonic 40 a.u. At the same time, the plasma membrane peak increases from*20 to 30 a.u. The intensity diagrams clearly show that hypotonic shock leads to consid-erable displacement of SLC5A3-EGFP from the perinuclear area towards the plasma mem-brane. This effect is also evident from the magnified views of the marked box areas given in the insets ofFig. 4A and 4B.
Hypotonicity-induced changes in SLC5A3 protein associated with the
plasma membrane
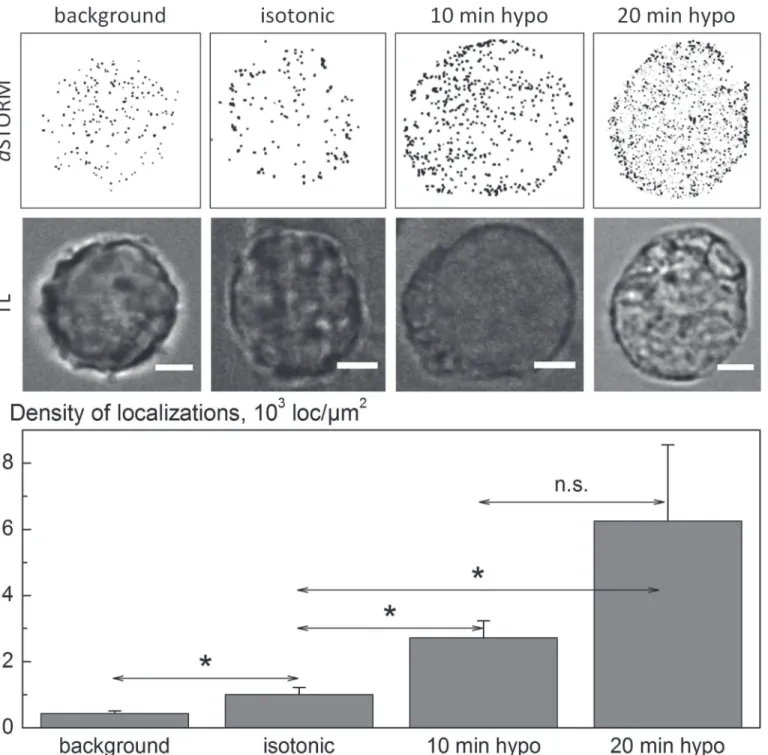
The fluorescence images inFig. 4suggest, but do not definitely prove, that hypotonic swelling is accompanied by the insertion of SLC5A3-EGFP into the plasma membrane. Therefore, we further analyzed the impact of hypotonic stress on the amount of native SLC5A3 protein asso-ciated with the plasma membrane of HEK293 cells by super-resolution imaging. In the experi-ments illustrated byFig. 5, we exposed the cells to a 100-mOsm inositol solution for 10 and 20 min. Cells treated with isotonic PBS served as control. To ensure selective labeling of mem-brane-associated SLC5A3 proteins, we used a primary antibody directed against an extracellu-lar epitope of SLC5A3 protein. Prior todSTORM imaging, we applied a secondary antibody conjugated with the photoswitchable fluorescent dye Alexa Fluor 647.
As illustrated by the representative images inFig. 5, hypotonic cells exhibit an increased amount of membrane-associated SLC53A molecules, as compared to isotonic control. The amounts of SLC53A localizations found in single cells, such as shown in inFig. 5, were subject to some variation. Therefore, we compared the mean numbers of SLC53A localizations per unit membrane area (localization densities, [loc/μm2]) from 8–16 individual cells for each
os-motic condition. As evident from the bar graph inFig. 5, the mean density of SLC5A3 localiza-tions in isotonic cells is comparable to the background level observed after staining with the secondary antibody only.
Application of a strongly hypotonic myo-inositol solution for 10 and 20 min, respectively, results in an*3 and 6-fold increase in localization density. The observed increase with time might have been associated with the continuous swelling of cells exposed to 100-mOsm myo-inositol (seeFig. 2B), which was used for thedSTORM analysis illustrated inFig. 5. The mem-brane-associated SLC5A3 in cells undergoing RVD in 100-mOsm sucrose showed completely different kinetics (Supporting information,S1 Fig.). Thus, comparison of thedSTORM and volumetric data reveals that 5 min after hypotonic exposure transiently swollen cells (vmax
1.6,Fig. 1B) exhibit the highest density of SLC5A3 localizations (1.5 102loc/μm2,S1 Fig.). But
Fig 5.dSTORM imaging of immunolabeled SLC5A3 protein in the plasma membrane of HEK293 cells under isotonic and hypotonic conditions.
Images of the same cells in transmitted light (TL) are also shown. From thedSTORM images (reconstructed from 15,000 single frames), the surface membrane density of SLC5A3 localizations [loc/μm2] were identified in individual cells. The bar graph shows the impact of hypotonic stress on the surface
membrane density of SLC5A3 protein localizations. The data are means (±SD) from 8–16 individual cells for each osmotic condition and hypotonic stress duration. The differences in the mean values between the isotonic control and the two hypotonic samples were statistically significant (as denoted by*;P<
0.05), according to the Mann-Whitney test conducted using the Software Origin 9 (Microcal, Northampton, MA). The difference between the two hypotonic samples (10 vs 20 min) was not significant (n.s.).
Impact of hypotonicity on the expression of SLC5A3
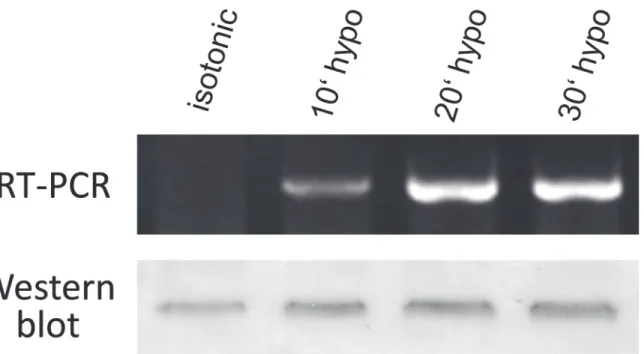
The results presented above clearly show that acute hypotonic stress induces massive changes in the cell membrane permeability to myo-inositol within few minutes (Figs.1–3). These changes are very likely associated with a rapid incorporation of the myo-inositol transporter SLC5A3 into the plasma membrane from the preexisting cytosolic pool (Figs.4and5). To prove whether SLC5A3 gene transcription and translation are also triggered by hypotonicity we analyzed the impact of hypotonic treatment on the expression of SLC5A3 gene. Prior to RNA and protein extractions, aliquots of HEK293 cells were exposed to hypotonic 100-mOsm CGM. At different time intervals of hypotonic treatment (10, 20 and 30 min), the total mRNA and membrane proteins were extracted and analyzed, respectively, by semiquantitative RT-PCR and Western blot. As seen inFig. 6(upper part), the expression of mRNA for SLC5A3 was negligible in isotonic control cells, whereas Western blot analysis revealed a detectable iso-tonic level of SLC5A3 protein.
Incubation of HEK293 cells in hypotonic solution for 10–30 min gave rise to a significant upregulation of the expression of SLC5A3 mRNA (Fig. 6, upper part). Within the same time interval, hypotonic stress also led to a moderate increase in the SLC5A3 protein level as illus-trated by the representative Western blot inFig. 6(lower part). After hypotonic treatment for 10, 20 and 30 min, the normalized SLC5A3 protein band densities were increased with respect to isotonic control, respectively, by 43±3%, 39±14%, and 21±4% (means±ranges of two independent experiments). Together, the results inFig. 6demonstrate a significant hypotonic activation of the SLC5A3 gene expression in HEK293 cells at both transcriptional and transla-tional levels.
Fig 6. Hypotonic stress-induced upregulation of SLC5A3 at the mRNA and protein level in HEK293 cells revealed by semiquantitative RT-PCR and Western blot, respectively.Prior to RNA and protein extractions, the cells were incubated in 100-mOsm CGM for 10–30 min. Control cells were kept in isotonic CGM. The SLC5A3 mRNA level in isotonic sample was negligible, whereas hypotonicity induced substantial amounts of SLC5A3 mRNA. As with RT-PCR, Western blot analysis shows increased amounts of SLC5A3 protein (by up to*40%,seetext) in hypotonic samples. For RT-PCR,β-actin was used as a template loading control (seeSupporting information,S2 Fig., upper image). Prior to immunoblotting, reversible Ponceau-S protein staining has been used as a loading control (S2 Fig., lower image).
Discussion
The volumetric data presented in Figs.1and2Aclearly show that below a tonicity threshold of
*200 mOsm myo-inositol causes marked secondary swelling of HEK293. In sharp contrast, the disaccharide sucrose allows the cells to accomplish RVD even under severe hypotonic con-ditions (Fig.1and2B). The secondary swelling is a clear-cut indication ofmyo-inositol influx through swelling-activated pathways. This explanation is consistent with previous reports demonstrating that various small solutes, including monomeric carbohydrates, amino acids, organic and inorganic ions inhibit RVD via swelling-activated uptake of these molecules by cells [25,38,39].
As evident fromFig. 2A, a significant activation of myo-inositol permeability requires at least a 50% reduction of external osmolality from 300 to 150 mOsm. This finding corroborates the results of previous studies demonstrating that in various cell lines/types the transport of myo-inositol, sorbitol and other monomeric carbohydrates usually occurs when cells are ex-posed to strongly hypotonic solutions. For example, human neuroblastoma cells have been re-ported to release3H-inositol at tonicities of 200 mOsm and below [40]. Similarly, the efflux rate of3H-inositol from primary rat astrocytes has been found to increase rapidly with decreas-ing osmolality from 180 to 100 mOsm [41], which agrees very well with ourPinodata presented
inFig. 3. Consistent with the efflux studies, the influx of myo-inositol and sorbitol into Jurkat lymphocytes has been activated by cell swelling in strongly hypotonic 100-mOsm solution, but not at 200 mOsm [23,25]. Moreover, various monomeric sugars (glucose, deoxy-glucose, galac-tose) and small polyethylene glycols (PEG300–400) also permeate the plasma membrane of a wide range of cell types (e.g. Jurkat lymphocytes, human glioblastoma, human dendritic cells) exposed to strongly hypotonic solutions of*75–100 mOsm [24,42–44].
In the present study, the plasma membrane of HEK293 cells swollen by 60–70% (vmax1.6–
1.7; Figs.1and2) in a 100-mOsm solution exhibits a permeability coefficient for myo-inositol
Pinoof*3 nm/s (Fig. 3). Interestingly, thisPinovalue derived here from the kinetics of cell
swelling driven by myo-inositol influx agrees well with the permeability coefficient of*1.5 nm/s obtained for the efflux of H3-labeled sorbitol from IMCD cells swollen by*50% [45]. Moreover, transiently activated by cell swelling, the membrane permeability to both solutes de-cays rapidly during RVD, as illustrated for myo-inositol by the inset inFig. 1and for H3 -sorbi-tol byFig. 1in [45].
Hypotonicity induced changes in the expression/localization of the myo-inositol transporter SLC5A3 revealed here by confocal fluorescence microscopy (Fig. 4),dSTORM (Fig. 5) and mRNA determination (Fig. 6) strongly suggests this protein as a possible pathway underlying the swelling-activated membrane permeability to myo-inositol (Figs.1–3). SLC5A3 protein, aka Na+myo-inositol transporter SMIT, has been reported to be activated in response to hy-pertonic conditions [13,46,47]. In the present study we provide the first evidence that acute hy-potonic stress induces massive changes in the expression and intracellular localization of SLC5A3. These changes include (i) the displacement of a large portion of the protein from the cytosolic compartments towards the plasma membrane (Fig. 4), (ii) the incorporation of SLC5A3 into the plasma membrane (Fig. 5), and (iii) upregulation of SLC5A3 gene expression (Fig. 6). An important finding is that both the swelling-activated membrane permeability and SLC5A3 protein displacement occurs on the same time scale, i.e. around 10 min, after hypotonic shock.
dSTORM analysis of membrane-associated SLC5A3 reveals*2 103fluorophore localiza-tions perμm2in HEK293 cells exposed for 10 min to 100-mOsm myo-inositol (Fig. 5). Cells
treated with 100-mOsm sucrose exhibit a much lower SLC5A3 density (*2 102loc/μm2,S1
hypotonic myo-inositol and sucrose solutions, respectively, in which cells exhibit secondary swelling (Fig. 2A) and accomplish RVD, during which the myo-inositol permeability rapidly decays (Fig. 1).
Although fluorescence labeling of SLC5A3 with primary and secondary antibodies is neither quantitative nor stoichiometric, the observed localization densities can serve as a first useful es-timate for the number of transporter molecules per unite membrane area (nSLC). Assuming
that in our experiments the membrane-associated SLC5A3 provided the major route for the uptake of myo-inositol by hypotonically swollen cells, we can assess the myo-inositol transfer rate by a single SLC5A3 transporter. The transporter rate is denoted hereafter askino
[myo-ino-sitol molecules s−1]. The following equation relates the molar myo-inositol fluxJ[mol s−1m−2]
through the membrane to myo-inositol permeabilityPino[m s-1], transporter ratekinoand
SLC5A3 surface densitynSLC:
Jino ¼PinoDcino ¼kinonslc=NA ð4Þ
whereNAstands for the Avogadro constant (6.02 1023mol-1).Equation 4transforms into the
following expression forkino:
kino¼PinoDcinoNA=nslc ð5Þ
To calculatekino, we used aPinovalue of 3 nm/s and a membrane surface density of SLC5A3,
nSLC= (0.2–2)×103proteins/μm2, both derived for HEK293 cells, respectively, from the
volu-metric anddSTORM experiments (Figs.3and5). The initial difference in inositol concentra-tion across the membraneΔcinowas*85 mmol/L (seeMaterials and Method). Substitution of
these experimental data intoEq. 5yields an estimate for the transporter ratekinoof80–800
myo-inositol molecules/s.
Until now SLC5 proteins with known functions have commonly been analyzed by
electrophysiological techniques because these proteins can operate as electrogenic cotranspor-ters [48]. Particularly, the SLC5A3 protein expressed inXenopusoocytes has been reported to cotransport myo-inositol with aKmof*50μM and Na+with aKmin the 10-mM range
[15,48]. On the other hand, members of the SLC5 family are also known to behave as Na+ uni-porters, solute and water channels [15]. In addition to the reported mechanisms, the results of our volumetric experiments conducted in Na+-free solutions (Figs.1–3) suggest the facilitated diffusion (uniport) as the most likely mechanism for the SLC5A3-mediated influx of myo-ino-sitol in the presence of large extracellular concentrations of this solute.
As pointed out elsewhere [49], the rate of solute translocation across the membrane is an important experimental criterion distinguishing transporters from channels. Whereas a single ion channel usually allows the passage of 106–108ions/s, a membrane transporter operates at a much lower rate, typically within the range of 102–103solute molecules/s (see [49], p. 274). Judging from the moderate transfer rate of 80–800 substrate molecules/s found here, SLC5A3 protein appears to function as a transporter rather than a channel.
Taken together, our data provide several lines of evidence that the myo-inositol transporter SLC5A3 is activated by an acute hypotonic shock. In view of the large cytosolic concentrations of myo-inositol in mammalian cells (*1 mM) [25], this carrier protein can play an important role in the RVD process in a variety of cell types and lines. During RVD, SLC5A3 can provide a route not only for the release of cytosolic myo-inositol, but also for a wide range of related mo-nomeric carbohydrates, including glucose, galactose, etc., as demonstrated for this protein ex-pressed inXenopusoocytes [22].
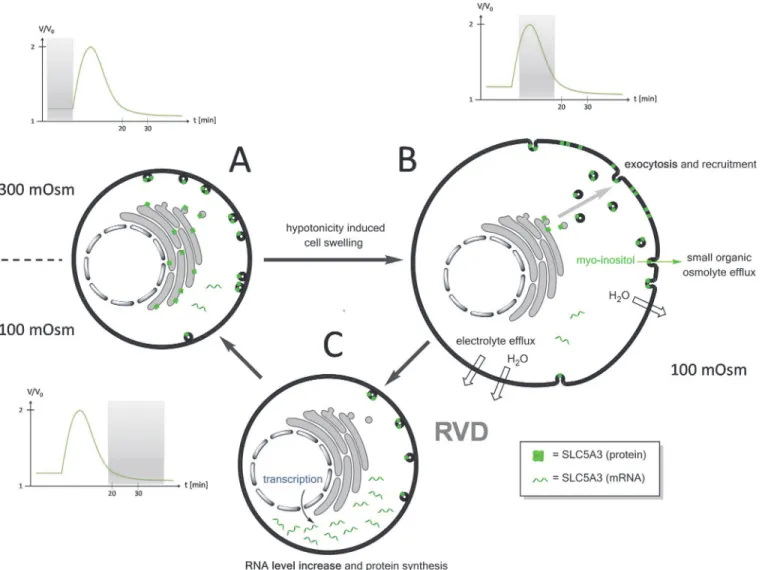
Based on the results presented here and previous studies [23,24] we propose the following model for the involvement of SLC5A3 in the RVD process (Fig. 7). The model includes several events triggered by the initial cell swelling in response to a tonicity decrease below a threshold
Fig 7. A putative mechanism of SLC5A3-mediated myo-inositol release during RVD. A:Under isotonic conditions the SLC5A3 protein is mainly localized in the cytosolic vesicles and its mRNA level is low. The plasma membrane permeability to SOOs and electrolytes is poor.B:Exposure of cells to a strongly hypotonic solution, e.g. 100-mOsm sucrose, causes rapid volume increase followed by cell shrinkage via RVD (seeFig. 1). The swelling-associated increase in the plasma membrane area is achieved (i) by unfolding of microvilli and (ii) by exocytotic fusion of cytosolic vesicles [23]. The fusion of vesicles carrying SLC5A3 protein leads to the incorporation of this transporter into the plasma membrane. The SLC5A3-mediated efflux of myo-inositol and related SOO contributes to cell shrinkage (RVD) and restoration of the original isotonic cell volume.C:During RVD, the cells recover the original membrane impermeability to myo-inositol (Fig. 1), presumably, via the endocytosis of excessive plasma membrane along with reinternalization and, possibly, lysosomal degradation of SLC5A3. The increased mRNA and protein expression of SLC5A3 (Fig. 6) suggest thatde novosynthesis of SLC5A3 occurs to restore the depleted cytoplasmic pool of the transporter.
of*150 mOsm (Fig. 3). In the first step, the membrane area increases via the swelling mediat-ed exocytosis (fusion) of cytosolic vesicles [23]. The incorporation of SLC5A3 proteins from vesicles renders the plasma membrane permeable to myo-inositol. In the absence of extracellu-lar SOOs, the cells undergo RVD by releasing myo-inositol and related compounds from the cytosol. In 100-mOsm sucrose medium, the cells accomplish RVD within 20 min after hypo-tonic shock (Fig. 1B). During RVD, the cells recover the original membrane impermeability to myo-inositol (Fig. 3), presumably, via the endocytosis of excessive plasma membrane along with re-internalization and, possibly, lysosomal degradation of SLC5A3.
Exocytosis and vesicular fusion appear to be common activation mechanisms among the SLC family members. Many physiologically important SLC transporters, including the glucose transporter GLUT4 (SLC2A4), as well as the neurotransmitter transporters SLC18A1,
SLC18A2 and SLC18A3 are known to be regulated by exocytosis [50,51]. The betaine-GABA-transporter SLC6A12 (BGT-1), involved in the transport of the SOO betaine, has been shown to be relocated from cytosol to the plasma membrane upon hypertonic stimulation [52]. Other SLC-proteins operating as SOO transporters (e.g. SLC6A6, SLC6A12, etc.) can also be expected to be activated during cell volume regulation via similar mechanisms involving exocytosis.
In conclusion, several experimental approaches, including cell volumetry, EGFP tagging, immunocytochemistry, mRNA determination and Western blot analysis, confocal and super-resolution fluorescence microscopy used here provided new insights into the mechanisms of swelling-activated transport of the small organic osmolyte myo-inositol. Whereas the volumet-ric data yielded information on the osmotic thresholds for membrane permeability, the combi-nation of confocal and subdiffraction-resolution microscopy were useful for monitoring the hypotonicity-induced changes in the intracellular distribution of the myo-inositol transporter SLC5A3. Although this study focuses on the hypotonically induced uptake of myo-inositol, similar regulatory mechanisms for the transport of structurally dissimilar organic solutes medi-ated by different SLC transport systems can also be operational in a wide range of mammalian cell types.
Supporting Information
S1 Fig.dSTORM imaging of immunolabeled SLC5A3 protein in the plasma membrane of
HEK293 cells under isotonic (PBS) and hypotonic conditions.In these experiments, the cells were treated with a strongly hypotonic 100-mOsm sucrose solution for 5 and 10 min. In con-trast to the experiments with 100-mOsm myo-inositol presented inFig. 5, the cells underwent RVD in the presence of the disaccharide sucrose, as evident fromFig. 1B. (For further detail see Legend toFig. 5)
(TIF)
S2 Fig. Loading controls for semiquantitative RT-PCR (β-actin) and Western blot (Pon-ceau-S staining) analyses.For further detailseetext and Legend toFig. 6.
(TIF)
S1 Video. A time-lapse video clip illustrating the response of HE293 cells to a strongly-hy-potonic sucrose-substituted medium.The cells were bathed initially in isotonic growth medi-um (300 mOsm) and then exposed (at zero time) to a 100-mOsm sucrose solution.
(AVI)
S1 Text. Model of swelling-activated myo-inositol transport
Author Contributions
Conceived and designed the experiments: JA VLS. Performed the experiments: JA SUP KMW TK TH. Analyzed the data: JA RS TH MS VLS. Contributed reagents/materials/analysis tools: MS VLS. Wrote the paper: JA RS MS VLS.
References
1. Hoffmann EK, Lambert IH, Pedersen SF. Physiology of cell volume regulation in vertebrates. Physiol Rev. 2009; 89: 193–277. doi:10.1152/physrev.00037.2007PMID:19126758
2. Lang F, Busch GL, Ritter M, Völkl H, Waldegger S, Gulbins E, et al. Functional significance of cell vol-ume regulatory mechanisms. Physiol Rev. 1998; 78: 247–306. PMID:9457175
3. McManus ML, Churchwell KB, Strange K. Regulation of cell volume in health and disease. N Engl J Med. 1995; 333: 1260–1266. PMID:7566004
4. Pasantes-Morales H, Lezama RA, Ramos-Mandujano G, Tuz KL. Mechanisms of cell volume regula-tion in hypo-osmolality. Am J Med. 2006; 119: S4–11. PMID:17059912
5. Lang F. Effect of cell hydration on metabolism. Nestlé Nutr Inst Workshop Ser. 2011; 69: 115–126.
6. Bobak N, Bittner S, Andronic J, Hartmann S, Mühlpfordt F, Schneider-Hohendorf T, et al. Volume regu-lation of murine T lymphocytes relies on voltage-dependent and two-pore domain potassium channels. Biochim Biophys Acta. 2011; 1808: 2036–2044. doi:10.1016/j.bbamem.2011.04.013PMID:21575593
7. Andronic J, Bobak N, Bittner S, Ehling P, Kleinschnitz C, Herrmann AM, et al. Identification of two-pore domain potassium channels as potent modulators of osmotic volume regulation in human T lympho-cytes. Biochim Biophys Acta. 2013; 1828: 699–707. doi:10.1016/j.bbamem.2012.09.028PMID:
23041580
8. Fernández JM, Di Giusto G, Kalstein M, Melamud L, Rivarola V, Ford P, et al. Cell volume regulation in cultured human retinal Müller cells is associated with changes in transmembrane potential. PloS One. 2013; 8: e57268. doi:10.1371/journal.pone.0057268PMID:23451196
9. Kinne RK. Mechanisms of osmolyte release. Contrib Nephrol. 1998; 123: 34–49. PMID:9761960
10. Junankar PR, Kirk K. Organic osmolyte channels: a comparative view. Cell Physiol Biochem Int J Exp Cell Physiol Biochem Pharmacol. 2000; 10: 355–360.
11. Wehner F, Olsen H, Tinel H, Kinne-Saffran E, Kinne RKH. Cell volume regulation: osmolytes, osmolyte transport, and signal transduction. Rev Physiol Biochem Pharmacol. 2003; 148: 1–80. PMID:
12687402
12. Kirk K. Swelling-activated organic osmolyte channels. J Membr Biol. 1997; 158: 1–16. PMID:9211717
13. Kwon HM, Handler JS. Cell volume regulated transporters of compatible osmolytes. Curr Opin Cell Biol. 1995; 7: 465–471. PMID:7495565
14. Fenili D, Weng Y-Q, Aubert I, Nitz M, McLaurin J. Sodium/myo-Inositol transporters: substrate transport requirements and regional brain expression in the TgCRND8 mouse model of amyloid pathology. PloS One. 2011; 6: e24032. doi:10.1371/journal.pone.0024032PMID:21887366
15. Wright EM. Glucose transport families SLC5 and SLC50. Mol Aspects Med. 2013; 34: 183–196. doi:
10.1016/j.mam.2012.11.002PMID:23506865
16. Bitoun M, Tappaz M. Gene expression of taurine transporter and taurine biosynthetic enzymes in hyperosmotic states: a comparative study with the expression of the genes involved in the accumula-tion of other osmolytes. Adv Exp Med Biol. 2000; 483: 239–248. PMID:11787603
17. Chauvin TR, Griswold MD. Characterization of the expression and regulation of genes necessary for myo-inositol biosynthesis and transport in the seminiferous epithelium. Biol Reprod. 2004; 70: 744– 751. PMID:14613899
18. Tong EHY, Guo J-J, Huang A-L, Liu H, Hu C-D, Chung SSM, et al. Regulation of nucleocytoplasmic trafficking of transcription factor OREBP/TonEBP/NFAT5. J Biol Chem. 2006; 281: 23870–23879. PMID:16782704
19. Woo SK, Dahl SC, Handler JS, Kwon HM. Bidirectional regulation of tonicity-responsive enhancer bind-ing protein in response to changes in tonicity. Am J Physiol Renal Physiol. 2000; 278: F1006–1012. PMID:10836989
21. Kwon MS, Lee SD, Kim J-A, Colla E, Choi YJ, Suh P-G, et al. Novel nuclear localization signal regulat-ed by ambient tonicity in vertebrates. J Biol Chem. 2008; 283: 22400–22409. doi:10.1074/jbc.
M710550200PMID:18579527
22. Hager K, Hazama A, Kwon HM, Loo DD, Handler JS, Wright EM. Kinetics and specificity of the renal Na+/myo-inositol cotransporter expressed in Xenopus oocytes. J Membr Biol. 1995; 143: 103–113. PMID:7537337
23. Kiesel M, Reuss R, Endter J, Zimmermann D, Zimmermann H, Shirakashi R, et al. Swelling-activated pathways in human T-lymphocytes studied by cell volumetry and electrorotation. Biophys J. 2006; 90: 4720–4729. PMID:16565059
24. Sukhorukov VL, Imes D, Woellhaf MW, Andronic J, Kiesel M, Shirakashi R, et al. Pore size of swelling-activated channels for organic osmolytes in Jurkat lymphocytes, probed by differential polymer exclu-sion. Biochim Biophys Acta. 2009; 1788: 1841–1850. doi:10.1016/j.bbamem.2009.06.016PMID:
19560440
25. Reuss R, Ludwig J, Shirakashi R, Ehrhart F, Zimmermann H, Schneider S, et al. Intracellular delivery of carbohydrates into mammalian cells through swelling-activated pathways. J Membr Biol. 2004; 200: 67–81. PMID:15520905
26. Heilemann M, van de Linde S, Schüttpelz M, Kasper R, Seefeldt B, Mukherjee A, et al. Subdiffraction-resolution fluorescence imaging with conventional fluorescent probes. Angew Chem Int Ed Engl. 2008; 47: 6172–6176. doi:10.1002/anie.200802376PMID:18646237
27. Van de Linde S, Löschberger A, Klein T, Heidbreder M, Wolter S, Heilemann M, et al. Direct stochastic optical reconstruction microscopy with standard fluorescent probes. Nat Protoc. 2011; 6: 991–1009. doi:10.1038/nprot.2011.336PMID:21720313
28. Kleinhans FW. Membrane permeability modeling: Kedem-Katchalsky vs a two-parameter formalism. Cryobiology. 1998; 37: 271–289. PMID:9917344
29. Shirakashi R, Sukhorukov VL, Tanasawa I, Zimmermann U. Measurement of the permeability and re-sealing time constant of the electroporated mammalian cell membranes. Int J Heat Mass Transf. 2004; 47: 4517–4524.
30. Brody JR, Kern SE. Sodium boric acid: a Tris-free, cooler conductive medium for DNA electrophoresis. BioTechniques. 2004; 36: 214–216. PMID:14989083
31. Romero-Calvo I, Ocón B, Martínez-Moya P, Suárez MD, Zarzuelo A, Martínez-Augustin O, et al. Re-versible Ponceau staining as a loading control alternative to actin in Western blots. Anal Biochem. 2010; 401: 318–320. doi:10.1016/j.ab.2010.02.036PMID:20206115
32. Van de Linde S, Aufmkolk S, Franke C, Holm T, Klein T, Löschberger A, et al. Investigating cellular structures at the nanoscale with organic fluorophores. Chem Biol. 2013; 20: 8–18. doi:10.1016/j.
chembiol.2012.11.004PMID:23352135
33. Löschberger A, van de Linde S, Dabauvalle M-C, Rieger B, Heilemann M, Krohne G, et al. Super-reso-lution imaging visualizes the eightfold symmetry of gp210 proteins around the nuclear pore complex and resolves the central channel with nanometer resolution. J Cell Sci. 2012; 125: 570–575. doi:10.
1242/jcs.098822PMID:22389396
34. Kwon HM, Yamauchi A, Uchida S, Preston AS, Garcia-Perez A, Burg MB, et al. Cloning of the cDNa for a Na+/myo-inositol cotransporter, a hypertonicity stress protein. J Biol Chem. 1992; 267: 6297–6301. PMID:1372904
35. Wolter S, Schüttpelz M, Tscherepanow M, VAN DE Linde S, Heilemann M, Sauer M. Real-time compu-tation of subdiffraction-resolution fluorescence images. J Microsc. 2010; 237: 12–22. doi:10.1111/j.
1365-2818.2009.03287.xPMID:20055915
36. Wolter S, Löschberger A, Holm T, Aufmkolk S, Dabauvalle M-C, van de Linde S, et al. rapidSTORM: ac-curate, fast open-source software for localization microscopy. Nat Methods. 2012; 9: 1040–1041. doi:
10.1038/nmeth.2224PMID:23132113
37. Snapp EL, Lajoie P. Imaging of Membrane Systems and Membrane Traffic in Living Cells. Cold Spring Harb Protoc. 2011; 2011: pdb.top066548. doi:10.1101/pdb.top066548
38. Pasantes-Morales H, Murray RA, Sánchez-Olea R, Morán J. Regulatory volume decrease in cultured astrocytes. II. Permeability pathway to amino acids and polyols. Am J Physiol. 1994; 266: C172–178. PMID:8304414
39. Grinstein S, Clarke CA, Dupre A, Rothstein A. Volume-induced increase of anion permeability in human lymphocytes. J Gen Physiol. 1982; 80: 801–823. PMID:7175489
41. Isaacks RE, Bender AS, Kim CY, Shi YF, Norenberg MD. Effect of osmolality and anion channel inhibi-tors on myo-inositol efflux in cultured astrocytes. J Neurosci Res. 1999; 57: 866–871. PMID:10467258
42. Sukhorukov VL, Reuss R, Endter JM, Fehrmann S, Katsen-Globa A, Gessner P, et al. A biophysical ap-proach to the optimisation of dendritic-tumour cell electrofusion. Biochem Biophys Res Commun. 2006; 346: 829–839. PMID:16780801
43. Djuzenova CS, Krasnyanska J, Kiesel M, Stingl L, Zimmermann U, Flentje M, et al. Intracellular delivery of 2-deoxy-D-glucose into tumor cells by long-term cultivation and through swelling-activated pathways: implications for radiation treatment. Mol Med Rep. 2009; 2: 633–640. doi:10.3892/mmr_00000149 PMID:21475878
44. Memmel S, Sukhorukov VL, Höring M, Westerling K, Fiedler V, Katzer A, et al. Cell surface area and membrane folding in glioblastoma cell lines differing in PTEN and p53 status. PloS One. 2014; 9: e87052. doi:10.1371/journal.pone.0087052PMID:24498019
45. Kinne RK, Tinel H, Kipp H, Kinne-Saffran E. Regulation of sorbitol efflux in different renal medullary cells: similarities and diversities. Cell Physiol Biochem Int J Exp Cell Physiol Biochem Pharmacol. 2000; 10: 371–378.
46. Lang F. Mechanisms and significance of cell volume regulation. J Am Coll Nutr. 2007; 26: 613S–623S. PMID:17921474
47. Kempson SA, Montrose MH. Osmotic regulation of renal betaine transport: transcription and beyond. Pflüg Arch Eur J Physiol. 2004; 449: 227–234.
48. Coady MJ, Wallendorff B, Gagnon DG, Lapointe J-Y. Identification of a novel Na+/myo-inositol cotran-sporter. J Biol Chem. 2002; 277: 35219–35224. PMID:12133831
49. Gennis RB. Biomembranes: molecular structure and function. Springer-Verlag New York; 1989.
50. Uldry M, Thorens B. The SLC2 family of facilitated hexose and polyol transporters. Pflüg Arch Eur J Physiol. 2004; 447: 480–489.
51. Eiden LE, Schäfer MK-H, Weihe E, Schütz B. The vesicular amine transporter family (SLC18): amine/ proton antiporters required for vesicular accumulation and regulated exocytotic secretion of mono-amines and acetylcholine. Pflüg Arch Eur J Physiol. 2004; 447: 636–640.