SCIENTOMETRIC ANALYSIS OF CONTRIBUTIONS TO JOURNAL OF SCIENTIFIC AND INDUSTRIAL RESEARCH
Dr. P. RAJENDRAN University Librarian,
SRM University, SRM Nagar,
Kattangulathur – 603 203. TN [email protected]
Dr. R.JEYSHANKAR Assistant Professor
Department of Library and Information Science Alagappa University
Karaikudi, Tamil Nadu [email protected]
B. ELANGO Librarian,
IFET College of Engineering, IFET Nagar, Gangarampalayam
Villupuram – 605 108. TN. [email protected]
ABSTRACT
Scientometric analysis of 633 research articles published in Journal of Scientific and Industrial Research has been carried out. Five Volumes of the journal containing 60 issues from 2005 – 2009 have been taken into consideration for the present study. The number of contributions, authorship pattern & author productivity, average citations, average length of articles, average keywords and collaborative papers has been analyzed. Out of 633 contributions, only 51 are single authored and rest by multi authored with degree of collaboration 0.92 and week collaboration among the authors. Pattern of Co-Authorship revealed that the improving trend of co-authored papers. The study revealed that the author productivity is 0.34 and dominated by the Indian authors.
KEYWORDS: Scientometrics, Bibliometrics, Journal of scientific and Industrial Research,
Publication, Author Productivity, Collaboration pattern INTRODUCTION
The term scientometrics is often used with the meaning as the bibliometrics, originated in Russia. The application of quantitative methods to the history of science, Scientometrics is the science of measuring the science, which involves counting artifacts to the production & use of information and arriving conclusions from the counts.
Bibliometrics / Scientometrics research includes studies related to the scattering & growth of literature, author productivity, obsolescence of documents, distribution of scientific literature by country, by language, etc, which helps to monitor the growth & pattern of research.
Pritchard (1969) [1] described the Bibliometrics as the application of mathematics and statistical methods to books and other media.
Scientometric research is devoted to quantitative studies of science and technology – according to A.F.J.Van Raan [2].
Scientometrics applies the bibliometric techniques to science and examines the development of the sciences [3].
Main areas of Scientometrics are individual scientific documents, authors, scientific institutions, academic journals and regional aspects of science [4].
In this paper, an attempt has been made to analyze the contributions to Journal of Scientific and Industrial Research published during the year 2005 – 2009, in order to explore
the author pattern, collaborative research, keywords and length of the papers among the contributions. This study covers the 633 articles of 60 issues published.
SOURCE
Journal of Scientific and Industrial Research was selected as the source journal for
the present research study. The Journal was started in 1942 and published monthly, by National Institute of Science communication and Information Resources (NISCAIR), a premier institution of CSIR, New Delhi. It serves as an information link between generators and users of technologies and addresses to entrepreneurs, technologists, engineers, technocrats and scientists on one hand and planners, administrators and managers on the other [5]. Original research articles of interest to industry, reviews on frontiers of science and technology, articles on management and policies relating to science, technology and industrial applications are the major coverage of publications.
The journal publishes articles in the following broad subject headings.
Scientific Research (Application-based)
Industrial Research (R & D)
Industrial Research (Utilization)
Industrial Development
S & T Management and
Industrial Management LITERATURE REVIEW
Srimurugan A & Nattar S [6] analyzed the D-LIB magazine published during 2000 – 2007 which revealed that highest number of paper was published in 2005 and the lowest in 2007.
Vijay K R & Raghavan I [7] analyzed the Journal of Food Science & Technology published during 2000 – 2004 and found that above 93% of contributions were by multiple authors.
A Scientimetric Analysis on Indian Journal of Physics was made by Nattar S [8] during 2004 – 2008 which revealed that the year 2004 records the highest % of contributions regarding single, two and three authored.
Kannappanavar B U, Swamy C & Vijay Kumar M [9] analyzed the publishing trends of Indian Chemical Scientists during 1996 – 2000, which revealed average number of authors per paper has increased from 7.52 to 8.39.
An attempt was made by Tilak Hazarika, Kusuma Goswami & Pritimoni Das [10] to analyze the contributions of Indian Forestor which found Degree of Collaboration was 0.64 among the authors.
Guan & Ma [11] examined the China’s Semiconductor Literature and found mega authored papers records the higher value for Co-Authorship Index.
Senthamilselvi & Srinivasa Raghavan [12] analyzed the issues of IEEE Trans on Power Electronics published during 2006 – 2008 which revealed that maximum number of papers was published between 6 – 10 pages category.
A bibliometric study has been carried out by Kalyane V L and Sen B K [13] on the Journal of Oilseeds Research published during 1984 – 1992 which revealed that the keyword “Groundnut” tops the list with 53 records.
Sanni S A and Zainab A N [14] examined the contributions published in Medical Journal of Malaysia during 2004 – 2008 and found 4.82% (28) of contributions were published by Malaysian authors with foreign collaboration.
OBJECTIVES OF THE STUDY The objectives of this study are
to map the year wise distribution of papers
to examine the authorship pattern & author productivity
to determine the degree of collaboration
to assess the pattern of Co-Authorship
to identify collaborative pattern
to find the average length of papers
to find the average keywords SCOPE AND METHODOLOGY
The present study tries to find out the literature growth, authorship and collaboration pattern, average length of articles and average keywords in the source journal. Five volumes (Vol. No.110 to No.119) of Journal of Scientific and Industrial Research, published between
manually into it from the journal itself. The details regarding number of papers, nature of author, keywords and length of papers are collected to fulfill the objectives of the present study. The collected data was analyzed with the following bibliometric indicators.
Extent of Authorship Pattern (Single vs. Multiple)
Degree of Collaboration
Co-Authorship Index LIMITATIONS
Since the journal publishes Reviews, Research Papers, Research Reports and Book Reviews, this study is based only on the Research Papers.
This study is limited to research papers published between 2005 and 2009 only. RESULTS AND DISCUSSION
Year wise distribution of papers
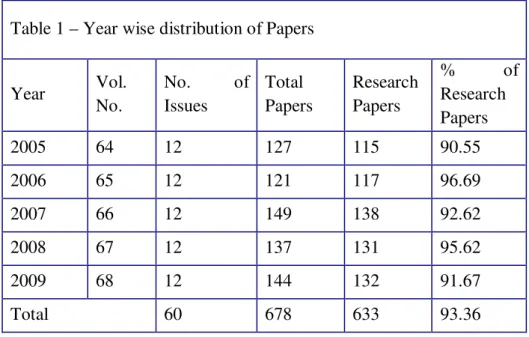
Table 1 shows the distribution of research articles published in Journal of Scientific and Industrial Research during 2005 – 2009. The total of 633 research articles was published with an average of 126.6 articles per year. Out of 633 articles, the highest number of research articles were published in the year 2007 with 138 research articles (11.50 articles per issue) followed by the 2009 ; 132 articles, 2008 ; 131 articles, 2006 ; 117 articles and the lowest number of articles were published in the year 2005 with 115 articles (9.58 articles per issue).
The average number of papers per year is 126 during the study period and the similar type of result has been drawn by Umamaheswari S [15] in the Indian Journal of Agronomy.
Table 1 – Year wise distribution of Papers
Year Vol.
No.
No. of
Issues
Total Papers
Research Papers
% of
Research Papers
2005 64 12 127 115 90.55
2006 65 12 121 117 96.69
2007 66 12 149 138 92.62
2008 67 12 137 131 95.62
2009 68 12 144 132 91.67
Total 60 678 633 93.36
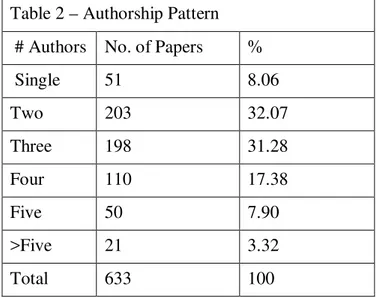
Authorship Pattern
authors. 8.06 % of articles were published by single authors. 7.90% of articles were published by five authors. Only 3.32% of articles were published by more than five authors. But the trend of the author pattern in the journal shows that the team size was two to four.
Table 2 – Authorship Pattern
# Authors No. of Papers %
Single 51 8.06
Two 203 32.07
Three 198 31.28
Four 110 17.38
Five 50 7.90
>Five 21 3.32
Total 633 100
Authorship Pattern year wise
The data pertaining to authorship pattern year wise have been given in the Table No.3. Regarding single authored contributions, the years 2005, 2006 & 2007 have the highest contributions with 11 and the lowest in 2009. Regarding double authored contributions, the year 2009 has the highest contributions with 55. The year 2007 has the highest contributions regarding three, four & five authored contributions with 47, 28 & 14 respectively. The year 2008 has the highest contributions of multi authored (more than five authors) with 7.
Table 3 – Authorship Pattern year wise
Year # Authors
1 2 3 4 5 >5
2005 11 40 31 19 9 5
2006 11 29 45 22 5 5
2007 11 36 47 28 14 2
2008 10 43 39 23 9 7
2009 8 55 36 18 13 2
Total 51 203 198 110 50 21
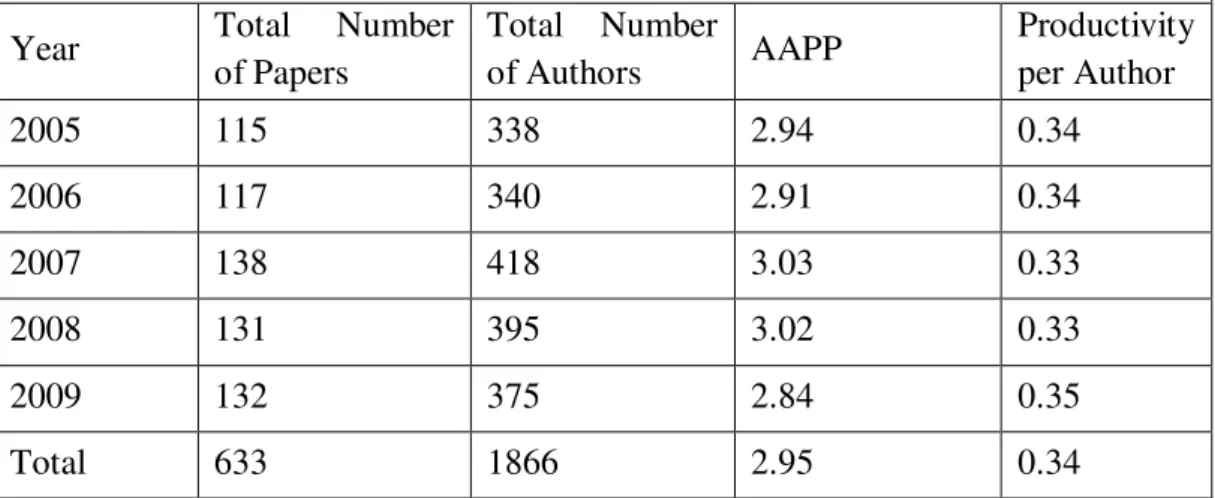
Author Productivity
years 2005 & 2006 has the relatively equal average number of authors per article when compared the total average number of authors per article.
The average productivity per author is 0.34 during the year 2005 - 2009. The years 2005 & 2006 has the relatively equal productivity per author when compared to the average productivity. Productivity has been calculated with the following formula [18].
Average Authors per Paper = No. of Authors / No. of Papers Productivity per Author = No. of Papers / No. of Authors
Table 4 – Author Productivity
Year Total Number
of Papers
Total Number
of Authors AAPP
Productivity per Author
2005 115 338 2.94 0.34
2006 117 340 2.91 0.34
2007 138 418 3.03 0.33
2008 131 395 3.02 0.33
2009 132 375 2.84 0.35
Total 633 1866 2.95 0.34
Degree of Collaboration
In order to determine the strenth of Collaboration (DC), the following formula suggested by Subramanyam K [19] has been employed.
Where, DC = Degree of Collaboration
Nm = Number of Multiple Authored Papers
Ns = Number of Single Authored Papers
The Degree of Collaboration of authors by year wise is presented in the Table 5. The degree of collaboration ranges from 0.90 to 0.94. The average degree of collaboration is 0.92 during the period 2005 – 2009 and it brings out clearly that there exists a higher level of collaboration in the journal. The similar type of result has been drawn by Rajinikanth, et al [20] in the Journal of Surveying Engineering.
Table 5 : Degree of Collaboration
Year Single Multiple DC
2005 11 104 0.94
2006 11 106 0.90
2008 10 121 0.92
2009 8 124 0.94
Total 51 582 0.92
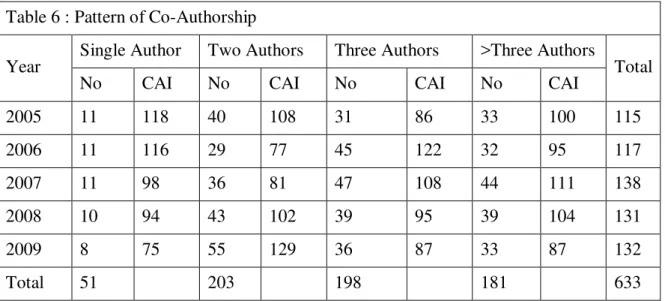
Pattern of Co-Authorship
In order to assess the Pattern of Co-Authorship (CAI), the following formula suggested by Garg and Padhi [21] has been employed.
Where,
Nij = Number of papers having authors in block i
Nio = Total output of block i
Noj = Number of papers having j authors for all blocks
Noo = Total number of papers for all authors and all blocks
CAI = 100 implies that a country's co-authorship effort for a particular type of authorship corresponds to the world average, CAI > 100 reflects higher than average co-authorship effort, and CAI < 100 lower than average co-authorship effort by that country for a given type of authorship pattern.
For calculating the co-authorship index for authors, countries have been replaced by block. For this study, the authors have been classified into four blocks, vz Single, Two, Three and more than three authors and the results of Co-authorship index as per the formula have been presented in the Table No.6.
Table 6 : Pattern of Co-Authorship
Year Single Author Two Authors Three Authors >Three Authors Total
No CAI No CAI No CAI No CAI
2005 11 118 40 108 31 86 33 100 115
2006 11 116 29 77 45 122 32 95 117
2007 11 98 36 81 47 108 44 111 138
2008 10 94 43 102 39 95 39 104 131
2009 8 75 55 129 36 87 33 87 132
Total 51 203 198 181 633
fluctuation trend of CAI for multi authored contributions. The similar type of result has been drawn by Jeyshankar R, et al [22] in the Current Science.
Distribution of Pages
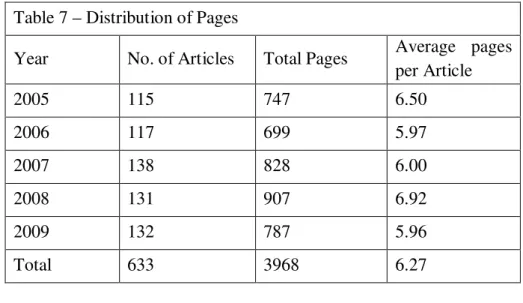
Table 7 shows that 633 papers published with a total page of 3968 (average 6.27 pages per article) during the year 2005 – 2009. It is observed that the average length of the articles varied from a minimum of 5.96 pages to a maximum of 6.92 pages. The similar type of result has been drawn by Kamal Lochan Jena [23] in the Indian Journal of Fibre and Textile Research. The year 2008 has highest average page per paper with 6.92 pages while the year 2009 has the lowest average page per paper with 5.96.
Table 7 – Distribution of Pages
Year No. of Articles Total Pages Average pages per Article
2005 115 747 6.50
2006 117 699 5.97
2007 138 828 6.00
2008 131 907 6.92
2009 132 787 5.96
Total 633 3968 6.27
Average Keywords per Article
Table 8 – Average Keywords per Article
Year No. of Articles Total Keywords
Average
keywords per paper
2005 115 558 4.85
2006 117 526 4.50
2007 138 597 4.33
2008 131 614 4.69
2009 132 582 4.41
Total 633 2877 4.55
4.85 keywords per paper while the year 2007 has the lowest average keywords per paper with 4.33. The overall average keywords per article are 4.55.
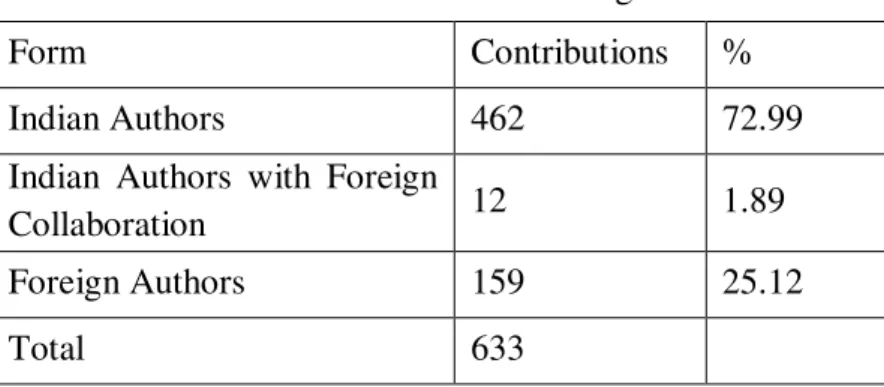
Distribution of Indian and Foreign Contributions
Table 9 shows that out of 633 articles, 462 (72.98%) articles published by Indian Authors followed by International Authors with 159 Articles (25.12%). Only 12 (1.89%) articles published by Indian Authors collaborated with international Authors and similar type of study has been conducted by Zainab A N, et al (2009) [24]. It seems that there was poor collaboration of Indian Authors with Foreign Authors. It is observed from the data that out of 60 issues, 6 issues having the contributions only by Indian Authors.
Table 9 - Distribution of Indian and Foreign Contributions
Form Contributions %
Indian Authors 462 72.99
Indian Authors with Foreign
Collaboration 12 1.89
Foreign Authors 159 25.12
Total 633
FINDINGS
The analysis revealed the following conclusions.
The maximum number of papers published in 2009 and minimum in 2005.
The highest number of research papers contributed by multiple authors during the study period.
The degree of collaboration was 0.92.
It is found that the average value for CAI was around 100 during the study period and it reflects the world average.
The author productivity is 0.34 and the average number of authors per paper is 2.95.
The average pages per paper are 6.27.
The average keywords per paper are 4.55.
The majority of the contributions are by Indian Authors (72.99%).
Papers by Indian Authors with Foreign Collaboration are minimal (1.89% of articles).
CONCLUSION
REFERENCES
[1] Pritchard, A. 1969. “Statistical Bibliography of Bibliographies.” Journal of Documentation, 25 (4):348-349.
[2] Van Raan, A.F.J. 1997. Scientometrics: State-of-the-art. Scientometrics, 38(1): 205 –
218.
[3] Virgil Diodato, Dictionary of Bibliometrics. New York: Haworth Press, 1994.
[4] Stock, W.G and Sonja, W. 2006. “Facets of Informetrics.” Information, 57 (8):
385-389.
[5] http://www.niscair.res.in
[6] Srimurugan, A and Nattar, S, 2009. “D-LIB Magazine: A Bibliometric Study.” Indian Journal of Information Science and Services, 3 (1): 1-4.
[7] Vijay, K R and Raghavan, I. 2007. Journal of Food Science and Technology: A Bibliometric Study. Annals of Library and Information Studies, 54 (4): 207-212.
[8] Nattar, S. 2009. “Indian Journal of Physics – A Scientometric Analysis.”
International Journal of Library and Information Science, 1(4): 055-061.
[9] Kannappanavar, B U, Swamy, C and Vijay Kumar, M. 2004. “Publishing Trend of Indian Chemical Scientists: A Bibliometric Study.” Annals of Library and Information Studies, 51 (1): 39-41.
[10] Tilak, H.K , Kusuma, G and Pritimoni, D. 2003. “Bibliometric Analysis of Indian Forestor : 1991 – 2000.” IASLIC Bulletin, 48 (4):213-223.
[11] Guan, J and Ma, N 2007 “A Bibliometric study of China’s Semiconductor Literature compared with other major asian countries.” Scientometric, 70 (1): 107-124.
[12] Senthamilselvi, A and Srinivasa Raghavan, S. 2010. “Scientometric Analysis of IEEE Transaction on Power Electronics.” Paper presented at the Sixth International Conference on Webometrics, Informetrics and Scientometrics & Eleventh COLLNET Meeting, Mysore on 19-22 October, 2010.
[13] Kalyane V L and Sen B K . 1995. “A Bibliometric Study of Journal of Oilseeds Research.” Annals of Library Science and Documentation, 42 (4):121-141.
[14] Sanni, S A and Zainab, A N. 2010. “Google Scholar as a source for citation and impact analysis for non-ISI indexed medical journal.” Malaysian Journal of Library and Information Science, 15 (3), 2010; pp.35-51.
[15] Umamaheswari S, 2008. “Scientometric Appraisal of Indian Journal of Agronomy.”
Indian Journal of Information Science and Services, 2 (1): 12-16.
[16] Nattar S, 2011. “Indian Journal of Chemistry: A Scientometric Analysis.”
International Journal of Library and Information Studies, 1 (1):7-15.
[17] Meyyappan N, Srinivasan R and Shanmugasigamani K, 1999. “Bibliometric Study on Electrochemical Research based on papers published in core journals.” Malaysian Journal of Library and Information Science, 2 (1): 1-11.
[19] Subramanyam, K. 1993. “Bibliometric Study of Research Collaboration : A Review.”
Journal of Information Science, 6 (1): 33-38.
[20] Rajinikanth A, et al, 2009. “A Bibliometric Analysis of Surveying Engineering Literature.” Indian Journal of Information Science and Services, 3 (1) :31-35.
[21] Garg, K C and Padhi, P. 1999. “Scientometrics of Laser Research Literature as viewed through the Journal of Current Laser Abstracts.” Scientometrics, 45 (2) :251 –
268.
[22] Jeyshankar R, Ramesh Babu B and Gopalakrishnan S. 2009. “Research Output in “Current Science” : A Bibliometric Study.” Indian Journal of Library and Information Science, 3 (3):173 – 182.
[23] Kamal, K.L. 2006. “A bibliometric analysis of the journal ‘Indian Journal of fibre and Textile Research 1996 – 2004.” Annals of Library and Information Studies, 53 (1): 22
– 30.
[24] Zainab A N, Anyi K W U and Anuar N B. 2006., “A Single Journal Study : Malaysian Journal of Computer Science.” Malaysian Journal of Computer Science 53
WEBSITES OF RESEARCH AND DEVELOPMENT INSTITUTIONS IN INDIA: A
WEBOMETRIC STUDY
JOICY A.J DR. REKHA RANI VARGHESE
MLIS Student Assistant professor
Dept. of Lib and Info. Sc. Dept. of Lib and Info. Sc.
Pondicherry University Pondicherry University
Puducherry- 605014 Puducherry- 605014
[email protected] [email protected]
ABSTRACT
The websites of Research and Development institutions have now emerged as the prime source of information regarding the institutions. Since website portal is an inseparable component of a Research and Development institutions, the websites of R & D institutions provide due importance to the library content / information on their homepage. Also the institution websites provide access to a lot of electronic content. Since this is the situation worldwide, the present study is an attempt to evaluate how the R & D Institutions in India present their content in the websites. Out of the 246 Research and Development institutions identified from the website http://www.indiaedu.com/research-institutes/research-institutes-india.html, 77 (31.30 per cent) properly functioning websites were analyzed. The study revealed that majority of the Research and Development institutions in India provide informative links to contacts, copyright, news and events, RTI and history. A few websites provide opportunity for user interaction in the form of feedback. It is also found that majority of the research and development institutions websites are good to navigate and find information.
Key Words: Research and Development Institution, Webometrics
1. Introduction
potential that India has to offer in the field of R&D, FICCI instituted a special wing dedicated to this sector.
The World Wide Web has revolutionized the communication scenario around the globe. The websites of Research and Development institutions have now emerged as the prime source of information regarding the institutions. Since website portal is an inseparable component of a Research and Development institution, the websites of R & D institutions provide due importance to the library content / information in their homepage. Also the institution websites/ web pages provide access to a lot of electronic content. Since this is the situation worldwide, the present study is an attempt to evaluate how the R & D Institutions in India present their content in their websites. The academic institutions in India, in particular the Research and Development institutions of today, are reaching to a new conquest by improving their service base especially with application of Information Technology for access and delivery of e-content to their clients. In this process they are also adapting to the change, altering their image, by executing new functions and providing varieties of services in an evolving continuum. The vast majority of institutions services are now Web-enabled and so attention is being focused on designing user-friendly and easily managed and maintained institutions websites. The present study attempts to evaluate the websites of the R&D institutions in India.
2. Related Studies
on information from college websites for evaluating the institution. A University’s website now is an important tool in the information gathering stage in the consumer decision making process. Potential student’s first impressions are influenced electronically via the website.
3. Objectives
The major objectives of the study are:
1. To find out the services and facilities provided on the Research and Development institutions websites in India.
2. To examine the design and usability of the websites of R & D institutions in India. 3. To investigate the user services and currency of information provided by the Research
and Development institutions websites in India.
4. To examine the application of Web 2.0 technologies on the websites of R & D institutions in India.
4. Methodology
The population of the study was the websites of the Research and Development institutions in India. The list of the R & D institutions was identified from the website http://www.indiaedu.com/research-institutes/research-institutes-india.html. Out of the 246 Research and Development institutions, 77 (31.30 per cent) properly functioning websites were analyzed. The data collection was carried out during the period 11th March 2011 to 10th April 2011.
5. Analysis and Interpretation
5.1 General Information
Table 1
General Information
General Information Yes No Total
History 62
(80.52%)
15 (19.48%)
77 (100%)
Location 52
(67.53%) (32.47%) 25 (100%) 77
News and Events 62
(80.52%)
15 (19.48%)
77 (100%)
RTI 56
(72.72%)
21 (27.27%)
77 (100%)
Sitemap 40
(51.95%)
37 (48.05%)
77 (100%)
5.2 Domain wise Analysis of R&D Institutions Websites
Domain wise analysis of R&D institutions websites in India were carried out and the results are given in Table 2. Analysis shows that a good number (40.26 per cent) of websites have .org domain followed by .res (28.57 per cent). Only a very few institutions (5.19 per cent) are having .gov domain. Nearly 25.78 percent of the Research and Development institutions are using different domains (.nic, .ac, .co, .in, .edu and ernet).
Table 2
General Information
Domain Number Percentage
.org 31 40.26
.res 22 28.57
.gov 4 5.19
Others 20 25.78
Total 77 100
5.3. Content wise Analysis of R&D Institutions Websites
Research and Development institutions websites contain very good search tool. Majority (61.04 per cent) of them has included staff details in a very good manner. Majority of the Research and Development institutions not provide much information on mission statement (51.95 per cent) and multimedia (54.55 per cent) contents. A good number (46.75 per cent) of the Research and Development institutions offer detailed information about their research projects.
Table 3
Content wise Analysis of R&D Institutions Websites
Contents Very Good Good Average Poor Total
Administrative Activities
38
(49.35%) (25.97%) 20 (3.90%) 3 (20.78%) 16 (100%) 77 Information about
Library
50 (64.94%)
4 (5.19%)
2 (2.60%)
21 (27.27%)
77 (100%)
Mission Statement 28
(36.36%)
8 (10.39%)
1 (1.30%)
40 (51.95%)
77 (100%)
Multimedia (28.57%) 22 (14.29%) 11 (2.60%) 2 (54.55%) 42 (100%) 77
Research Projects 36
(46.75%)
22 (28.57%)
4 (5.19%)
15 (19.48%)
77 (100%)
Search Tool (64.94%) 50 (5.19%) 4 (1.30%) 1 (28.57%) 22 (100%) 77
Staff Details (61.04%) 47 (10.39%) 8 (3.90%) 3 (24.68%) 19 (100%) 77
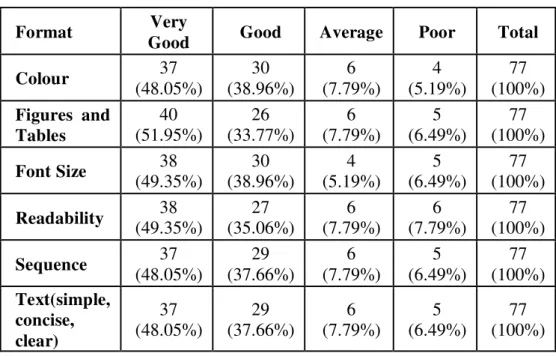
6.4 Format wise Analysis of R&D Institutions Websites
Table 4
Format wise Analysis of R&D Institutions Websites
Format Very
Good Good Average Poor Total
Colour (48.05%) 37 (38.96%) 30 (7.79%) 6 (5.19%) 4 (100%) 77
Figures and
Tables 40 (51.95%) 26 (33.77%) 6 (7.79%) 5 (6.49%) 77 (100%)
Font Size (49.35%) 38 (38.96%) 30 (5.19%) 4 (6.49%) 5 (100%) 77
Readability 38
(49.35%) 27 (35.06%) 6 (7.79%) 6 (7.79%) 77 (100%)
Sequence (48.05%) 37 (37.66%) 29 (7.79%) 6 (6.49%) 5 (100%) 77
Text(simple, concise, clear) 37 (48.05%) 29 (37.66%) 6 (7.79%) 5 (6.49%) 77 (100%)
6.5 Responsibility wise Analysis of R&D Institutions Websites
Table 5 shows the responsibility wise analysis of the websites of Research and Development institutions in India. Analysis reveals that majority (62.34 per cent) of the Research and Development institutions contain statement of responsibility. Most of the websites have phone number (97.40 percent), Fax (97.40 percent), Postal Address (98.70 percent) and E-mail address (89.61 percent). Nearly 72.72 per cent of the Research and Development institutions contain copyright information
Table 5
Responsibility wise Analysis of R&D Institutions Websites
Responsibility Yes No Total
Statement of responsibility (62.34%) 48 (37.66%) 29 (100%) 77
Contact Address
Phone (97.40%) 75 (2.60%) 2 (100%) 77
Fax (97.40%) 75 (2.60%) 2 (100%) 77
Postal Address (98.70%) 76 (1.30%) 1 (100%) 77
E-mail (89.61%) 69 (10.39%) 8 (100%) 77
6.6 Currency of Information
Currency of the information provided on the websites of Research and Development institutions in India are analyzed and given in Table 6. Analysis reveals that majority (77.92 percent) of the Research and Development institutions provide their current news on their websites. Nearly 49.35 per cent of the websites have last date of updation on their websites.
Table 6
Currency of Information wise Analysis of R&D Institutions Websites
Currency of
Information Yes No Total
Current News (77.92%) 60 (22.08%) 17 (100%) 77
Date of Updation (49.35%) 38 (50.64%) 39 (100%) 77
6.7 User Services wise Analysis of R&D Institutions Websites
Different user services provided by Research and Development institutions websites in India were analyzed and given in Table 7. Analysis shows that majority (76.62 per cent) of the Research and Development institutions have no provision for FAQ (Frequently Asked Questions) on their websites. Nearly 55.84 per cent of them have no help screens, but a good number (44.16 per cent) of them have help screens to assist users. Majority (50.65 per cent) of the institutions has the provision to ask questions on their websites.
Table 7
User Services wise Analysis of R&D Institutions Websites
User Services Yes No Total
FAQ 18
(19.48%)
59 (76.62%)
77 (100%)
Help Screens 34
(44.16%) (55.84%) 43 (100%) 77 Possible to
Ask Questions
39 (50.65%)
38 (49.35%)
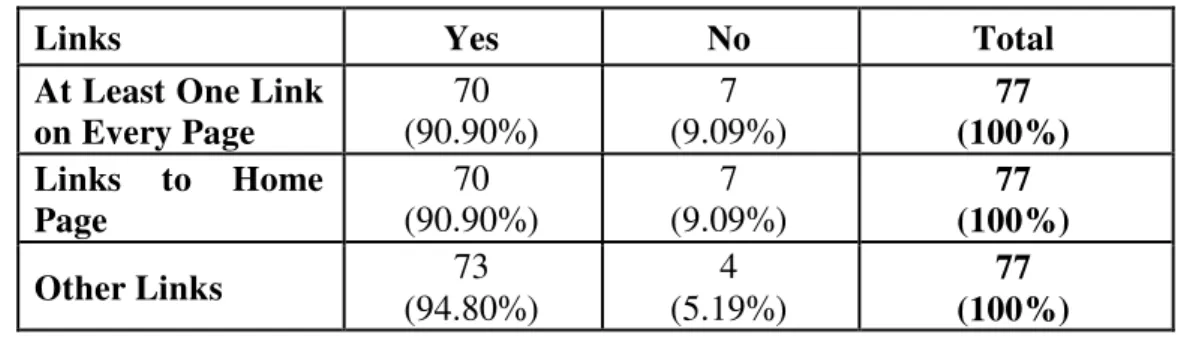
6.8 Links wise Analysis of R&D Institutions Websites
Table 8 shows that large majority (90.90 per cent) of the Research and Development institutions websites have at least one link on every page. Nearly 91 per cent of the institutions web pages have links to home page. Large majority (94.80 percent) of them have links to other websites also.
Table 8
Links wise Analysis of R&D Institutions Websites
Links Yes No Total
At Least One Link on Every Page
70
(90.90%) (9.09%) 7 (100%) 77 Links to Home
Page
70
(90.90%) (9.09%) 7 (100%) 77
Other Links 73
(94.80%)
4 (5.19%)
77 (100%)
6.9 Usability wise Analysis of R&D Institutions Websites
Usability of the websites is depends on some factors such as easy to navigate, easy to find information, any confusing information and easier to use. The usability of Research and Development institutions websites is analyzed and represented in Table 9.
Table 9
Usability wise Analysis of R&D Institutions Websites
Usability Very
Good Good Average No Total
Easy to Navigate 19 (24.68%) 51 (66.23%) 7
(9.1%) -
77 (100%) Easy to Find
Information 19 (24.68%) 51 (66.23%) 7
(9.1%) -
77 (100%) Any
Confusing Information
- - (3. 90%) 3 (96.10%) 74 77
(100%)
Easier to Use 19
(24.68%)
49 (63.64%)
9
(11.69%) -
77 (100%)
6.10 Design wise Analysis of R&D Institutions Websites
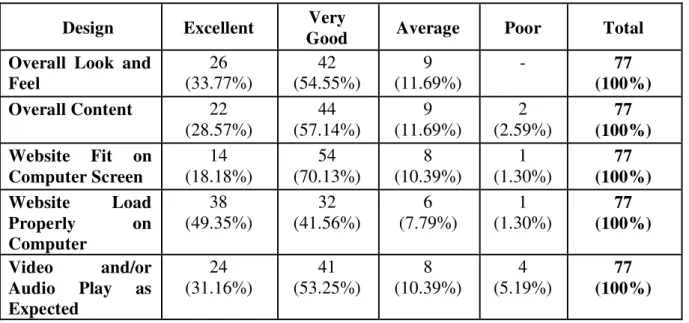
Table 10 shows the design wise analysis of the websites of Research and Development institutions in India. Analysis reveals that majority (54.55 per cent) of the websites have a very good look and feel. Nearly 57.14 per cent of the websites contents are very good. Majority of the websites fit on the computer screen (70.13 per cent) and excellently load websites on the computer (49.35 per cent). About 53.25 per cent of the websites play Video/Audio in a very good manner.
Table 10
Design wise Analysis of R&D Institutions Websites
Design Excellent Very
Good Average Poor Total
Overall Look and Feel
26
(33.77%) (54.55%) 42 (11.69%) 9 - (100%) 77
Overall Content 22
(28.57%) 44 (57.14%) 9 (11.69%) 2 (2.59%) 77 (100%) Website Fit on
Computer Screen
14
(18.18%) (70.13%) 54 (10.39%) 8 (1.30%) 1 (100%) 77
Website Load
Properly on
Computer 38 (49.35%) 32 (41.56%) 6 (7.79%) 1 (1.30%) 77 (100%)
Video and/or
Audio Play as
Expected 24 (31.16%) 41 (53.25%) 8 (10.39%) 4 (5.19%) 77 (100%)
6.11 Web 2.0 Application wise Analysis of R&D Institutions Websites
The investigator assessed the extent of use of web2.0 technologies on the websites of Research and Development institutions in India and given in Table 11. Analysis shows that most of the R&D institutions in India are not using Web 2.0 application such as RSS feeds and ATOM Index. A very few (2.60 per cent) Research and Development institutions have subscribed RSS feeds in their websites.
Table 11
Web 2.0 application wise Analysis of R&D Institutions Websites
Web 2.0 Yes No Total
RSS 2
7. Findings
The present investigation has achieved its objectives and it provides valuable information about the websites of Research and Development institutions in India. The major findings of the study are the following.
1. Out of the 246 Research and Development institutions in India, only 109 institutions have websites. Out of 109 websites, 77 websites are functioning properly.
2. A good number (40.26 per cent) of Research and Development institutions websites in India have .org domain followed by .res (28.57 per cent).
3. Majority of the websites contain very good search tool, figures and tables on their websites.
4. Most of the websites have phone number (97.40 percent), Fax (97.40 percent), Postal Address (98.70 percent) and E-mail address (89.61 percent). Majority of them contain copyright information (72.72 per cent) and statement of responsibility (62.34 per cent). 5. Majority (77.92 percent) of the research and development institutions provide their
current news on their websites. Nearly 49.35 per cent of the websites have last date of updation on their websites.
6. More than half of the institutions have the provision to ask questions and a good number of them have help screens to assist users.
7. Large majority (90.90 per cent) of the research and development institutions websites has at least one link on every page and each page has links to home page. Most of them have links to other websites.
8. Regarding usability, majority (66.23 per cent) of the research and development institutions websites are good to navigate and find information. Nearly 63.64 per cent of the websites are easy to use. Most (96.10 per cent) of the sites have no confusing information.
9. Majority (54.55 per cent) of the websites have a very good look and feel. Majority of the websites fit on the computer screen and excellently load websites on the computer. 10. Most of the R&D institutions in India are not using Web 2.0 applications such as RSS
feeds and ATOM Index. A very few (2.60 per cent) research and development institutions have subscribed RSS in their websites
8. Discussion
websites provide opportunity for user interaction in the form of feedback. A few websites provide links to mission statement, date-of- update. A good number of the Research and Development institutions provide their location and sitemap in their websites. This is a very useful feature for quick access of pages on lower levels of the website. About half of the libraries provide some information on their search tool of the site and information about library in their websites. Some of the websites are not well-structured and some of the websites have dead links. The websites should be well-structured and attractive and should offer a wide range of information. The correct use of title can produce improved results.
The websites should avoid arranging text over the whole width of the screen and should divide long texts into smaller sections. The texts should be large enough so that visitors can read it easily. The background color should be in contrast to the text color so that it doesn’t obscure anything. It’s a good practice to use web safe colors like a white on black or black on white combination for text colors and avoid animations and moving text. The Research and Development institutions websites should avoid using banners and images that take long time to load their websites. Instead use relevant images that have been optimized appropriately.
It is found that all the websites provide lists of links. A good number of the websites have search facility and links to other websites. The websites should provide simple and advanced searching facilities. The websites should limit the links included in a text and should provide links to as many documents as possible online. The websites should include links to the homepage and to every WebPages of the site so that visitors can navigate through the site with ease. The links should be clearly identified and point towards the right destination. The institutions should ensure that the websites ’navigation is easy to use and consistent.
9. Conclusion
This study gives an informative preview of the contents and design of Research and Development institutions websites in India. Although the Research and Development institutions have a web presence and varying levels of services, there is enormous scope for improving the websites. Most of the web users visit the best and highly rated sites in the world. If a Research and Development institutions website is more attractive and informative, it can easily capture the attention of library users and web surfers.
References
1. Archana, S. (2010, January 14). Web presence of the engineering college libraries in Kerala: An analysis of content. Kelpro Bulletin, pp. 35-47.
2. Bjornborn, L. (2004). Small- World Link Structures across an Academic Web Space:
A Library and Information Science Approach (PhD thesis, Copenhagen, Royal School
of Library and Information Science, 2004). Retrieved March 12, 2010, from http:// www.db.dk/lb/home_uk.html.
3. Bozena, M. (2002).The evaluation of the quality of the web-based library information Services. Quality in Libraries (2), 1-9.
4. Chand, Prakash. and P, Nishy. (2008, March). Strengthening R&D information systems through Library consortium: A case of CSIR laboratories. Annals of Library
andinformation studies, 55, pp.45-51.
5. Gopalakrishnan,S. Ambuja,R. and Seetharama, S. (2002). A Webometric study on library and Information science literature. Annals of Library and Information
Studies.49,1, pp.29-35
6. Haneefa, M., and Venugopal, A. (2010, June). Contents of national library websites in
Asia: An analysis. Annals of Library and Information Studies, 57,pp. 98-108
7. Hasan, S. and et al.2008). Role of Indian educational and R&D institutions in knowledge sharing. Journal of scientific & Industrial Research, 67, 589-598.
http://books.google.co.in/books?id=xgybNAhXi_oC&pg=PA4&lpg=PA5&ots=5FxX Ds-AxL&dq=webometrics+definition.
8. India, Education (2011, April 22). India education. Retrieved April 22, 2011, from
Education in India: http://www.indiaedu.com/
9. India, R& D (2010). About India R & D. Retrieved 04 11, 2011, from India rnd web
site: http://www.indiarnd.com
10.Jalal, S., Biswas, S. and Parthasarathi, M. (2010, June). Web impact factor and link analysis of selected Indian universities. Annals of library and Information Studies, pp.
109-121.
11.James, T. (2005, March). Digital Technology And Libraries: A copyright Law Approach. Annals of Library and Information Studies, 52, pp.1-7.
12.Jeyshankar, R. and Remesh Babu,B.(2009, June).Websites of universities in Tamil Nadu: a webometric study. Annals of library and information studies 56, pp.69-79.
13.Kalyani, Hamsa, Kemparaju, T.D & Rajashekhar, T.B (2008) Representation of
Institutional Knowledge on Institutional Websites: A Case Study of University of
Califorrnia. Scholarship Repository (Amudhavalli, A.Ed Dynamics in Digital
Information system. Delhi: Ess Ess, pp 140-149
14. Kaujalgi, V. (2003, July 15). C-MMACS Foundation Day Lecture:15. Bangalore, India
15.Kim, K.H. and Jung,Y.M (2007). Website evaluation factors and virtual community loyalty in Korea.Advances in International Marketing,
18(1474-979/d0i:10.1016/S1474-7979 (06)180100,pp.231-252.
16.Konnur, P. and Rajani, S. (2010,October 19-22). Academic Library Websites in Bangalore
17.Lee, K. and Teh, K. (2001, December). Evaluation of Academic Library Websites in Malaysia. Malaysian Journal of Library & Information Science, 5, no.2, pp.95-108.
Available at http://mjcs.fsktm.um.edu.my/document.aspx?Filename=164.pdf
19.Maya verma, D., Thakur, K. and Mishra, P. (2010, October 19-22). Library Herald: A Webometric Study. Sixth International Conference on Webometric, Informetric and
Scientometrics & Eleventh COLLNET Meeting, pp.580-586.
20.Mukherjee, B. (2009, September). Link analysis of Indian political parties’ web sites: a temporal comparison. Annals of Library and Information Studies, 56, pp. 201-211.
21.Raju, Vasantha and Harinarayana, N. (2008, June). An analysis of usability features of library websites. Annals of Library and Information Studies, 55, pp. 111-122.
22.Nourzi, A. (2004, August). Introduction to Webology. Webology. Retrieved March
20, 2011, From Webology: http://www.webology.org/2004.v1n1.html
23.Nourzy, A. (2005, April 15). Web Impact factors For Iranian Universities. Retrieved
March 20, 2011, from Webology: http://www.webology.org/2005/v2n1/a11.html
24.Ortega, j.l. and Aguillo, I.F. (2007). Interdisciplinary relationships in the Spanish academic web space: A Webometric study through networks visualization.
International Journal of Scientometrics, Informetrics and Bibliometrics, 11(1), 1-6.
25.Osorio, N.L. (2001).web sites of Science-Engineering Libraries: An Analysis of
Content and Design. Retrieved March 15, 2011, from Science and Technology
Librarianship: http://www.istl.org/-winter/refereed.html.
26.Papers Evaluation Science. (2011). Retrieved April 20, 2011, from Website
Evaluation for Librarians: Evaluative Criteria:
http://www.moyak.com/papers/evaluation-science-websites.html.
27.R & D in India. (2005, November 21). Retrieved April 20, 2011, from R & D in India:
http://knowledge.wharton.upenn.edu/
28.Research and Development. (2011). Retrieved April 20, 2011, from investorwords
website: http://www.investorwords.com/4200/research_and_development.html.
29.Research and Development. (n.d.). Retrieved April 20, 2011, from topic/research and
development: http://www.answers.com.
30.Sampath Kumar, B. and Pavithra, S.M.(2010,June). Evaluating the searching capabilities of search engines and metasearch engines: a comparative study. Annals of
31.Sangeeta, K. A. (2008). Evaluation of ICT Based Services in the Academic Libraries of Manipur: A study. International CALIBER , 201-206.
32.Schimmel, Kurt…et al.(2002). The importance of university web pages in selecting a
higher education institution. Retrieved March 20, 2011, from manuscripts/10560.pdf.
http://www.aabri.com/manuscripts/10560.pdf
33.Sen, B. (2004, March 51). Cybermetrics: Meaning, Definition, Scope and Constituents. Annals of Library and Information Studies , pp. 116-120.
34.Shukla, A. and Tripathi, A. (2010, December). Establishing content awareness evaluation criteria for library websites: a case study of Indian academic library websites. Annals of Library and Information Studies, 57, pp. 403-416.
35.STTR Definition Research Institution.aspx. (2011). Retrieved April 21, 2011, from
winmda website: http://www.winmda.com/Home.aspx
36.Thelwall, Michael. (2009) Introduction to Webometrics: Quantitative Web Research
for the SocialSciences.
http://book.google.co.in/books?id=xgybNAhXi_oC&pg=PA4&lpg=PA5&ots=5FxX Ds-AxL&dq=webometrics+definition.
37.Thelwall, M. (2010, December). Proceeding of the Seventh International conference on Conceptions of Library and Information Science-“Unity in diversity”- part2.iRinformation research, 15.
38.Tucciarone, Krista M. (2009). Speaking the Same Language: Information College Seekers Look for on a College Web Site. College & University, 84 (4):pp 22-31.
39.Utulu, Samuel C. (2007). Webometric Ranking and Nigerian Private Universities: A
case Study of Bells University of Technology, Retrieved March 19, 2011, from http:/
eprints. rclis.org/archive/00009007.
40.Velvizhi, J., Durairajan, M. and Janakidevi. (2010 October 19-22). Toward a basic framework for Webometrics. Sixth International Conference on Webometrics,
Informetrics and Scientometrics & Eleventh COLLNET Meeting, pp.1-28
AWARENESS AND USE OF NATIONAL KNOWLEDGE RESOURCE CONSORTIUM OF NISCAIR:
A CASE STUDY
SAKSHI Research Scholar,
Department of Library and Information Science, KU, Kurukshetra.
Neeraj Uppal Inventory Manager,
Woolworths Ltd., Melbourne, Australia. [email protected]
Dr. Joginder Singh Assistant Professor,
Department of Library and Information Science, KU, Kurukshetra.
ABSTRACT
The present paper explains about National Knowledge Resource Consortium and examined awareness and use of the consortium by the users of NISCAIR. 70 questionnaires were distributed to the users and 63 questionnaires were received back for analysis the data. The results of the survey reveal that majority of the respondents were aware of the consortium whereas only 4.76% were not aware of the consortium. 52.38% respondents were moderately satisfied with the consortium and 23.80% were using for writing research articles. Some problems were highlighted while accessing the consortium. Providing training to its users will make maximum use of the consortium and reduce the problems faced by the users.
Keywords: National Knowledge Resource Consortium, E- journals Consortium, E-
Resources
INTRODUCTION
Canters, FORSA, HELINET, CSIR e- journal consortium. A consortium is helpful in getting co-operation from various libraries in acquiring electronic databases and communication of information. Now-a-days, many of the special and university libraries formed a group for getting online journals
NISCAIR
National Institute of Science Communication and Information Resources (NISCAIR) came into existence on 30 September 2002 with the merger of National Institute of Science Communication (NISCOM) and Indian National Scientific Documentation Centre (INSDOC). Both NISCOM and INSDOC, the two premier institutes of the Council of Scientific and Industrial Research (CSIR), were devoted to dissemination and documentation of S&T information. Now, with the formation of NISCAIR, all the multi-faceted activities have been amalgamated, making NISCAIR, an institute capable of serving the society using modern IT infrastructure in a more effective manner and taking up new ventures in the field of science communication, dissemination and S&T information management systems and services (www.niscair.res.in)
National knowledge Resource Consortium
The National Knowledge Resource Consortium (NKRC) was established in year 2009. It is a network of libraries and information centres of 40 CSIR and 26 DST institutes. NKRC's origin goes back to the year 2001, when the CSIR set up the Electronic Journals Consortium to provide access to 1200 odd journals of Elsevier Science to all its users. Over a period of time, the Consortium not only grew in terms of the number of resources but also in terms of the number of users as more like-minded institutes evinced interest to join the Consortium.
In present time, NKRC facilitates access to 5,000+ e-journals of all major publishers, patents, standards, citation and bibliographic databases. NKRC provides open access resources also to its users. Resources subscribed include publishers like M/s Blackwell, M/s Springer, M/s AIP, M/s ASCE & others, Journals/Conference Proceedings, Patents, Standards, and Databases like Web of Science, JCCC, & SCI-Finder and many more e- reosurces. (www.niscair.res.in)
Need of the study
There are many studies conducted to find out the use and awareness of consortium by the users. But the present work is conducted to explore the awareness of National Knowledge Resource Consortium among users of NISCAIR.
Review of Literature
Bhatt (2010) studied that UGC-Infonet Digital Library Consortium is the most important consortium providing access to a large array of e-resources to all academic universities and colleges in India. It facilitates efficient and effective usage of e-resources for teaching and research activities.
There appears to be some need for academics to be provided with training in using e- journals.
Murthy (2008) conducted a study regarding usage of UGC-Infonet resources and found that the trend of high use of e-resources by the Indian scholars helped in reducing information gaps between rural and urban, privileged and less privileged, reachable and unreachable frontiers within the Country. This has revolutionized the Indian university campuses with a digital culture.
Patil and Parameshwar (2007) revealed in their study that UGC Infonet Consortium is much helpful in fulfilling their information needs. It was concluded that there is need to train the faculty members and research scholars in using the UGC-Infonet Journals. More number of journals should be included in the consortium.
Vishala and Bhandi (2007) UGC-Infonet project aims to create awareness to the library and information professionals, research scholars, and faculty and post graduate students of library and information science regarding the availability of the scholarly journals in the field of library and information science
Walmiki, et.al (2010) surveyed that less than 40% of the faculty members of Karnataka state universities are aware of and use the UGC- Infonet online resources and more than 60% are not using the resources. It was suggested that there is an urgent need on the part of UGC to review the resources included in the consortium in order to fulfill the needs of the faculty members.
Objectives
1. To know the awareness about National Knowledge Resource Consortium among users of NISCAIR.
2. To find out who introduced them to the access of National Knowledge Resource Consortium.
3. To study the purpose of using National Knowledge Resource Consortium E- journals 4. To find out problems faced by the users while accessing National knowledge
Resource Consortium.
5. To ascertain whether training programme is necessary to educate the users. 6. To identify satisfaction with of National Knowledge Resource Consortium.
Scope
The scope of the study is confined to the users who frequently visit to NISCAIR to fulfill their information needs.
Methodology
Data Analysis
Table 1.Gender wise distribution of Respondents
Gender No. of Response Percentage
Male 40 63.49%
Female 23 36.50%
Table 1 shows that out of 70 respondents 40 (63.49%) were male and 23 (36.50%) were female.
Table 2. Awareness about Consortium
Particulars No. of Response
Percentage
Yes 60 95.23%
No 3 4.76%
It is evident from table 2 that majority of respondents 60 (95.23%) are aware about consortium whereas only 3(4.76%) respondents are not aware of this consortium.
Table 3.Sources through which consortium is known
Sources No. of Response Percentage
Library Professionals 35 55.6%
Teachers 15 23.80%
Colleagues 7 11.11%
Web 6 9.52%
A question was asked to know, through which sources users came to know about National Knowledge Resource Consortium. It is interesting to note that 35 (55.6%) responded that they came to know about consortium through library professionals followed by 15 (23.80%) of the respondents know the same by their teachers, 7 (11.11%) know the consortium by their colleagues and 6 (9.52%) know the consortium through the web searching.
Table 4. Purpose of using consortium
Purpose No. of Response Percentage
Research Needs 12 19.04%
Education 13 20.63%
Professional Achievement 12 19.04%
Writing Research Articles 15 23.80%
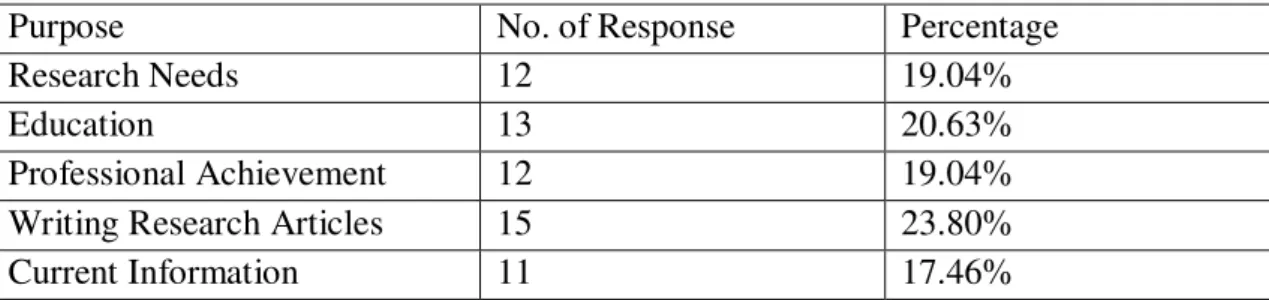
Data presented in table 4 revealed that 15 (23.80%) respondents use the National Knowledge Resource Consortium for the purpose of writing research articles followed by 13 (20.63%) for education, and 12 (19.04%) to carry out research and Professional achievement, 11 (17.46%) for current information in their field of specialization.
Table 5. Problems faced while accessing consortium
Problems No. of Response Percentage
Time Consuming 29 46.03%
Limited Access to Terminals 12 19.04%
Slow Speed 17 26.98%
Lack of Trained Staff 5 7.93%
Table 5 shows the problems faced by the respondents while accessing National Knowledge Resource Consortium. The most common problem faced by the respondents is that of time consuming (46.03%). 17 (26.98%) are of opinion that internet has slow speed, 12 (19.04%) state limited access to terminals and only 5 (7.93%) consider that there is lack of trained staff to assist them in searching relevant information
Table 6. Satisfaction level
Satisfaction No. of Response Percentage
Very Satisfied 21 33.33%
Moderately Satisfied 33 52.38%
Somewhat Dissatisfied 09 14.28%
Not Satisfied - -
The results from table 6 reveal that majority of the respondents 33(52.38%) are moderately satisfied with the consortium, 21 (33.33%) respondents are very satisfied with the same consortium and only 9 (14.23%) are somewhat dissatisfied.
Table 7. Evaluation of Consortium
Grade No. of Response Percentage
Excellent 16 25.39%
Good 32 50.79%
Moderately Good 15 23.80%
Poor - -
Table 8. Need of Training
Need No. of Response Percentage
Yes 40 63.49%
No 23 36.50%
Table 8 reveals that 40 (63.49%) respondents want training in using the consortium. However, 23 (36.50%) respondents stated that the training programme is not required.
Findings
The significant findings of the study are given below:
Majority of the respondents were well aware of the National Knowledge Resource Consortium
35 (55.6%) respondents came to know about the consortium through library professionals.
15 (23.80%) of the respondents used the consortium for writing research articles followed by 13 (20.63%) for education.
12 (19.04%) respondents stated that they were accessing the consortium for research needs and professional achievement and 11 (17.46%) for current information.
The most common problem faced by the respondents was time consuming while accessing e- resources.
33 (52.38%) respondents expressed satisfaction with the consortium.
40 (63.49%) respondents attest to the fact that they needed training programme for searching the consortium.
32 (50.79%) rated the consortium as good. Suggestions and Conclusion
The emerging technologies have dynamically changed the way information is gathered, organized, accessed, stored and consumed. E-resources are the need of the hour for research and academic activities and help in faster access and retrieval of information in various disciplines. National Knowledge Resource consortium is much helpful in fulfilling information needs. As can be inferred from the study that majority of the respondents are aware of the consortium and use e- resources for the purpose of writing research articles and research needs. Training programme should be organized for better usage of the consortium. To provide more computer systems with high speed connectivity in computer laboratories will help in better accessing and downloading of e-resources as per users’ choice
References
1. Bajpai, R.P., K.L. Bidyut, Geetanjali Bajpai.2009. “Use of e-resources Through Consortia: A Boon to Users of Indian University Libraries”. In Delhi University Library System, University of Delhi, Delhi: International Conference on Academic
Libraries 2009. Accessed November 11, 2011.
2. Bhatt, R.K.2010. “Use of UGC-Infonet Digital Library Consortium Resources by Research Scholars and Faculty Members of the University of Delhi in History and Political Science: A Study”. Library Management 31(4/5): 319- 343. Accessed
November 12, 2011. http: // www.emeraldinsight.com/0143-5124.htm/ doi: 10.118/0143512101104637
3. Madhusudan, Margam.2008. “Use of UGC-Infonet E-Journals by Research Scholars and Students of the University of Delhi, Delhi: A study”. Library Hi Tech 26 (3):369-
386. Accessed November 30, 2011. http:// www.emeraldinsight.com/ 0737-8831.httm / doi: 10.1108/0737883031090330
4. Murthy, T.A.V. (2008). “Creating prosperity in the higher education institutions through UGC-Infonet E- Journal Consortium.” Accessed November 13, 2011.http://www.chillibreeze.com/articles_ various/ epublishing/ 17.% 20%seminar%20 paper%20 contents % 20 page % 20 with %20 abstract 3.pdf
5. Patil, D.B. and S. Parameshwar. 2008. “Use of UGC- Infonet Consortium by the faculty Members and Research Scholars in Department of Chemistry of Gulbarga University: A Survey. In INFLIBNET Centre Ahmedabad. 5th International Caliber Punjab University Chandigarh: 2008”. Accessed November 13, 2011.
6. Vishala, B.K. and M. K. Bhandi. (2007). “Availability of Library and Information Science Electronic Journals through UGC-INFONET Project” Annals of Library and Information Studies, 53(2): 65-9
7. Walmiki, R. H, K.C. Ramkrishnegowda, K. R. Prithviraj.2010.”Awarenes and Use of UGC- Infonet Digital Library Consortium by the Faculty Member of Karnataka State Universities”. Annals of Library and Information Studies.57: 33- 43
USE OF INFORMATION COMMUNICATION TECHNOLOGY BY THE USERS’ OF JAYPEE UNIVERSITY OF ENGINEERING AND TECHNOLOGY
(JUET), GUNA: A SURVEY
SHAKIL AHMAD (Librarian)
Deanship of Library Affairs
University of Dammam, Dammam (KSA) DR. ABDUL MANNAN KHAN (Library in charge and course coordinator)
Integral University, Lucknow- India
DR. SULEIMAN IBRAHIM SULEIMAN ALREYAEE Assistant Professor
Imam Muhammad IBN Saud Islamic University
ABSTRACT
The main purpose of the study is to know the Use of Information Communication Technology by the Users’ of Jaypee University of Engineering and Technology (JUET) and users’ satisfaction about the library collection, facilities and both, traditional services as well as IT enabled services. A well structured questionnaire was administered to the faculty members, research scholars and students of the Jaypee University of Engineering and Technology (JUET) to collect data regarding the Use of Information Communication Technology and analyze the level of users’ satisfaction. According to the users’ responses the researchers observed that a large number of users are aware about the various types of services. It is also being revealed that majority of the users are utilizing the facilities and different services provided at JUET-Library The study also show that the majority of the user preferred Internet as a source of information to full-fill their subject related information need. The overall satisfaction levels of the users’ are good.
Keywords: Information Communication Technology, Users’, Jaypee University of
Engineering and Technology, JUET, Guna
1. Introduction
tools & techniques have combined to provide new electronic dimension to information handling and management.
2. Jaypee University of Engineering and Technology
Jaypee Institute of Engineering and Technology, Guna was established in the year 2003 based on the MOU signed between Jaiprakash Sewa Sansthan (a not-for-profit trust sponsored by Rs. 15,000 Cr Jaypee Group) and the Government of Madhya Pradesh with an aim of becoming a Center of Excellence in Engineering and Technology. Based on our request to enable the Institute to become a State University, the Government of MP has, vide gazette extra ordinary no. 3 of 2010 dated 29th April 2010 has established Jaypee University of Engineering and Technology (JUET), Raghogarh, Guna as a private university in the State of MP under the provisions of MP Niji Vishwavidyalaya Adhiniyam 2007.
The Learning Resource Center of JUET is a major activity centre providing facilities to the students and staff for almost 15 hours a day. The library is fully classified and catalogued and users can search for information at their own. The institute uses Library management software, Alice for Windows. LRC users know the availability status of the books and other materials through the software OPAC (Online Public Access Catalogue). The library is linked with DELNET (Developing Library Network) http://delnet.nic.in, the users of LRC enjoy the access of reading materials through this network also. The library subscribes to journals of national and international repute.
3. REVIEW OF RELATED LITERATURE
Shampa Paul (2007) has presented a critical discussion in his on Information
communication technology (ICT) in government agencies as well as educational and research institutions facilitate an efficient, speedy and transparent dissemination of information to the public and other agencies for performance of government administration activities. The findings of this study highlight the role of Internet, particularly the World Wide Web (WWW), which has made it easier for citizens to locate and download official information and to conduct transactions. Information management agencies such as libraries and knowledge centers play a vital role in supporting transparent and accountable governance in this digital era.
Dana Hanson-Baldauf and Sandra Hughes Hassell (2009) have conducted a
study to present a critical discussion on information and communication technologies (ICTs) become increasingly prevalent in modern society, improving students' competency with these technologies has become a key focus of 21st century education.
Namkee Park, , , Raul Roman, , Seungyoon Lee, and Jae Eun Chung (2009) have
Eustache Mêgnigbêto(2010) has discussed in their study about Information policy: Content and challenges for an effective knowledge society This study presented a critical discussion of Information policy is the set of strategies and actions defined at a geographical or institutional level in order to satisfy information needs expressed by people and assure development goals. With the development of information and communication technologies (ICT), new stakeholders appear, including both information producers and consumers, raising problems relative to authenticity, reliability, and evaluation of information, and also the problem of full and effective use of information technology. As information policy aims at providing access to timely information, it should attempt also to make people fluent with technology. Toward achieving this objective some challenges are faced which are related to access to technology, computer literacy, ability to read and write, and early childhood development.
4. RESEARCH GAP
With the advent of globalization in the realm of education, there is an information explosion. The uses of Information Communication Technology are the most popular source of researching. There is a dearth of study on Information Communication Technology in the context of Indian universities. The study with regard to use of Information Communication Technology in JUET -Guna renowned institution of India is thus a novel effort.
5. OBJECTIVES OF THE STUDY
The following objectives have been pursued to study the level of use of Information Communication Technology in the referred institution:
1. To examine the level of use of Information Communication Technology services by the Users’ of Jaypee University of Engineering and Technology (JUET), Guna. 2. To identify the place from where Users’ of Jaypee University of Engineering and
Technology (JUET) access Information Communication Technology services. 3. To find out the purpose of using Information Communication Technology
services.
4. To know the problem faced by the users’ while using Information Communication Technology services.
5. To find out effectiveness of Information Communication Technology services. 6. To understand various factors, which discourage users’ in using Information
Communication Technology services
6. METHODOLOGY EMPLOYED