Simultaneous Imaging of CBF Change and
BOLD with Saturation-Recovery-T
1
Method
Xiao Wang, Xiao-Hong Zhu, Yi Zhang, Wei Chen*
Center for Magnetic Resonance Research, Department of Radiology, University of Minnesota Medical School, Minneapolis, Minnesota, United States of America
Abstract
A neuroimaging technique based on the saturation-recovery (SR)-T1MRI method was
ap-plied for simultaneously imaging blood oxygenation level dependence (BOLD) contrast and cerebral blood flow change (ΔCBF), which is determined by CBF-sensitive T1relaxation
rate change (ΔR1CBF). This technique was validated by quantitatively examining the
rela-tionships amongΔR1CBF,ΔCBF, BOLD and relative CBF change (rCBF), which was
simul-taneously measured by laser Doppler flowmetry under global ischemia and hypercapnia conditions, respectively, in the rat brain. It was found that during ischemia, BOLD decreased 23.1±2.8% in the cortical area;ΔR1CBFdecreased 0.020±0.004s-1corresponding to a ΔCBF decrease of 1.07±0.24 ml/g/min and 89.5±1.8% CBF reduction (n=5), resulting in a baseline CBF value (=1.18 ml/g/min) consistent with the literature reports. The CBF change quantification based on temperature correctedΔR1CBFhad a better accuracy than apparent
R1change (ΔR1app); nevertheless,ΔR1appwithout temperature correction still provides a
good approximation for quantifying CBF change since perfusion dominates the evolution of the longitudinal relaxation rate (R1app). In contrast to the excellent consistency between ΔCBF and rCBF measured during and after ischemia, the BOLD change during the post-is-chemia period was temporally disassociated withΔCBF, indicating distinct CBF and BOLD responses. Similar results were also observed for the hypercapnia study. The overall results demonstrate that the SR-T1MRI method is effective for noninvasive and quantitative
imag-ing of bothΔCBF and BOLD associated with physiological and/or pathological changes.
Introduction
Cerebral blood perfusion through the capillary bed is essential for brain function. Imaging of cerebral blood flow (CBF) provides valuable information regarding brain physiology, function, activation and tissue viability associated with a large number of brain diseases. Arterial spin la-beling (ASL), a noninvasive MRI technique which utilizes the radiofrequency (RF) pulse to label the flowing arterial water spin as an endogenous and diffusible tracer for imaging CBF [1–7], plays an ever-growing role in scientific and clinical research. An inversion-recovery preparation is commonly applied for most ASL methods, and paired images (one control and a11111
OPEN ACCESS
Citation:Wang X, Zhu X-H, Zhang Y, Chen W (2015) Simultaneous Imaging of CBF Change and BOLD with Saturation-Recovery-T1Method. PLoS ONE 10(4): e0122563. doi:10.1371/journal.pone.0122563
Academic Editor:Hengyi Rao, University of Pennsylvania, UNITED STATES
Received:September 26, 2014
Accepted:February 23, 2015
Published:April 23, 2015
Copyright:© 2015 Wang et al. This is an open access article distributed under the terms of the Creative Commons Attribution License, which permits unrestricted use, distribution, and reproduction in any medium, provided the original author and source are credited.
Data Availability Statement:All relevant data are uploaded to Figshare, as follows: R1_isch.mat DOI 10.6084/m9.figshare.1320912; R1_hyper.mat DOI 10.6084/m9.figshare.1320909; BOLD_isch.mat DOI 10.6084/m9.figshare.1320910; BOLD_hyper.mat DOI 10.6084/m9.figshare.1320911; SR_R1 PLOS ONE upload.xlsx DOI 10.6084/m9.figshare.1327749.
Funding:This work was partially supported by NIH grants NS057560, NS041262, NS070839, P41 RR08079 & EB015894, P30 NS057091 & NS076408 and WM Keck Foundation.
another with spin tagging) are acquired with an appropriate inversion recovery time. The sig-nal difference between the paired images can be used to determine the CBF value and it is par-ticularly useful for imaging relative CBF changes, for instance, induced during brain activation [8,9] and/or physiology/pathology perturbations.
An alternative MRI-based CBF imaging method is to measure the parametric parameter of apparent longitudinal relaxation time (T1app) directly by using inversion-recovery preparation
with varied inversion-recovery time (TIR) [2,6,10]. Due to the slow T1apprelaxation
process-ing, this method requires a relatively long repetition time (TR) to acquire a serial of images with different TIRvalues in order to generate T1appimages, thus, results in low temporal
resolu-tion for imaging CBF. Nevertheless, this method should be robust in quantifying CBF and its change in the absolute scale with the unit of ml blood/g brain tissue/min (or ml/g/min) owing to a simple relationship between T1appand CBF (see more details inMethod and Theory).
One common, interesting observation related to T1appchanges reported in the literature is
the detection of T1appincrease at an early stage of ischemia, indicating a possible link between
the brain tissue T1appchange and the perfusion deficit caused by the ischemia [11–14].
Howev-er, the quantitative relationship between the observed T1appchange and the CBF reduction
ex-tent caused by acute ischemia has not been rigorously, quantitatively studied. A poex-tential difficulty for quantifying CBF via the measurement of T1applies on the confounding effect
from the brain tissue temperature change owing to physiological and/or pathological perturba-tion, which can also contribute to the T1appchange [15–18]. Consideration and correction of
this confound effect might improve the accuracy of quantifying CBF based on the T1app
mea-surement. Another layer of complexity is the phenomena of concurrent changes in both perfu-sion and the blood oxygenation level dependence (BOLD) contrast [19,20] during either physiology perturbation (e.g., brain stimulation) or pathology perturbation (e.g., hypoxia via is-chemia); and these changes could affect the MRI intensity via either T1appbased mechanism
owing to perfusion change or the transverse (or apparent transverse) relaxation time (T2/T2)
based mechanism owing to BOLD contrast.
To address these issues, we conducted a study aiming to: i) develop a robust neuroimaging approach to simultaneously measure and image the CBF change and the BOLD contrast by using the saturation-recovery (SR)-T1MRI method; ii) validate this approach by conducting
si-multaneousin vivomeasurements of CBF change using the SR-T1MRI method and the relative
CBF change using laser Doppler flowmetry (LDF) recording under transient hypercapnia (creasing CBF) and acute ischemia (reducing CBF) conditions using a rat model at 9.4T; iii) in-vestigate the effect of brain temperature change on T1appand the apparent longitudinal
relaxation rate (R1app= 1/T1app) after the induction of hypercapnia or ischemia (seeS1 Sup-porting Information); iv) establish the quantitative relationship between the CBF-sensitive R1
change (ΔR1CBF) and the CBF change (ΔCBF); and v) quantitatively study the temporal rela-tionships among R1CBFchange,ΔCBF, relative CBF change and BOLD during and after
hyper-capnia or ischemia.
Method and Theory
The SR-T1
MRI pulse sequence for imaging T1
appThe MRI perfusion method described herein relies on quantitative T1appmapping using the
magnetization saturation-recovery preparation without slice selection and fast gradient-echo echo-planar imaging (GE-EPI) sampling [21]. The regional saturation-recovery preparation is confined by using a RF surface coil with a focal, intense RF field (B1) covering the rat brain
adiabatic half passage 90° RF pulse, which is insensitive to the inhomogeneous B1field of a
sur-face coil, immediately followed by dephasing gradients (GDephase) in three dimensions (Fig 1a).
The adiabatic 90° pulse rotates the longitudinal magnetization (Mz) into the transverse plane
in a spin-rotating frame, resulting in the transverse magnetization (Mxy) with the same
magni-tude of Mz. The Mxyrapidly loses its phase coherence because of the strong dephasing effect by
GDephase. The overall effect of the magnetization saturation preparation in combination with
the dephasing gradients is to approach zero magnetizations for both Mzand Mxycomponents
(Fig 1b). This magnetization preparation is independent of the initial Mzvalue or its reduction
from the previous scan owing to the partial magnetization saturation effect when a relatively short TR is applied. Therefore, no extra delay before the adiabatic 90° pulse is needed. This fea-ture can significantly shorten the total image acquisition time and improve the temporal reso-lution for imaging T1appas compared to the conventional inversion-recovery preparation in
which the net magnitude of inverted Mzdepends on the initial Mzprior to the inversion pulse
and the effect of partial saturation as a function of TR, thus, a relatively long TR is preferred for each TIRmeasurement. During the period of saturation-recovery time (TSR), the longitudinal
magnetization starts to relax and recover approximately according to an exponential function (Fig 1c). This recovered Mzafter a period of TSRis rotated to the transverse plane again by a
spin excitation RF pulse with a nominal 90° flip angle, and then sampled by EPI acquisition.
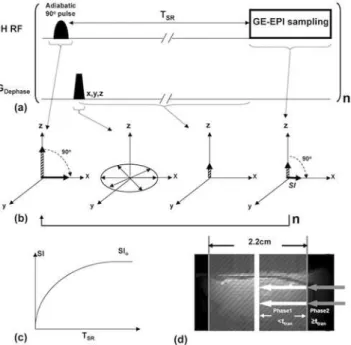
Fig 1. Schematic diagram of the SR-T1MRI sequence and spin magnetization evolution in rotating
frame.(a) Gradient-echo EPI (GE-EPI) sampling is applied after the saturation-recovery waiting time (TSR).
There is no an extra delay time between the imaging acquisition and the next saturation pulse. This imaging measurement is repeated n times with varied TSR. (b) Schematic diagram illustrating the principle underlying
the imaging sequence in the spin-rotating frame. It shows the rotation of longitudinal magnetization (Mz),
dephasing of transverse magnetization (Mxy) and its evolution after TSRand spin excitation pulse followed by
GE-EPI acquisition. (c) Exponential recovery curve of GE-EPI signal intensity (SI) as a function of TSR. The
regression of this curve determines the apparent T1(T1app) value that is sensitive to perfusion. (d) Schematic
diagram of two-phase model incorporated with the SR-T1method developed in this study. The regional
saturation zone (gray shaded area) achieved by a surface RF coil overlapped on a rat brain sagittal anatomic image. The white arrows stand for the Phase 1 arterial spins in the saturated region traveling into the image slice within the time window ttran (i.e., when TSR<ttran) The gray arrows indicate the unsaturated Phase 2
arterial blood spins flowing into the image slice when the traveling time is longer than ttranor equal to (i.e.,
when TSRttran).
The detected EPI signal intensity (SI) without considering the perfusion effect on T1appobeys
the following equation:
SI¼SI0 ½1 e
ð TSR T1appÞ
eð
TE T2Þ
ð1Þ
where TE is the spin echo time; and T2is the apparent transverse relaxation time, which is
sensitive to magneticfield inhomogeneity and susceptibility effect, such as the BOLD contrast; SI0is the EPI signal intensity when TE = 0 and TSR=1. This equation can be used for T1app
re-gression based on a number of SI measurements with varied TSR. When TSRis sufficiently long
(e.g.,5T1appas applied in this study) and TE>0, the second term in (Eq 1) approaches one,
and (Eq 1) becomes:
SI ¼SI0eð TET2Þ ð2Þ
Under this condition, SIis determined by the T2relaxation process and becomes
indepen-dent of T1app; thus, this signal can be used to quantify the“true”BOLD contrast without
con-founding effect from the saturation effect caused by the perfusion contribution [19,20,23]. Moreover, the addition of SImeasurement with a long TSR, thus, a long TR is also critical to
improve the reliability and accuracy for T1appregression, which is essential in determining the
absolute CBF change, though it leads to a relatively low temporal resolution for simultaneously obtaining T1appand BOLD images.
In this study, two brain conditions are defined by the subscript“RC”standing for the Refer-ence Condition (i.e., control) before the induction of physiological/pathological perturbation, and the subscript“PC”standing for the Perturbed Condition by the induction of either hyper-capnia (hyper-perfusion) or ischemia (hypo-perfusion). Accordingly, the BOLD contrast can be quantified by:
BOLD¼SI
PC SI
RC SI
RC
or rBOLD¼SI
PC SI
RC
ð3Þ
where rBOLD stands for the relative BOLD.
Two-phase arterial spin modeling of the SR-T
1MRI method
The Block equation describes the dynamic behavior of brain water magnetization as the follow-ing:
dMbðtÞ dt ¼
M0
b MbðtÞ
T1 þf½MaðtÞ MvðtÞ ð4Þ
where Ma, Mband Mvare the longitudinal water magnetization of the arterial blood, brain
tis-sue and venous blood respectively; Mb0is the equilibrium value of Mb; T1is the brain tissue
water longitudinal relaxation time in the absence of bloodflow;frepresents the CBF value. As-sociated with the proposed experimental MR preparation and acquisition, we solve (Eq 4) with a two-phase arterial spin model as illustrated inFig 1d, showing the schematic graph of the global brain region (shaded gray area) saturated by the RF coil overlapped on a rat brain sagit-tal anatomic image. Phase 1 represents the time window in which the image slice receives the flowing saturated arterial spins within the regional saturation region (as indicated with the white arrows in theFig 1d); and Phase 2 characterizes the time window when the fresh, fully re-laxed arterial spins sitting outside of the saturation region (as indicated with the gray arrows in
region will take the artery transit time (ttran) to reach the image slice. For the SR-T1
measure-ment with the boundary condition of Mb(t = 0) = 0, thefinal solution (seeS1 Supporting Infor-mationfor details) for (Eq 4) and Phase 1 when t<ttranfollows:
Mbð0 ttranÞ ¼M 0
b 1 e t T1app 0 B @ 1 C A f
l ð 1
T1app 1
T1a Þ
e t T1a e
t T1app 0 B @ 1 C A 2 6 6 4 3 7 7 5¼M
0 bðA BÞ
A¼1 e t T1app
B¼ f
l ð 1
T1app 1
T1a Þ
e t T1a e
t T1app 0 B @ 1 C A ð5Þ
where T1ais the longitudinal relaxation time of arterial blood and
1
T1app ¼ 1
T1þ 1
T1temp
þlf or Rapp1 ¼R1þR temp 1 þ
f
l ð6Þ
whereλ(= 0.9 ml/g) is the brain-blood partition coefficient, T1temp(R1temp) is the contribution of temperature-dependent longitudinal relaxation time (rate) caused by brain temperature al-teration during physiological or pathological perturbation (seeS1 Supporting Information).
During Phase 2 the fully relaxed artery spins in the blood outside the saturation region flow into the rat brain, and will approach the image plane and exchange with the brain tissue water spins when tttran. Final solution for Phase 2 of (Eq 4) when tttranwith the initial condition
using (Eq 5) with the boundary condition of t = ttrangives:
MbðtttranÞ ¼M 0 b 1 e
t T1app ð1
CAþCBÞ
ð7Þ
where CAand CBare the constants which equal to A and B in (Eq 5), respectively, when
t = ttran, they reflect the boundary condition and ensure the function continuity between Phase
1 and Phase 2. Therefore, when the saturation recovery time is shorter than ttran(Phase 1), the
magnetization of brain tissue water relaxes following (Eq 5) whereas when the saturation re-covery time is longer than or equal to ttranit will relax according to (Eq 7) instead. It is clear
that the brain magnetization recovery with a long saturation recovery time of TSRttran(Phase
2) follows a single exponential relaxation time T1app(Eq (7)), while the magnetization recovery
in Phase 1 (TSR<ttran) in theory is influenced by both T1appand T1a(see (Eq 5)).
Close examination of (Eq 5) for Phase 1, one can see that the signal recovery described by the term A only depends on T1appwhereas the signal recovery of the term B relies on both
T1appand T1a. A simulation study was conducted using (Eq 5) and the parameters relevant to
this study for comparing the relative contributions of A and B terms (seeS1 Supporting Infor-mation) and it turns out that the term B in (Eq 5) is less than 4% of the term A within a reason-able artery transit time range (100–500ms) in the rat brain [1,24–26]. Therefore, a single exponential recovery according to the term A is a rational approximation for the rat brain ap-plication during Phase 1 (TSR<ttran) since the magnetization contribution from the term B is
negligible. Therefore, the exponential recovery functions for both Phase 1 and Phase 2 can be unified as a single exponential recovery function according to T1app. In summary, a single
presents a simple approach and good approximation for imaging T1appor R1appwhich can be
quantitatively linked to CBF according to (Eq 6).
Imaging T1
app(or R1
app), T1
CBF(or R1
CBF) and CBF change (
Δ
CBF)
The T1and R1term in (Eq 6) represent the intrinsic brain tissue property of longitudinalrelax-ation time and rate, respectively; they are usually insensitive to physiological changes and can be treated as constants. The R1appdifference between the reference and perturbed conditions
becomes:
DRapp1 ¼DR1
tempþDCBF
l ð8Þ
whereΔCBF = CBF
PC—CBFRC. Thus, CBF change (ΔCBF) between perturbation and reference
conditions can be calculated from the following equation:
DCBF¼l ðDR1app
DR1tempÞ ¼l
DR1CBF ð9Þ
whereΔR1CBFpresents the R1change, which is solely attributed to the CBF change induced by physiopathological perturbation; and it can be imaged by the SR-T1MRI method through three
steps: i) image brain MRI SI as a function of TSRduring both control and perturbed conditions,
and then determine the T1appvalues in each image pixel by the exponential regression of
mea-sured SI as a function of TSRaccording to (Eq 1); ii) subtract the control R1app(= 1/T1app) value
from the perturbed R1appvalue resulting inΔR1app; iii) determineΔT1temporΔR1tempcaused by
a brain temperature change induced by perturbation (seeS1 Supporting Information), then cal-culateΔR
1CBFandΔCBF according to (Eq 9). The unit of CBF in (Eq 9) is ml/g/second, which
can be converted to a conventional unit of ml/g/min by multiplying CBF by 60.
Materials and MRI Measurements
Animal preparation and Experiment Design
All animal experiments were conducted according to the National Research Council’s Guide for the Care and Use of Laboratory Animals and under the protocols approved by the Institu-tional Animal Care and Use Committee of University of Minnesota. Twelve male Sprague-Dawley rats weighing 328 ± 35 g were included in this study. The rat was initially anesthetized and intubated using 5% (v/v) isoflurane in N2O:O2(60/40) gas mixture. Both femoral arteries
and left femoral vein were catheterized for physiological monitoring and blood sampling. Five rats were used for simultaneous MRI/LDF/temperature measurements. The LDF/Temperature instrument (Oxford Optronix, UK) was used to concurrently measure the percentage change of CBF or the relative CBF change that is defined as rCBF = CBFPC/CBFRCand the brain
tem-perature change in the cortical region in one hemisphere by inserting the LDF/Temtem-perature probe (0.5 mm diameter) into the brain tissue through a small hole (3×3 mm2) passing both skull and dura (1.5–4 mm lateral, 1.5–3 mm posterior to the bregma, 1.9 mm deep). The soft tissue around the hole was kept to minimize magnetic susceptibility artifacts in MRI. After the surgical operation, the rat was placed in a home-built cradle incorporating ear bars and a bite bar to reduce head movement and to ensure proper positioning inside the MRI scanner. The animal anesthesia was maintained at 2% isoflurane. Rectal temperature was maintained at 37.0 ±0.5°C by a circulating/heating water blanket and the rate and volume of ventilation were ad-justed to maintain normal blood gases.
Mild transient hypercapnia was induced in eight of the twelve rats used in this study by ven-tilating the gas mixture of 10% CO2, 2% isoflurane and 88% N2O:O2(60/40) for 7 minutes;
three of the eight rats were used for simultaneous measurements ofΔR
using the SR-T1MRI method, and rCBF and temperature (T) change using the
LDF/Tempera-ture probe; and other five rats were used to conduct the MRI experiments only.
All twelve rats performed 1-minute occlusion of the two carotid arteries to achieve acute, global brain ischemia using the four-blood-vessel-occlusion rat model [27]. The transient hy-percapnia experiment was performed first, followed by the acute ischemia experiment, and the rats were sacrificed by KCl injection for approaching cardiac arrest at the end of the experi-ment. There was an adequately long waiting time between these studies to ensure stable animal conditions prior to each perturbation and measurement. The SR-T1GE-EPI data were
ac-quired for two minutes prior to each perturbation of transient hypercapnia (7 minutes), acute ischemia (1 minute) or KCl injection for approaching cardiac arrest. This control (or prior-per-turbation) imaging acquisition period is defined as Stage 1. The duration during either the transient hypercapnia or acute ischemia perturbation is defined as the perturbation stage or Stage 2. Finally, the relatively long post-perturbation period was divided into three stages (i.e., early Stage 3; middle Stage 4 and late Stage 5).
MRI measurement
All MRI experiments were conducted on a 9.4T horizontal animal magnet (Magnex Scientific, Abingdon, UK) interfaced to a Varian INOVA console (Varian, Palo Alto, CA, USA). A butter-fly-shape1H surface coil (2.8×2.0 cm with the short axis paralleled to the animal spine) was used to collect all MRI data. Scout images were acquired using a turbo fast low angle shot (Tur-boFLASH) imaging sequence [28] with the following acquisition parameters: TR = 10 ms, TE = 4 ms, image slice thickness = 2 mm, field of view (FOV) = 3.2 cm×3.2 cm; image matrix size = 128×128.
The magnetization saturation of water spin inside the rat brain was achieved by using the local B1field of the RF surface coil and the adiabatic 90°RF pulse followed by three orthogonal
dephasing gradients. GE-EPI (TE = 21 ms; FOV = 3.2cm×3.2cm; image matrix size = 64×64; single slice coronal image with 2 mm thickness) combined with the saturation-recovery prepa-ration was used to image T1appwith seven TSRvalues of 0.004, 0.1, 0.2, 0.3, 0.4, 0.5 and 10 s,
which resulted in a temporal resolution of 11.9 s for obtaining one set of T1appand BOLD
im-ages. This SR-T1GE-EPI imaging sequence (seeFig 1a) was applied to: i) measureΔR1CBF
re-sulting from either hypercapnia (CBF increase) or acute ischemia (CBF reduction) compared to the control condition; ii) determine the relationship between brain temperature change and ΔR1tempimmediately after the cardiac arrest (i.e., CBF = 0) with a KCl bolus injection (seeS1
Supporting Informationfor details); and iii) determineΔCBF values and then compare and correlate the values with the LDF measurement results.
Data analysis
MRI data analysis was performed using the STIMULATE software package (Stimulate, Center for Magnetic Resonance Research, University of Minnesota, USA) [29] and the Matlab soft-ware package (The Mathworks Inc., Natick, MA, USA). LDF data was sub-sampled to match the corresponding MRI sampling rate and processed with home-written Matlab programs. Both region of interest (ROI) and single pixel MRI data taken from the rat sensory cortical re-gion were used to perform the T1appregression analysis and to determineΔR1app,ΔR1temp(see S1 Supporting Informationfor details) andΔCBF according to Eqs (8) and (9). The least-square nonlinear curve-fitting program using the Matlab software was applied to perform the T1appregression analysis. The regression accuracy was estimated by the sum squared error
To improve the quantification accuracy, the GE-EPI data were averaged within each stage as defined above and then applied to calculate the averaged values ofΔR
1app,ΔR1tempand
ΔCBF based on the transient hypercapnia or acute ischemia measurement. The reference
con-trol CBF (CBFRC) was further estimated from the averagedΔCBF values and its corresponding
relative CBF changes (rCBF) measured by LDF under ischemia condition and during the reper-fusion period after the acute ischemia. ROIs (ranging from 24 to 52 pixels) were chosen from the cortical brain region in the intact hemisphere with the location being approximately con-tralateral to the LDF recording side for those experiments performing simultaneous MRI and LDF/Temperature measurements in order to avoid the MRI susceptibility artifacts caused by the LDF/Temperature probe. The GE-EPI data acquired with the longest TSRof 10 s (i.e.,
5T1) were used to calculate BOLD according to (Eq 3).
The R1appimages at the control stage and a series ofΔCBF and BOLD images measured
dur-ing and post hypercapnia and/or ischemia stages were created on a pixel-by-pixel basis (pixel size 0.25×0.25×2 mm3, with nearest neighbor interpolation) with two-dimensional median fil-tering and then overlapped on the anatomic image. Paired t-test was applied to compare the T1appvalues measured at reference and perturbation conditions obtained from either ROIs or
single pixel, as well as to compare the regressed T1appvalues using ROI or single pixel data
under a given condition. A p value of<0.05 is considered as statistically significant.
Results
Reliability and sensitivity of T
1appmeasurement using the SR-T
1MRI
method
The averaged T1appvalue measured using the SR-T1MRI method in the rat cortex region
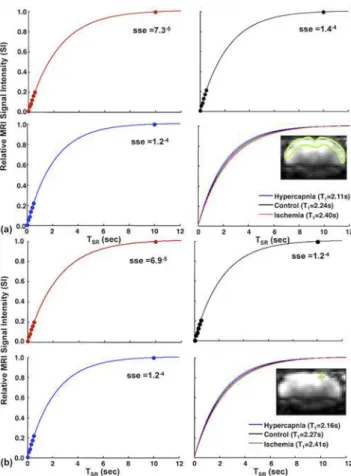
under the normal physiological condition was 2.30±0.03 s (n = 12) at 9.4T.Fig 2demonstrates a representative, single SR-T1GE-EPI measurement under control, hypercapnia and ischemia
condition, respectively, and the T1appregression results based on ROI (Fig 2a) and single pixel
(Fig 2b) data analysis without signal averaging. All the experimental data fitted well with an exponential function (R20.99 and sse<2×10⁻⁴). The T1appregression curves and the fitted
T1appvalues measured under control, hypercapnia and ischemia conditions were
distinguish-able and highly reproducible; and the results between the ROI and single pixel data analysis were consistent (Fig 2). For instance, no statistical difference was found between the T1app
val-ues obtained from the ROI analysis versus single pixel analysis under either the hypercapnia (p = 0.93, 12 image volumes using paired t-test) or the ischemia (p = 0.83, 5 image volumes using paired t-test) condition. These results reveal a high reliability of the proposed MRI method for imaging T1appand its change down to the pixel level, and this reproducibility is
crucial in generating reliable T1appmaps. Moreover, the determined T1appvalues under the
hypercapnia and ischemia perturbations were statistically different from the control T1app
value (p<0.01), indicating that the T1apprelaxation process is sensitive to the perfusion
changes induced by physiology/pathology perturbations. It is worth to note that adding more TSRpoints in a median TSRrange (e.g., few seconds) could be helpful to further improve the
fitting accuracy of T1app(or R1app) measurement with a tradeoff of reduced imaging temporal
resolution; nevertheless, the benefit on the outcome ofΔR
1app, thus,ΔCBF measurement is
in-significant because of the cancelation of the systematic errors of R1appmeasurements under
control and perturbation conditions (data not shown herein). One could optimize the TSR
val-ues and the number of TSRpoints for achieving a proper balance between the T1appfitting
Relationships between rCBF, relative R
1CBFand BOLD induced by
perturbations
Fig 3shows the high temporal resolution (~12 s per data point) time courses of relative R1CBF
(rR1CBF: the R1CBFratio between RC and PC conditions) and rBOLD measured by the SR-T1
MRI method from the ROI located in the rat sensory cortex and rCBF measured by LDF in the similar brain region before, during and after (a) transient hypercapnia and (b) acute ischemia perturbation from a representative rat. Despite some fluctuations, these time courses display ex-pected temporal behaviors and dynamics. First, there are approximately parallel trends among all of the measured time courses. Secondly, the transient hypercapnia led to significant increases in the measured parameters owing to the vascular dilation effect, thus, increasing perfusion fol-lowed by a recovery back to the baseline level after the termination of hypercapnia. Thirdly, the acute ischemia caused rapid reductions in all measured parameters followed by a substantial overshooting (reperfusion) after the termination of ischemia and a slow recovery to the baseline level. Nevertheless, a careful examination ofFig 3suggests a stronger temporal correlation be-tween the measured rR1CBFand rCBF (correlation coefficient = 0.84 for hypercapnia and 0.90 for
Fig 2. T1appregression time courses with the SR-T1MRI method.Time courses from a single SR-T1
GE-EPI measurement and T1appregression under control (black lines); hypercapnia (blue lines); and
ischemia (red lines) conditions based on (a) ROI and (b) single EPI pixel located inside the rat brain cortex. Colored dots are the signal data points imaged at different TSRs under different conditions. Three T1fitting
lines and their T1appvalues under three conditions are also displayed in (a) and (b). The inserts show a
coronal brain GE-EPI from a representative rat, indicating the location of (a) the ROI (enclosed in the green solid line) and (b) a single pixel (green cross mark) used for the regression (sse stands for the sum squared error; R2= 0.99).
ischemia, p<0.01) compared to the correlation of rR1CBFversus rBOLD (correlation
coeffi-cient = 0.78 for hypercapnia and 0.75 for ischemia, p<0.01). Relative BOLD (rBOLD) shows a more significant undershoot after the hypercapnia (Fig 3a) and a smaller overshooting after the ischemia than that of rR1CBFand rCBF (Fig 3b). These results reveal the feasibility of the SR-T1
Fig 3. Time courses of relative rR1CBF, rBOLD and rCBF of hypercapnia and global ischemia
experiments.Time courses of relative R1CBF(rR1CBF) and relative BOLD (rBOLD) measured by the SR-T1
MRI method, relative CBF change (rCBF) measured by LDF before, during and after (a) hypercapnia and (b) ischemia perturbation from a representative rat (data extracted from a region of interest). The bar graphs on top indicate the experimental acquisition protocol of (a) hypercapnia and (b) ischemia. Five stages are defined for imaging acquisition under varied animal conditions. Stage 1 represents the control (or prior-perturbation) period (2 minutes) prior to the induction of perturbations (i.e., hypercapnia or ischemia). Stage 2 represents the perturbation period either for the transient hypercapnia (7 minutes) or acute ischemia (1 minute). Stages 3, 4 and 5 represent the three post-perturbation periods with varied time duration after either the transient hypercapnia or acute ischemia perturbation. Because the post-perturbation effects on CBF and BOLD responses were much shorter for the 1-minute acute ischemia perturbation than that of 7-minute transient hypercapnia perturbation, the durations for these three stages were different for these two perturbation studies: i) for the hypercapnia perturbation: 8 minutes for Stage 3; 3.4 minutes for Stage 4 and 3.2 minutes for Stage 5; and ii) for the ischemia: 2.4 minutes for Stage 3; 1.4 minutes for Stage 4 and 1.2 minutes for Stage 3. Please note that there were noticeable dynamic response delays (about 2 minutes) of CBF and BOLD response owing to a large dead volume in the ventilation system when slowly increasing the inhaled CO2concentration during the hypercapnia experiment.
MRI method to simultaneously measure BOLD and rR1CBFwhich is tightly correlated to the
CBF change; and its ability to temporally dissociate the BOLD and CBF responses with relatively high temporal resolution. It is also interesting to note that the rR1CBFtime course had a relatively
large fluctuation compared to the BOLD time course, presumably owing to a moderately low in-herent contrast-to-noise ratio to measure the CBF change.
During the ischemia perturbation, R1CBFdecreased 4.7±1.2% (n = 5) compared to the
con-trol condition, which was equivalent to a 5.1±1.4% increase ofΔT1CBF; accordingly, CBF de-creased 89.5±1.8% and BOLD dede-creased 23.1±2.8%. During the hypercapnia, in contrast, R1CBFincreased 5.1±0.8% (n = 3);ΔT1CBFdecreased 4.8 ± 0.7%; CBF increased 82±12%; and
BOLD increased 4.5±2.7%.
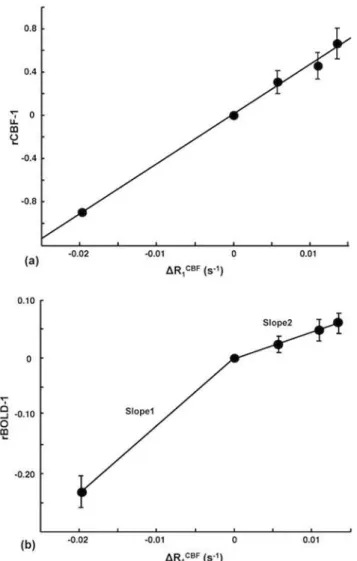
Fig 4shows the plots ofΔR1CBFversus (rCBF-1) (Fig 4a) and versus (rBOLD-1) (Fig 4b) measured for the ischemia study. It indicates an excellent consistency and strong linear
Fig 4. Correlation betweenΔR1CBFversus (a) rCBF-1 and (b) rBOLD-1.Correlation between the averagedΔR1CBFmeasured by the SR-T1MRI method versus (a) rCBF-1 and (b) rBOLD-1 obtained during
the five stages of ischemia experiment. The vertical bars indicate the standard error (SEM) (n = 5). There is a strong, positive correlation between (rCBF-1) andΔR1CBFin (a). In contrast, there are two distinct linear fitting
slopes between (rBOLD-1) andΔR1CBFin (b) owing to the decoupled change between them during the
post-ischemia stages.
correlation between the CBF change andΔR
1CBFacross all five stages studied; and the
correla-tion can be described by the following numerical equacorrela-tion that was obtained by the linear re-gression:
ðrCBF 1Þ ¼45:9DRCBF
1 þ0:01 ð10Þ
with R2= 0.99. In contrast, two distinct linearfitting slopes (slope ratio = 2.6) were observed betweenΔR1CBFand (rBOLD-1), indicating the independence of the SR-T1MRI method for si-multaneously determiningΔR
1CBFand BOLD; and showing the decoupled changes of these
two physiological parameters during the post-ischemia stages.
Table 1summarizes the results of simultaneous rCBF (by LDF) andΔR
1CBFmeasurements
(by the SR-T1MRI method) during the ischemia (Stage 2) and the first post-ischemia period
(Stage 3) for each rat and averages among inter-subjects. TheΔR
1CBFvalue was used to
calcu-late the CBF change (ΔCBF) according to (Eq 9), and then rCBF andΔCBF were applied to es-timate the reference control (or baseline condition) CBF (i.e., CBFRC) according to the
following relationship:
CBFRC¼DCBF=ðrCBF 1Þ ð11Þ
The estimated CBFRCwas 1.19±0.27 ml/g/min calculated from the ischemia stage (Stage 2)
data, and 1.24±0.31 ml/g/min calculated from the first post-ischemia stage (Stage 3) data, showing an excellent consistency between them. The estimated baseline CBF values in this study are coincident with the reported values in the literature ranging from 0.9 to 1.5 ml/g/min (1.29±0.05 ml/g/min) measured in the rat cortex under similar isoflurane anesthesia condition, which are summarized inS1 Supporting Information. Furthermore, if we approximate the small interception value of 0.01 to zero in (Eq 10) and replace (rCBF-1) term in (Eq 11) with the approximated (Eq 10), we derived CBFRC= (60sec/min)λ(ml/g)/45.9(sec) = 1.18 ml/g/min
using the relationship of (Eq 9). This value based on the regressed slope of 45.9 sec in (Eq 10) using the data shown inFig 4ais again in good agreement with the averaged literature value of 1.29±0.05 ml/g/min. These comparison results provide ample evidence supporting the feasibili-ty and reliabilifeasibili-ty of the proposed SR-T1MRI method in measuring and quantifying the CBF
changes induced by physiological/pathological perturbations.
Table 1. Summary ofΔR1CBF,ΔCBF, (rCBF-1) and the estimated reference control CBF.
Ischemia Stage (Stage 2) Ischemia Overshooting Stage (Stage 3)
Rat No. ΔR1CBF(s-1) CalculatedΔCBF
(ml/g/min)
rCBF-1 Control CBF (ml/g/min)
ΔR1CBF(s-1) CalculatedΔCBF
(ml/g/min)
rCBF-1 Control CBF (ml/g/min)
1 -0.023 -1.247 -0.883 1.413 0.014 0.751 0.332 2.263
2 -0.036 -1.928 -0.899 2.145 0.024 1.280 1.104 1.159
3 -0.014 -0.778 -0.924 0.841 0.016 0.880 0.597 1.474
4 -0.012 -0.664 -0.833 0.798 0.006 0.346 0.834 0.415
5 -0.013 -0.713 -0.938 0.760 0.007 0.389 0.445 0.874
Mean
±SEM
-0.020 ±0.005
-1.066±0.239 -0.895 ±0.018
1.191±0.267 0.013 ±0.003
0.729±0.172 0.662 ±0.139
1.237±0.310
Summary ofΔR1CBF, calculated CBF change (ΔCBF) based onΔR1CBF, (rCBF-1) measured with LDF during the ischemia (Stage 2) and thefirst
post-ischemia stage (Stage 3); and the estimated reference control CBF offive individual rats and its mean and standard error values.
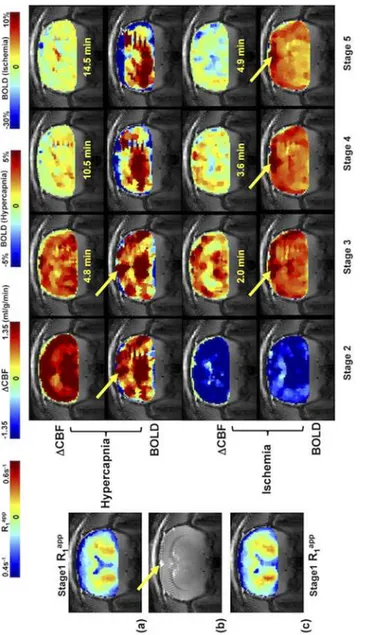
Fig 5shows the control R1appimages (coronal orientation) of rat brain, anatomic image, and
theΔCBF and BOLD images measured by the SR-T
1MRI method during and after the
hyper-capnia/ischemia perturbation in a representative rat without the use of LDF probe to avoid the susceptibility MRI artifacts. It illustrates that the SR-T1MRI method is robust and sensitive for
noninvasively imaging the CBF changes in response to a physiological (hypercapnia) or patho-logical (ischemia) challenge with a few minutes of image acquisition time. Moreover, the BOLD images can also be simultaneously obtained.
Fig 5. Coronal anatomic image, R1appimages,ΔCBF and BOLD images of a representative rat.(a) and (c) Reference control R1appimages (acquired during Stage 1); the SR-T1MRI method generatedΔCBF and
BOLD images of Stage 2 to Stage 5 obtained from (a) hypercapnia and (c) ischemia study, respectively from a representative rat brain. (b) Anatomic coronal image from the same rat. The time indicated between the ΔCBF and BOLD images is the approximate image sampling time after the termination of Stage 2. The yellow arrows point to the sinus vessel. The total image averaging time for Stages 2 to 5 were: 2.5, 6.5, 4.6 and 3.2 minutes for the hypercapnia study; and 1.0, 1.8, 1.4 and 1.2 minutes for the ischemia study.
Discussion
Underlying mechanism for imaging CBF change in rat brain using the
SR-T
1imaging method
Instead of focusing on the magnetization change by delivering tagged spins to the image slice (s) at a certain TIRin the ASL approach, T1perfusion model [2,5,6,10] views CBF circulation
as an enhanced longitudinal relaxation through T1appas defined in (Eq 6). The rapid exchange
between the saturated water protons in the image slice and the fully relaxed arterial blood water outside of the saturation region during the SR-T1MRI measurement enables a
quantita-tive link between T1appand CBF. Based on the current MRI acquisition scheme used in this
study, (Eq 5) (valid for Phase 1, when TSR<ttran) and (Eq 7) (valid for Phase 2 when TSR
ttran) quantitatively describe the magnetization change as a function of TSRfor the SR-T1MRI
method with a two-phase perfusion model shown inFig 1d. According to (Eq 5), the brain tis-sue relaxation depends on both T1appand T1awhen TSR<ttran(Phase 1), however, the term B
in (Eq 5) which contains T1aaccounts for only few percentages of the term A and its
contribu-tion to the magnetizacontribu-tion relaxacontribu-tion becomes insignificant. Therefore, a single exponential re-covery function according to the T1apprelaxation time provides a good approximation. When
TSRttran(Phase 2), the brain tissue magnetization relaxation solely follows T1appaccording
to (Eq 7). Therefore, T1appdominates the magnetization change through the entire TSR
cover-ing both Phase 1 and Phase 2, and can be robustly regressed for determincover-ing CBF changes. The excellent T1appfitting curve (and excellent linearity in semi-log fitting, data not shown herein),
as well as the high reproducibility and sensitivity to CBF alteration as shown inFig 2 demon-strate that the single exponential function regression worked well in this study.
LDF measures a frequency shift in light reflected from moving red blood cells [30,31]. It en-ables a real-time, continuous recording of relative (or percentage) CBF change in a focal region inside the brain; and is regarded as a standard tool for dynamic CBF measurements [32]. More-over, LDF-based CBF measurements have been reported to be in good agreement with the ra-dioactive microsphere CBF techniques [31,33] as well as the hydrogen clearance CBF methods [34]. The excellent correlation betweenΔR
1CBFmeasured with the SR-T1method and relative
CBF change recorded by LDF technique (Figs3and4) during physiological/pathological per-turbations, and the coincidence between the calculated baseline CBF results and the reported CBF values in the literature clearly suggest thatΔR1CBFimaged by the SR-T1MRI method quantitatively reflects the CBF changes. Besides the contributions from intrinsic T1and CBF,
T1appcan be also slightly influenced by other factors, for example, temperature. Although the
temperature correction of T1appcould improve the accuracy of measurement, T1appwithout
the correction still provide a good approximation to calculate CBF change since the tempera-ture induced T1change is small (seeS1 Supporting Information).
Advantages, limitations and methodology aspects of the SR-T1
method
for imaging CBF change and BOLD
The SR-T1MRI method has several unique merits when comparing it with the conventional
ASL techniques using an inversion-recovery preparation. First, the modeling used to quantita-tively link T1appand CBF in the SR-T1MRI method is simple and it requires much less
physio-logical parameters aiming to quantify absoluteΔCBF according to (Eq 9). Second, the SR-T
1
MRI method relies on parametric T1appmapping; thus, it does not require the paired control
rapid mapping of T1appandΔR1appto generate theΔCBF image as illustrated inFig 5. Although
the imaging of T1apprequires multiple measurements with varied TSRvalues, its temporal
reso-lution of 12 s per complete image set is comparable with other ASL methods (approximately 5–10 s). Fourth, the partial volume effect of cerebrospinal fluid (CSF) toΔCBF is minimal be-cause of the subtraction out the undisturbed CSF-related R1contribution under various animal
conditions, slow movement of CSF water spins (about 20 times slower than CBF, [35–37]) and the negligible exchange between CSF and brain tissue water spins.
This study was based on single slice measurement to prove the concept and feasibility of the proposed SR-T1MRI method, nevertheless, it should be readily extended to multiple image
slices covering a larger brain volume.
One technical limitation of the current SR-T1MRI method is its inability to directly measure
the baseline CBF value under a physiological condition of interest, thus, the control value of CBFRCwas indirectly estimated by two independent measurements ofΔCBF and rCBF using
the SR-T1MRI method and LDF, respectively, in this study. This technique is more useable for
imaging CBF changes, thus, requiring two measurement conditions, for instance, reference con-trol versus perturbation (similar to the BOLD measurement) as presented in this study.
A surface RF coil generates an inhomogeneous distribution of B1in space, resulting in a
non-uniform RF pulse flip angle for saturating the water magnetization if a linear RF pulse waveform is used. In this study, we applied an adiabatic half passage 90° RF pulse to achieve relatively uniform 90° rotation of Mzinto the transverse plane and to improve saturation
effi-ciency, in particular, in the brain cortical region where B1is strong. The ROI for data
process-ing was chosen from this region (seeFig 2for an example). In the deep brain region, distant from the surface coil, it might not be warranted to approach an adiabatic 90° rotation if the RF power is inadequate in this brain region. As a result, the RF saturation efficiency (0α1) can drop in the deep brain region and lead to relatively low saturation efficiency. However, this im-perfection, if it exists, should not cause a significant error in determining T1appowing to the
fol-lowing two reasons.
First, the term ofαwas considered in the least square regression to calculate the T
1appvalue
using the following formula
SI¼SI0e TE T
2ð1 ae TSR T1appÞ
¼kð1 ae
TSR T1appÞ
ð12Þ
in which three constants,k,αand T1appare determined by regression. Thoughαcan become less than 1 in the deep brain region if B1strength is inadequately strong, it can be treated as a
constant. The T1appregression becomes insensitive to the absolute value ofα; and the
regres-sion outcome is mainly determined by the exponential rate of SI recovery as a function of TSR.
Second, a nominal 90° excitation pulse and a very short TE were used in the GE-EPI sam-pling in this study. In addition, there was no extra delay between the EPI signal acquisition and the next RF saturation pulse. This configuration further reduces the residual Mzcomponent
(or suppresses the Mzrecovery) before the next magnetization saturation preparation. It acts as
extra magnetization saturation, resulting in an improved saturation efficiency and insensitivity of regression to the value ofα. These notions are supported by theΔCBF images (Fig5aand
5c) showing relatively uniform CBF changes across the entire image slice including the deep brain region. In contrast, the BOLD images show the‘hot’spots around the sinus vein as point-ed by the arrows inFig 5because of the large BOLD effect near a large sinus vein [19]. Such
more specific to the tissue perfusion and less susceptible to macro vessels. This differentiation between the simultaneously measured BOLD andΔCBF images suggests that the SR-T
1MRI
method indeed is able to independently but simultaneously measure two important physiologi-cal parameters: CBF change and BOLD. Although, there is a similar trend between the mea-sured changes ofΔCBF and BOLD during ischemia or hypercapnia perturbation as shown in this study, there are clearly distinct characters in both spatial distribution and temporal behav-ior between theΔCBF and BOLD images during the recovery periods after the perturbations, which provide complementary information of the brain hemodynamic changes in response to physiological/pathological perturbations.
The SR-T1MRI method is based on the exponential fitting of R1appusing multiple EPI
im-ages with varied saturation-recovery times, and the R1appchanges caused by either hypercapnia
or ischemia were small (<5%). Therefore, the accuracy of fitting is susceptible to the EPI image noise level, in particular, in the brain regions with EPI susceptibility artifacts or weak B1of the
surface coil.
Relationship between
Δ
R1
CBFand the CBF change during ischemia and
hypercapnia
It is known that the development of vasogenic edema usually occurs at a later phase, approxi-mately 30 minutes after the induction of regional ischemia [38]; and the water accumulation in the ischemic tissue owing to cellular swelling takes place hours after the onset of ischemia [39,
40]. It is unlikely that vasogenic edema and water content change could be responsible for the measuredΔR
1CBFchange in the present study since the global ischemia lasted only one minute
and the SR-T1MRI measurements were continued within a relative short period during the
post-perturbation stages. Therefore,ΔR
1CBFimaged by the SR-T1MRI method could be fully
quantified to determine and imageΔCBF. This notion is evident from the results of the ische-mia study; and it also holds true for the hypercapnia study. However, it would be interesting to investigate the longitudinal T1appchange in the severely or chronically ischemic brain region,
which could be affected by the CBF change and possibly other physiopathological changes (in-farction, edema, necrosis etc.) of brain tissue. Further study of their relative contributions to the T1appchange would be helpful to understand the evolution of the ischemic lesion and its
re-lationship with CBF change.
A similar estimation using the relationship of rCBF andΔCBF measured during the hyper-capnia (Stage 2) resulted in the CBFRCvalue of 1.36±0.35 ml/g/min (n = 3). This value is close
to that were calculated with the data collected during the ischemic/post-ischemic stages (1.2 ml/g/min) although they are not exactly the same. This small discrepancy might be due to the slightly basal CBF drifting through the prolonged period of experiment because two experi-ments (hypercapnia and ischemia) were combined during the same MRI scanning session. It could also be related to the limited sampling size of hypercapnia experiments. Nevertheless, ΔCBF increase induced by hypercapnia calculated fromΔR1CBFcorrelates well with rCBF
mea-sured by LDF.
Correlation of R1
CBF, CBF and BOLD during perturbations
andΔR1CBF(Fig 4b). There was also a substantial“undershooting”in the measured BOLD change during the later post-hypercapnia recovery stages (Fig 3a) compared to rCBF or rR1CBF.
One explanation for this observation is that BOLD signal reflects a complex interplay among CBF, cerebral blood volume (CBV) and oxygen consumption rate (CMRO2) [19,20].
There-fore, BOLD can become decoupled with the CBF change, and degree of the mismatched BOLD andΔCBF relies on the fractional changes in CBF, CBV and CMRO
2in response to a particular
perturbation. The quantitative interpretation of the mismatched rCBF-rBOLD behavior re-quires additional measurements of CBV and CMRO2, which is beyond the scope of this article.
Nevertheless, this mismatch could be linked to the uncoupling between the metabolic and he-modynamic responses associated with a physiology or pathology perturbation, and it should be useful for indirectly estimating the CMRO2time course during the perturbation if the CBV
change can be measured independently or estimated using a sophisticated BOLD modeling (e.g., [41]). In addition, the measured BOLD using the SR-T1MRI method under fully relaxed
condition reflects the“true”BOLD without the CBF confounding effect; thus, further improve the outcome of quantification [23].
A local RF coil, such as a surface coil as used in the present study, has been commonly ap-plied for mostin vivoanimal MRI/MRS brain studies. Its B1field (or profile) induces regional
longitudinal magnetization changes through saturation (or inversion) preparation prior to the EPI acquisition. The combination of regional Mzpreparation and relatively short artery
blood traveling time from the non-saturated region into the EPI slice in animal brains is the underlying mechanism for a quantitative link betweenΔCBF andΔR1that can be robustly imaged by the SR-T1MRI method. Consequently, the T1or T1-weighted MRI signal changes
commonly observed in the clinical imaging diagnosis, for instance, stroke patients, are at least partially attributed by the impaired perfusion, i.e.,ΔCBF. Finally, the SR-T
1MRI
meth-od can also be combined with a volume RF coil for imagingΔCBF with the implement of a slice-selective saturation preparation.
Conclusion
In summary, we have described the SR-T1MRI method for noninvasively and simultaneously
imaging the absolute CBF change and BOLD in response to physiological/pathological pertur-bations. This imaging method was rigorously validated in the rat brain with simultaneous LDF measurements under global ischemia and hypercapnia conditions. It should provide a robust, quantitative MRI-based neuroimaging tool for simultaneously measuring the CBF change and BOLD contrast associated with physiological perturbations (e.g., brain activation) or pathologi-cal perturbations (e.g., stroke or pharmaceutipathologi-cal drug treatment).
Supporting Information
S1 Supporting Information.Detailed equation derivation for two-phase arterial spin model of the SR-T1method and simulation results. Supporting information regarding the confounding
effect of brain temperature change on T1app.
(DOCX)
Author Contributions
References
1. Detre JA, Leigh JS, Williams DS, Koretsky AP. Perfusion imaging. Magn Reson Med. 1992; 23(1):37–
45. PMID:1734182.
2. Kwong KK, Belliveau JW, Chesler DA, Goldberg IE, Weisskoff RM, Poncelet BP, et al. Dynamic mag-netic resonance imaging of human brain activity during primary sensory stimulation. Proc Natl Acad Sci U S A. 1992; 89(12):5675–9. PMID:1608978.
3. Williams DS, Detre JA, Leigh JS, Koretsky AP. Magnetic resonance imaging of perfusion using spin in-version of arterial water. Proc Natl Acad Sci U S A. 1992; 89(1):212–6. PMID:1729691.
4. Edelman RR, Siewert B, Darby DG, Thangaraj V, Nobre AC, Mesulam MM, et al. Qualitative mapping of cerebral blood flow and functional localization with echo-planar MR imaging and signal targeting with alternating radio frequency. Radiology. 1994; 192(2):513–20. PMID:8029425.
5. Kim SG. Quantification of relative cerebral blood flow change by flow-sensitive alternating inversion re-covery (FAIR) technique: application to functional mapping. Magn Reson Med. 1995; 34(3):293–301.
PMID:7500865.
6. Schwarzbauer C, Morrissey SP, Haase A. Quantitative magnetic resonance imaging of perfusion using magnetic labeling of water proton spins within the detection slice. Magn Reson Med. 1996; 35(4):540–
6. PMID:8992204.
7. Wong EC, Buxton RB, Frank LR. Implementation of quantitative perfusion imaging techniques for func-tional brain mapping using pulsed arterial spin labeling. NMR Biomed. 1997; 10(4–5):237–49. PMID:
9430354.
8. Buxton RB, Wong EC, Frank LR. Dynamics of blood flow and oxygenation changes during brain activa-tion: the balloon model. Magn Reson Med. 1998; 39(6):855–64. PMID:9621908.
9. Kim SG, Ugurbil K. Comparison of blood oxygenation and cerebral blood flow effects in fMRI: estima-tion of relative oxygen consumpestima-tion change. Magn Reson Med. 1997; 38(1):59–65. PMID:9211380. 10. Kwong KK, Chesler DA, Weisskoff RM, Donahue KM, Davis TL, Ostergaard L, et al. MR perfusion
stud-ies with T1-weighted echo planar imaging. Magn Reson Med. 1995; 34(6):878–87. PMID:8598815. 11. Calamante F, Lythgoe MF, Pell GS, Thomas DL, King MD, Busza AL, et al. Early changes in water
diffu-sion, perfudiffu-sion, T1, and T2during focal cerebral ischemia in the rat studied at 8.5 T. Magn Reson Med.
1999; 41(3):479–85. PMID:10204870.
12. Lythgoe MF, Thomas DL, Calamante F, Pell GS, King MD, Busza AL, et al. Acute changes in MRI diffu-sion, perfudiffu-sion, T1, and T2in a rat model of oligemia produced by partial occlusion of the middle
cere-bral artery. Magn Reson Med. 2000; 44(5):706–12. PMID:11064405.
13. van der Toorn A, Dijkhuizen RM, Tulleken CA, Nicolay K. T1 and T2 relaxation times of the major 1H-containing metabolites in rat brain after focal ischemia. NMR Biomed. 1995; 8(6):245–52. PMID:
8732180.
14. Shen Q, Du F, Huang S, Duong TQ. Spatiotemporal characteristics of postischemic hyperperfusion with respect to changes in T1, T2, diffusion, angiography, and blood-brain barrier permeability. J Cereb Blood Flow Metab. 2011; 31(10):2076–85. PMID:21540871. doi:10.1038/jcbfm.2011.64
15. Quesson B, de Zwart JA, Moonen CT. Magnetic resonance temperature imaging for guidance of ther-motherapy. J Magn Reson Imaging. 2000; 12(4):525–33. PMID:11042633.
16. Parker DL, Smith V, Sheldon P, Crooks LE, Fussell L. Temperature distribution measurements in two-dimensional NMR imaging. Med Phys. 1983; 10(3):321–5. PMID:6877179.
17. Dickinson RJ, Hall AS, Hind AJ, Young IR. Measurement of changes in tissue temperature using MR imaging. J Comput Assist Tomogr. 1986; 10(3):468–72. PMID:3700752.
18. Botnar R. Interventional Magnetic Resonance Imaging, chapter 21 Temperature sensitive MR se-quences. Berlin: Springer .: Springer Berlin Heidelberg; 1998.
19. Ogawa S, Lee TM, Nayak AS, Glynn P. Oxygenation-sensitive contrast in magnetic resonance image of rodent brain at high magnetic fields. Magn Reson Med. 1990; 14(1):68–78. PMID:2161986. 20. Ogawa S, Lee T-M, Kay AR, Tank DW. Brain magnetic resonance imaging with contrast dependent on
blood oxygenation. Proc Natl Acad Sci USA. 1990; 87:9868–72. PMID:2124706
21. Mansfield P. Multi-planar image formation using NMR spin echoes. J Phys C. 1977; 10:L55–L8. 22. Ackerman JJ, Grove TH, Wong GG, Gadian DG, Radda GK. Mapping of metabolites in whole animals
by 31P NMR using surface coils. Nature. 1980; 283(5743):167–70. Epub 1980/01/10. PMID:7350541. 23. Wang X, Zhu XH, Zhang Y, Chen W. Large enhancement of perfusion contribution on fMRI signal. J
24. Tsekos NV, Zhang F, Merkle H, Nagayama M, Iadecola C, Kim SG. Quantitative measurements of ce-rebral blood flow in rats using the FAIR technique: correlation with previous iodoantipyrine autoradio-graphic studies. Magn Reson Med. 1998; 39(4):564–73. PMID:9543418.
25. Barbier EL, Silva AC, Kim SG, Koretsky AP. Perfusion imaging using dynamic arterial spin labeling (DASL). Magn Reson Med. 2001; 45(6):1021–9. PMID:11378880.
26. Zhang W, Williams DS, Detre JA, Koretsky AP. Measurement of brain perfusion by volume-localized NMR spectroscopy using inversion of arterial water spins: accounting for transit time and cross-relaxa-tion. Magn Reson Med. 1992; 25(2):362–71. PMID:1614321.
27. Pulsinelli WA, Brierley JB. A new model of bilateral hemispheric ischemia in the unanesthetized rat. Stroke. 1979; 10(3):267–72. PMID:37614.
28. Haase A, Frahm J, Matthaei D, Hanicke W, Merboldt KD. FLASH imaging. Rapid NMR imaging using low flip angle pulses. J Magn Reson. 1986; 67:258–66.
29. Strupp JP. Stimulate: A GUI based fMRI analysis software package. Neuroimage 3:S607. 1996.
30. Stern MD. In vivo evaluation of microcirculation by coherent light scattering. Nature. 1975; 254 (5495):56–8. PMID:1113878.
31. Dirnagl U, Kaplan B, Jacewicz M, Pulsinelli W. Continuous measurement of cerebral cortical blood flow by laser-Doppler flowmetry in a rat stroke model. J Cereb Blood Flow Metab. 1989; 9(5):589–96. PMID:
2674168.
32. Wadhwani KC R. Blood flow in the central and peripheral nervous system. In laser-Doppler blood flow-metry (öberg PA, ed).: Boston, MA: Kluwer Academic,; 1988. pp 265–88 p.
33. Fabricius M, Lauritzen M. Laser-Doppler evaluation of rat brain microcirculation: comparison with the [14C]-iodoantipyrine method suggests discordance during cerebral blood flow increases. J Cereb Blood Flow Metab. 1996; 16(1):156–61. PMID:8530548.
34. Kramer MS, Vinall PE, Katolik LI, Simeone FA. Comparison of cerebral blood flow measured by laser-Doppler flowmetry and hydrogen clearance in cats after cerebral insult and hypervolemic hemodilution. Neurosurgery. 1996; 38(2):355–61. PMID:8869064.
35. Hazel RD, McCormack EJ, Miller J, Li J, Yu M, Benveniste H, et al., editors. Measurement of Cerebro-spinal Fluid Flow in the Aqueduct of a Rat Model of Hydrocephalus ISMRM Proceedings; 2006; Seat-tle, Washington, USA.
36. Kreis D, Schulz D, Stein M, Preuss M, Nestler U. Assessment of parameters influencing the blood flow velocities in cerebral arteries of the rat using ultrasonographic examination. Neurol Res. 2011; 33 (4):389–95. doi:10.1179/1743132810Y.0000000010PMID:21535938.
37. Linninger AA, Xenos M, Zhu DC, Somayaji MR, Kondapalli S, Penn RD. Cerebrospinal fluid flow in the normal and hydrocephalic human brain. IEEE transactions on bio-medical engineering. 2007; 54 (2):291–302. doi:10.1109/TBME.2006.886853PMID:17278586.
38. Bell BA, Symon L, Branston NM. CBF and time thresholds for the formation of ischemic cerebral edema, and effect of reperfusion in baboons. J Neurosurg. 1985; 62(1):31–41. PMID:3964854. 39. Iwama T, Yamada H, Andoh T, Sakai N, Era S, Sogami M, et al. Proton NMR studies on ischemic rat
brain tissue. Magn Reson Med. 1992; 25(1):78–84. PMID:1593959.
40. Young W, Rappaport ZH, Chalif DJ, Flamm ES. Regional brain sodium, potassium, and water changes in the rat middle cerebral artery occlusion model of ischemia. Stroke. 1987; 18(4):751–9. PMID:
3603602.