LARGE SYNOPTIC SURVEY TELESCOPE:
FROM SCIENCE DRIVERS TO REFERENCE DESIGN
ˇ
Z. Ivezi´c1, T. Axelrod2, W. N. Brandt3, D. L. Burke4, C. F. Claver5, A. Connolly1,
K. H. Cook6, P. Gee7, D. K. Gilmore4, S. H. Jacoby2, R. L. Jones1, S. M. Kahn4,
J. P. Kantor2, V. Krabbendam5, R. H. Lupton8, D. G. Monet9, P. A. Pinto10, A. Saha5,
T. L. Schalk11, D. P. Schneider3, M. A. Strauss7, C. W. Stubbs12, D. Sweeney2,
A. Szalay13, J. J. Thaler14, and J. A. Tyson7 for the LSST Collaboration
1Department of Astronomy, University of Washington, Box 351580, Seattle, WA 98195
E–mail: [email protected]
2LSST Corporation, 4703 E. Camp Lowell Drive, Suite 253, Tucson, AZ 85712
3Department of Astronomy and Astrophysics, The Pennsylvania State University,
525 Davey Lab, University Park, PA 16802
4Kavli Institute for Particle Astrophyics and Cosmology, Stanford Linear Accelerator Center,
Stanford University, Stanford, CA, 94309
5National Optical Astronomy Observatory, 950 N. Cherry Ave, Tucson, AZ 85719
6Lawrence Livermore National Laboratory, 7000 East Avenue, Livermore, CA 94550
7Physics Department, University of California, One Shields Avenue, Davis, CA 95616
8Department of Astrophysical Sciences, Princeton University, Princeton, NJ 08544
9U.S. Naval Observatory Flagstaff Station, 10391 Naval Observatory Road, Flagstaff, AZ 86001
10Steward Observatory, The University of Arizona, 933 N Cherry Ave., Tucson, AZ 85721
11University of California–Santa Cruz, 1156 High St., Santa Cruz, CA 95060
12Departments of Physics and Astronomy, Center for Astrophysics, Harvard University,
60 Garden St., Cambridge, MA 02138
13Department of Physics and Astronomy, The John Hopkins University,
3701 San Martin Drive, Baltimore, MD 21218
14University of Illinois, Physics and Astronomy Departments,1110 W. Green St., Urbana, IL 61801
SUMMARY: In the history of astronomy, major advances in our understanding of the Universe have come from dramatic improvements in our ability to accurately measure astronomical quantities. Aided by rapid progress in information technology, current sky surveys are changing the way we view and study the Universe. Next-generation surveys will maintain this revolutionary progress. We focus here on the most ambitious survey currently planned in the visible band, the Large Synoptic Survey Telescope (LSST). LSST will have unique survey capability in the faint time domain. The LSST design is driven by four main science themes: constraining dark energy and dark matter, taking an inventory of the Solar System, exploring the transient optical sky, and mapping the Milky Way. It will be a large, wide-field ground-based system designed to obtain multiple images covering the sky that is visible from Cerro Pach´on in Northern Chile. The current baseline design, with an 8.4 m (6.5 m effective) primary mirror, a 9.6 deg2 field of view, and a 3,200 Megapixel camera, will allow about 10,000 square degrees of sky to be covered using pairs of 15-second exposures in two photometric bands every three nights on average. The system is designed to yield high image quality, as well as superb astrometric and photometric accuracy. The survey area will include 30,000 deg2 with δ <+34.5◦, and will be imaged multiple times in six bands, ugrizy, covering the wavelength range 320–1050 nm. About 90% of the observing time will be devoted to a deep-wide-fast survey mode which will observe a 20,000 deg2 region about 1000 times in the six bands during the anticipated 10 years of operation. These data will result in databases including 10 billion galaxies and a similar number of stars, and will serve the majority of science programs. The remaining 10% of the observing time will be allocated to special programs such as Very Deep and Very Fast time domain surveys. We describe how the LSST science drivers led to these choices of system parameters.
Key words. Astronomical data bases: miscellaneous – Atlases – Catalogs – Surveys – Solar system: general – Stars: general – Galaxy: general – Galaxies: general – Cosmology: miscellaneous
1. INTRODUCTION
1.1. Large scale surveys: a new way of seeing
Major advances in our understanding of the Universe have historically arisen from dramatic im-provements in our ability to ”see”. We have de-veloped progressively larger telescopes over the past century, allowing us to peer farther into space, and further back in time. With the development of advanced instrumentation – imaging, spectroscopic, and polarimetric – we have been able to parse radia-tion detected from distant sources over the full elec-tromagnetic spectrum in increasingly subtle ways. These data have provided the detailed information needed to construct physical models of planets, stars, galaxies, quasars, and larger structures.
Until recently, most astronomical investiga-tions have focused on small samples of cosmic sources or individual objects. This is because our largest telescope facilities have rather small fields of view, typically only a few square arcminutes – a tiny frac-tion (few parts per hundred million) of the sky, and those with large fields of view could not detect very faint sources. With all of our existing telescope fa-cilities, we have still surveyed only a minute volume of the observable Universe.
Over the past two decades, however, advances in technology have made it possible to move beyond the traditional observational paradigm and to
un-dertake large-scale sky surveys. As vividly demon-strated by surveys such as the Sloan Digital Sky Survey (SDSS, York et al. 2000), the Two Micron All Sky Survey (2MASS, Skrutskie et al. 2006), and the Galaxy Evolution Explorer (GALEX, Martin et al. 2006), to name but a few, sensitive and accu-rate multi-color surveys over a large fraction of the sky enable an extremely broad range of new scien-tific investigations. These results, based on synergy of advances in telescope construction, detectors, and above all, information technology, have dramatically impacted nearly all fields of astronomy – and many areas of fundamental physics. In addition, the re-cent world-wide attention received by Google Sky1 (Scranton et al. 2007) demonstrates that the impact of sky surveys extends far beyond fundamental sci-ence progress and reaches all of society.
Motivated by the evident scientific progress made possible by large sky surveys, three recent nationally endorsed reports by the U.S. National Academy of Sciences2 concluded that a dedicated ground-based wide-field imaging telescope with an effective aperture of 6–8 meters is a high priority for planetary science, astronomy, and physics over the next decade. The Large Synoptic Survey Telescope (LSST) described here is such a system. The LSST will be a large, wifield ground based telescope de-signed to obtain multi-band images over a substan-tial fraction of the sky every few nights. The survey will yield contiguous overlapping imaging of over half
1
http://earth.google.com/sky/
2
the sky in six optical bands, with each sky location visited about 1000 times over 10 years.
The purpose of this paper is to provide a sum-mary of the main LSST science drivers and how they led to the current system design parameters, as de-scribed in§2. A project status report and concluding remarks are presented in§3. For detailed and up-to-date information, please consult the LSST website (www.lsst.org).
2. THE LSST REFERENCE DESIGN
The most important characteristic that deter-mines the speed at which a system can survey a given sky area to a given depth (faint flux limit) is its ´etendue (or grasp), the product of its primary mir-ror area and the field-of-view area (assuming that observing conditions such as seeing, sky brightness, etc., are fixed). The effective ´etendue for LSST will be greater than 300 m2 deg2, which is more than an order of magnitude larger than that of any exist-ing facility. For example, the SDSS, with its 2.5-m telescope (Gunn et al. 2006) and a camera with 30 imaging CCDs (Gunn et al. 1998), has an effective ´etendue of only 7.5 m2 deg2.
The range of scientific investigations which will be enabled by such a dramatic improvement in survey capability is extremely broad. Guided by the community-wide input assembled in the report of the Science Working Group of the LSST3, the LSST de-sign is focused to achieve goals set by four main sci-ence themes:
(1) Constraining Dark Energy and Dark Matter (2) Taking an Inventory of the Solar System (3) Exploring the Transient Optical Sky (4) Mapping the Milky Way
Each of these four themes itself encompasses a variety of analyses, with varying sensitivity to in-strumental and system parameters. These themes fully exercise the technical capabilities of the system, such as photometric and astrometric accuracy and image quality. The working paradigm is that all sci-entific investigations will utilize a common database constructed from an optimized observing program, such as that discussed in Section 3. Here we briefly describe the science goals and the most challenging requirements for the telescope and instruments that are derived from those goals, which led to the overall system design decisions discussed below. For a more detailed discussion, we refer the reader to the LSST Science Requirements Document4, as well as to the numerous LSST poster presentations at the recent 211th Meeting of the AAS5.
2.1. The Main Science Drivers
The main science drivers are used to optimize numerous system parameters. Ultimately, in this high-dimensional parameter space, there is a one-dimensional manifold defined by the total project cost. The science drivers must both justify this cost, as well as provide guidance on how to optimize var-ious parameters while staying on the cost manifold. Here we summarize a dozen most important inter-locking constraints on data properties imposed by the four main science themes:
o The depth of a single visit (an observation con-sisting of two back-to-back exposures of the same region of sky)
o Image quality
o Photometric Accuracy o Astrometric Accuracy o Optimal exposure time o The filter complement
o The distribution of revisit times (i.e. the ca-dence of observations)
o The total number of visits to a given area of the sky
o The coadded survey depth
o The distribution of visits on the sky, and the total sky coverage
o The distribution of visits per filter
o Data processing and data access (e.g. time delay for reporting transient sources and the software contribution to measurement errors) We present a detailed discussion of how these science-driven data properties are transformed to system parameters below.
2.2. Constraining Dark Energy and Dark Matter
Current models of cosmology require the exis-tence of both dark matter and dark energy to match observational constraints (Spergel et al. 2007). Dark energy affects the cosmic history of both the Hub-ble expansion and mass clustering. If combined, dif-ferent types of probes of the expansion history and structure history can lead to percent level precision in dark energy and other cosmological parameters. These tight constraints arise because each technique depends on the cosmological parameters or errors in different ways. These probes include weak gravita-tional lens (WL) cosmic shear, baryon acoustic os-cillations (BAO), supernovae, and cluster counting – all as a function of redshift. Using the cosmic mi-crowave background as normalization, the combina-tion of these probes can yield the needed precision to distinguish between models of dark energy (Zhan 2006, and references therein). In addition, time-resolved strong galaxy and cluster lensing probes the physics of dark matter. This is because the positions
3
Available ashttp://www.lsst.org/Science/docs/DRM2.pdf 4
Available athttp://www.lsst.org/Science/docs.shtml 5
and profiles of multiple images of a source galaxy depend sensitively on the total mass distribution, in-cluding the dark matter, in the lensing object.
While LSST WL and BAO probes will yield the strongest dark energy and dark matter con-straints, two major programs from this science theme that provide unique and independent constraints on the system design are
o Weak lensing of galaxies, and o Type Ia Supernovae.
Weak lensing (WL) techniques can be used to map the distribution of mass as a function of redshift and thereby trace the history of both the expansion of the universe and the growth of structure (e.g. Hu and Tegmark 1999, Wittman et al. 2000, for a review see Bartelmann and Schneider 2001). These investi-gations require deep wide-area multi-color imaging with stringent requirements on shear systematics in at least two bands, and excellent photometry in all bands. The strongest constraints on the LSST image quality come from this science program. In order to control systematic errors in shear measurement, it is mandatory to obtain the desired depth with many short exposures (which effectively enables ”random-ization” of systematic errors). Detailed simulations of weak lensing techniques show that, in order to obtain a sample of ∼3 billion lensing galaxies, the coadded map must cover ∼20,000 deg2, and reach a depth ofr∼27.5 (5σfor point sources), with several hundred exposures per field and sufficient signal-to-noise in at least five other bands to obtain accurate photometric redshifts (Zhan 2006). Because of their low surface brightness, this depth optimizes the num-ber of detected galaxies in ground-based seeing, and allows their detection in significant numbers to be-yond a redshift of two. It is anticipated that opti-mal science analysis of weak lensing will place strong constraints on data processing software, such as si-multaneous analysis of all the available data (Tyson et al. 2008).
Type Ia supernovae (SN) provided the first ev-idence that the expansion of the universe is acceler-ating (Riess et al. 1998, Perlmutter et al. 1999). To fully exploit the supernovae science potential, light-curves sampled in multiple bands every few days over the course of a few months are required. This is essential to search for systematic differences in su-pernovae populations which may masquerade as cos-mological effects, as well as to determine photomet-ric redshifts from the supernovae themselves. Un-like other cosmological probes, even a single object can provide useful constraints and, therefore, a large number of SN across the sky can enable a high an-gular resolution search for any dependence of dark energy properties on direction, which would be an indicator of new physics.
Given the expected SN flux distribution, the single visit depth should be at least r ∼ 24. Good image quality is required to separate SN photomet-rically from their host galaxies. Observations in at least five photometric bands are necessary to ensure that, for any given supernova, light-curves in several
bands will be obtained (due to the spread in red-shift). The importance of K-corrections to supernova cosmology implies that the calibration of the relative offsets in photometric zero points between filters and the knowledge of the system response functions, es-pecially near the edges of bandpasses, must be accu-rate to about 1% (Wood-Vasey et al. 2007). Deeper data (r > 26) for a small area of the sky can ex-tend the discovery of SN to a mean redshift of 0.7, with some objects beyond z ∼1. The added sta-tistical leverage on the ”pre-acceleration” era would improve constraints on the properties of dark energy as a function of redshift.
2.3. Taking an Inventory of the Solar System
The small-body populations in the Solar Sys-tem, such as asteroids, trans-Neptunian objects (TNOs) and comets, are remnants of its early as-sembly. The history of accretion, collisional grind-ing, and perturbation by existing and vanished giant planets is preserved in the orbital elements and size distributions of those objects. In the main asteroid belt between Mars and Jupiter collisions still occur, and occasionally objects are ejected on orbits that may take them on a collision course with the Earth. As a result, the Earth orbits within a swarm of asteroids; some number of these objects will ul-timately strike Earth’s surface. In December 2005, the U.S. Congress directed6 NASA to implement a near-Earth object (NEO) survey that would catalog 90% of NEOs larger than 140 meters by 2020. About 20% of NEOs, the potentially hazardous asteroids or PHAs, are in orbits that pass sufficiently close to Earth’s orbit, to within 0.05 AU, that perturbations with time scales of a century can lead to intersec-tions and the possibility of collision. In order to ful-fill the Congressional mandate using a ground-based facility, a 10-meter class telescope equipped with a multi-gigapixel camera, and a sophisticated and ro-bust data processing system are required (Ivezi´c et al. 2007). The search for NEOs also places strong constraints on the cadence of observations, requiring closely spaced pairs of observations (two or prefer-ably three times per lunation) in order to link obser-vations unambiguously and derive orbits. Individ-ual exposures should be shorter than about 1 minute each to minimize the effects of trailing for the major-ity of moving objects. The images must be well sam-pled to enable accurate astrometry, with absolute ac-curacy of at least 0.1 arcsec. The images should reach a depth of at least∼24.5 (5σfor point sources) in the rband in order to probe the∼0.1 km size range at main-belt distances, and to fulfill the Congressional NEO mandate. The photometry should be better than 1-2% to enable color-based taxonomic classifi-cation.
2.4. Exploring the Transient Optical Sky
Recent surveys have shown the power of vari-ability for studying gravitational lensing, searching for supernovae, determining the physical properties of gamma-ray burst sources, and many other projects
6
at the forefront of astrophysics (Tyson 2006, and ref-erences therein). A wide-area dense temporal cov-erage to deep limiting magnitudes would enable the discovery and analysis of rare and exotic objects such as neutron star and black hole binaries, gamma-ray bursts and X-ray flashes, at least some of which ap-parently mark the deaths of massive stars; AGNs and blazars; and very possibly new classes of tran-sients, such as binary mergers and stellar disruptions by black holes. It is likely that such a survey would detect numerous microlensing events in the Local Group and perhaps beyond, and open the possibility of discovering planets and obtaining spectra of lensed stars in distant galaxies as well as our own.
Time domain science requires large area cov-erage to enhance the probability of detecting rare events; good time sampling, since light curves are necessary to distinguish certain types of variables and in some cases to infer their properties (e.g. de-termining of the intrinsic luminosity of supernovae Type Ia depends on measurements of their rate of de-cline); accurate color information to assist with the classification of variable objects; good image quality to enable discerning of images, especially in crowded fields; and rapid data reduction, classification and reporting to the community in order to flag interest-ing objects for spectroscopic and other investigations with separate facilities. Time scales ranging from 1 min (to constrain the properties of fast faint tran-sients such as optical flashes associated with gamma-ray bursts (Kaspi et al. 2007) and transients recently discovered by the Deep Lens Survey, Becker et al. 2004) to 10 years (to study long-period variables and quasars) should be probed over a significant fraction of the sky. It should be possible to measure colors of fast transients, and to reach faint magnitude limits in individual visits (at least the Deep Lens Survey limit ofr∼24.5).
2.5. Mapping the Milky Way
A major objective of modern astrophysics is to understand when and how galaxies formed and evolved. Theories of galaxy formation and evolution can be tested and influenced by a significantly im-proved understanding of the distribution and kine-matics of stars in our own Galaxy, the Milky Way, which is a complex and dynamical structure that is still being shaped by the infall (merging) of neigh-boring smaller galaxies. We still lack robust answers to two basic questions about the Milky Way Galaxy: o What is the detailed structure and accretion
history of the Milky Way?
o What are the fundamental properties of all the stars within 300 pc of the Sun?
Key requirements for mapping the Galaxy are large area coverage, excellent image quality to max-imize the photometric and astrometric accuracy, es-pecially in crowded fields; photometric precision of at least 1% to separate main sequence and giant stars; astrometric precision of about 10 mas per
ob-servation to enable parallax and proper motion mea-surements; and dynamic range that allows measure-ments of astrometric standard stars at least as bright as r = 16. In order to probe the halo out to its presumed edge at∼100 kpc using numerous main-sequence stars, the total co-added depth must reach r >27, with a similar depth in thegband. To study the metallicity distribution of stars in the Sgr tidal stream (see e.g. Majewski et al. 2003) and other halo substructures at distances beyond the presumed in-ner vs. outer halo boundary (at least∼40 kpc), the co-added depth in the u band must reach ∼ 24.5. To detect RR Lyrae stars beyond the Galaxy’s tidal radius at∼300 kpc, the single-visit depth must be r ∼ 24.5. In order to constrain the tangential ve-locity of stars at a distance of 10 kpc, where halo dominates over disk, to within 10 km/s needed to be competitive with large-scale radial velocity sur-veys, the required proper motion accuracy is at least 0.2 mas/yr. The same accuracy follows from the requirement to obtain the same proper motion ac-curacy as Gaia (Perryman et al. 2001) at its faint limit (r∼20). In order to produce a complete sam-ple of solar neighborhood stars out to a distance of 300 pc (the thin disk scale height), with 3σor better geometric distances, trigonometric parallax measure-ments accurate to 1 mas are required. To achieve the required proper motion and parallax accuracy with an assumed astrometric accuracy of 10 milliarcsec per observation per coordinate, approximately 1,000 observations are required. This requirement on the number of observations is in good agreement with the independent constraint implied by the difference between the total depth and the single-visit depth.
2.6. A Summary and Synthesis of Science-driven
Constraints on Data Properties
The goals of all the science programs dis-cussed above (and many others, of course) can be ac-complished by satisfying the following minimal con-straints7
o The single visit depth should reach r ∼24.5. This limit is primarily driven by the NEO survey and variable sources (e.g. RR Lyrae stars), and by proper motion and trigono-metric parallax measurements for stars. Indi-rectly, it is also driven by the requirements on the coadded survey depth and the minimum number of exposures placed by weak lensing science.
o Image quality should maintain the limit set by the atmosphere (the median seeing is 0.7 arcsec in the r band at the chosen site), and not be degraded appreciably by the hardware. In addition to stringent constraints from weak lensing, good image quality is driven by re-quired survey depth for point sources and by image differencing techniques.
7
o Photometric repeatabilityshould achieve 5 mil-limag precision at the bright end, with zero-point stability across the sky of 10 millimag and band-to-band calibration errors not larger than 5 millimag. These requirements are driven by the photometric redshift accuracy, the separation of stellar populations, detec-tion of low-amplitude variable objects (such as eclipsing planetary systems), and the search for systematic effects in type Ia supernova light-curves.
o Astrometric precision should maintain the limit set by the atmosphere, of about 10 mil-liarcsec per visit at the bright end (on scales below 20 arcmin). This precision is driven by the desire to achieve a proper motion accuracy of 0.2 mas/yr and parallax accuracy of 1.0 mas over the course of a 10 year long survey. o The single visit exposure timeshould be less
than about a minute to prevent trailing of fast moving objects and to facilitate control of var-ious systematic effects induced by the atmo-sphere. It should be longer than∼20 seconds to avoid efficiency losses due to finite readout and slew time.
o The filter complementshould include at least six filters in the wavelength range limited by atmospheric absorption and silicon detection efficiency (320–1050 nm), with roughly rectan-gular filters and no large gaps in the coverage, in order to enable robust and accurate photo-metric redshifts, and stellar typing. An SDSS-like u band is extremely important for sepa-rating low-redshift quasars from stars, and for estimating metallicity of F/G main sequence stars. A bandpass with an effective wave-length of about 1 micron would enable studies of sub-stellar objects, high-redshift quasars, and regions of the Galaxy that are obscured by interstellar dust.
o The revisit time distributionshould allow SN light curves to be sampled every few days; this constraint is needed to obtain orbits of Solar System objects as well, while accomodating constraints set by proper motion and trigono-metric parallax measurements.
o The total number of visits of any given area of sky, when accounting for all filters, should be of the order of 1,000, as mandated by weak lensing science, the NEO survey, and proper motion and trigonometric parallax measure-ments. Studies of transient sources also bene-fit from a larger number of visits.
o The coadded survey depth should reach r ∼
27.5, with sufficient signal-to-noise ratio in other bands to address both extragalactic and Galactic science drivers.
o The distribution of visits per filter should enable accurate photometric redshifts, sepa-ration of stellar populations, and sufficient depth to make detection of faint extremely red sources posible (e.g. brown dwarfs and high-redshift quasars). Detailed simulations of photometric redshift estimates suggest an approximately flat distribution of visits among
bandpasses (because the system throughput and atmospheric properties are wavelength de-pendent, the achieved depths are different in different bands). The adopted time allocation (see Table 1) gives a slight preference to the r andi bands because of their dominant role for star/galaxy separation and weak lensing measurements.
o The distribution of visits on the skyshould ex-tend over at least∼20,000 deg2 to obtain the required number of galaxies for weak lensing studies, with attention paid to ”special” re-gions such as the Ecliptic, Galactic plane, and the Large and Small Magellanic Clouds. o Data processing, data products and data access
should enable efficient science analysis with-out a significant impact on the final uncertain-ties. To enable a fast and efficient response to transient sources, the processing latency should be less than a minute, with a robust and accurate preliminary classification of re-ported transients.
It is remarkable that, even with these joint re-quirements, none of the individual science programs is severely overdesigned. That is, despite their sig-nificant scientific diversity, these programs are highly compatible in terms of desired data characteristics. Indeed, any one of the four main science drivers could be removed, and the remaining three would still yield very similar requirements for most system parame-ters. As a result, the LSST system can adopt a highly efficient survey strategy wherea single dataset serves all science programs(instead of science-specific sur-veys executed in series). One can think of this as massively parallel astrophysics. The vast majority (about 90%) of the observing time will be devoted to a deep-wide-fast survey mode, with the remaining 10% of observing time allocated to special programs which will also address multiple science goals. Before describing these surveys in more detail, we discuss the main system parameters.
2.7. The Main System Design Parameters
Given the minimum science-driven constraints on the data properties listed in the previous section, we now discuss how they are translated into con-straints on the main system design parameters: the aperture size, the optimal exposure time, and the fil-ter complement. We also briefly describe the LSST reference design.
2.8. The Aperture Size
lifetime as free parameters. The adopted survey life-time of 10 years is a compromise between a shorter time that leads to an excessively large and expensive mirror (15 m for a 3 year-long survey and 12 m for a 5-year long survey), and a smaller telescope that would require more time to complete the survey, with the associated increase in operations cost.
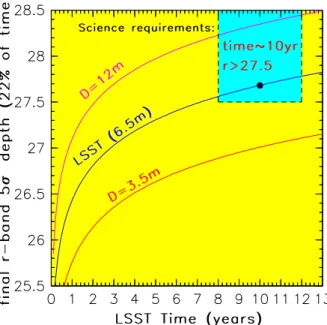
The primary mirror size is a function of the required survey depth and the desired sky coverage. By and large, the anticipated science outcome scales with the number of detected sources. For practically all astronomical source populations, in order to max-imize the number of detected sources, it is more ad-vantageous to maximize the area first, and then the detection depth. For this reason, the sky area for the main survey is also maximized to its practical limit, 20,000 deg2, determined by the requirement to avoid large airmasses (which would substaintially deteriorate the image quality and the survey depth). With the adopted field-of-view area, the sky coverage and the survey lifetime fixed, the primary mirror diameter is fully driven by the required survey depth. There are two depth requirements: the final (coadded) survey depth,r∼27.5, and the depth of a single visit,r∼24.5. The two requirements are com-patible if the number of visits is several hundred (per band), which is in good agreement with independent science-driven requirements on the latter.
The required coadded survey depth provides a direct constraint, independent of the details of sur-vey execution such as the exposure time per visit, on the minimum primary mirror diameter, as illustrated in Fig. 1.
Fig. 1. The co-added depth in the rband vs. aper-ture and the survey lifetime (r∼V, where V is the Johnson visual magnitude). It is assumed that 22% of the total observing time (corrected for weather and other losses) is allocated for therband, and that the ratio of the surveyed sky area to the field-of-view area is 2,000.
2.9. The Optimal Exposure Time
The single visit depth depends on both the pri-mary mirror diameter and the chosen exposure time. In turn, the exposure time determines the time in-terval to revisit a given sky position and the total number of visits, and each of these quantities has its own science drivers. We summarize these simul-taneous constraints in terms of single-visit exposure time:
o The single-visit exposure time should not be longer than about a minute to prevent trail-ing of fast Solar System movtrail-ing objects, and to enable efficient control of atmospheric sys-tematics.
o The mean revisit time (assuming uniform ca-dence) for a given position on the sky, n (days), scales as
n=
µ texp 10 sec
¶ µ
Asky 20,000 deg2
¶ µ10 deg2 AFOV
¶ ,
(1) where the losses for realistic observing condi-tions have been taken into account. Science drivers such as SN and moving objects in the Solar System require that n < 4, or equiva-lentlytexp<40 seconds for the nominal values of Asky and AFOV. Note that normalization by 20,000 deg2 is equivalent to two visits per night over 10,000 deg2.
o The number of visits to a given position on the sky,Nvisit, with losses for realistic observ-ing conditions taken into account, is given by
Nvisit= µ3000
n
¶ µ T
10 yr ¶
. (2)
The requirement Nvisit > 800, again implies thatn <4 andtexp<40 seconds if the survey lifetime,T ∼10 years.
o These three requirements place a firm up-per limit on the optimal exposure time of texp < 40 seconds. Surveying efficiency (the ratio of open-shutter time to the total time spent per visit) considerations place a lower limit on texp due to finite read-out and slew time (the longest acceptable read-out time is set to 2 seconds, and the slew and settle time is set to 5 seconds, including the read-out time for the second exposure in a visit):
ǫ=
µ texp
texp+ 9 sec ¶
. (3)
1. A primary mirror effective diameter of∼6.5 m. With the adopted optical design, described below, this effective diameter corresponds to a geometrical diameter of∼8 m. Motivated by characteristics of the existing equipment at the Steward Mirror Laboratory, which is cast-ing the primary mirror, the adopted geomet-rical diameter is set to 8.4 m.
2. A visit time of 30 seconds (using two 15 sec-ond exposures to efficiently reject cosmic rays; ǫ= 77%).
3. A revisit time of 3 days on average per 10,000 deg2 of sky, with two visits per night.
To summarize, the chosen primary mirror di-ameter is theminimumdiameter that simultaneously satisfies the depth (r ∼ 24.5 for single visit and r ∼ 27.5 for coadded depth) and cadence (revisit time of 3-4 days, with 30 seconds per visit) con-straints described above.
Fig. 2. The single-visit depth in the r band (5σ detection for point sources) vs. revisit time, n (or exposure time, texp = 10n seconds), as a function of aperture size. In addition to direct constraints on optimal exposure time, texp is also driven by require-ments on the revisit time,n, the total number of vis-its per sky position over the survey lifetime, Nvisit, and the survey efficiency, ǫ (see eqs.1-3). Note that these constraints result in a fairly narrow range of allowed texp for the main deep-wide-fast survey.
2.10. The Filter Complement
The LSST filter complement (ugrizy, see Fig. 3) is modeled after the Sloan Digital Sky Sur-vey (SDSS) system (Fukugita et al. 1996) because of its demonstrated success in a wide variety of appli-cations, including photometric redshifts of galaxies (Budav´ari et al. 2003), separation of stellar
popula-tions (Lenz et al. 1998, Helmi et al. 2003), and pho-tometric selection of quasars (Richards et al. 2002). The extension of the SDSS system to longer wave-lengths (they band at∼1 micron) is driven by the increased effective redshift range achievable with the LSST due to deeper imaging, the desire to study sub-stellar objects, high-redshift quasars, regions of the Galaxy that are obscured by interstellar dust, and the scientific opportunity offered by modern CCDs with high quantum efficiency in the near infrared.
Fig. 3. The current design of the LSST band-passes. The vertical axis shows the overall system throughput. The computation includes the atmo-spheric transmission, optics, and the detector sen-sitivity.
2.11. The LSST Reference Design
We briefly describe the reference design for the main LSST system components. Detailed discussion of the flow-down from science requirements to sys-tem design parameters, and extensive syssys-tem engi-neering analysis can be found in Claver et al. (2008, in prep.). Additional discussion of science drivers, description of data products and examples of sci-ence programs can be found in Ivezi´c et al. (2008, in prep.). Both publications will be maintained at the astro-ph site8, and should be consulted for the detailed and most up-to-date information about the LSST system.
2.12. Telescope and Site
The large LSST ´etendue is achieved in a novel three-mirror design (modified Paul-Baker, Davison and Angel 2002) with a very fast f/1.25 beam. The optical design has been optimized to yield a large field of view (9.6 deg2), with seeing-limited image quality, across a wide wavelength band (350–1050 nm). Incident light is collected by the primary mir-ror, which is an annulus with an outer diameter of 8.4 m (an effective diameter of 6.5 m), then reflected to a 3.4 m convex secondary, onto a 5 m concave tertiary, and finally into three refractive lenses in a camera (see Fig. 4). All three mirrors will be
ac-8
tively supported to control wavefront distortions in-troduced by gravity and environmental stresses on the telescope.
Fig. 4. The LSST baseline optical design with its unique monolithic mirror: the primary and tertiary mirrors are so positioned that they form a continu-ous compound surface, allowing them to be polished into a single substrate.
The telescope mount is a compact, stiff struc-ture with a fundamental frequency of nearly 10 Hz, which is crucial for achieving the required fast slew-and-settle times. The telescope sits on a concrete pier within a carousel dome that is 30 m in diam-eter. The dome has been designed to reduce dome seeing (local air turbulence that can distort images) and to maintain a uniform thermal environment over the course of the night. The LSST Observatory will be sited atop Cerro Pach´on in northern Chile, near the Gemini South and SOAR telescopes (latitude: S 30◦ 10’ 20.1”; longitude: W 70◦ 48’ 0.1”; elevation:
2123 m; the medianrband zenith seeing: 0.7 arcsec).
Fig. 5. The LSST camera with a person to indicate scale size. The camera is positioned in the middle of the telescope and will include a filter mechanism and shuttering capability.
2.13. Camera
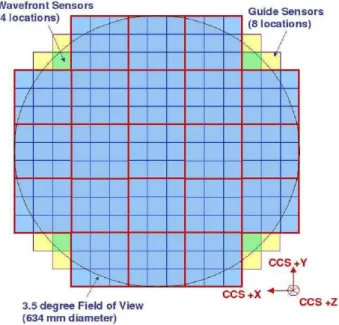
The LSST camera provides a 3.2 Gigapixel flat focal plane array, tiled by 4K x 4K CCD sen-sors with 10 µm pixels (see Figs. 5 and 6). This pixel count is a direct consequence of sampling the
∼10 deg2 field-of-view with 0.2×0.2 arcsec2 pixels (Nyquist sampling). The sensors are deep depleted, back-illuminated devices with a highly segmented ar-chitecture that enables the entire array to be read in 2 seconds.
Fig. 6. The LSST focal plane. Each cyan square represents one4096×4096 pixel large sensor. Nine sensors are assembled into a raft; the 21 rafts are outlined in red. There are 189 science sensors, each with 16.8 Mpix, for a total pixel count of 3.2 Gpix.
2.14. Data Management
The rapid cadence of the LSST observing pro-gram will produce an enormous volume of data, ∼
30 TB per night, leading to a total database over the ten years of operations of 60 PB for the raw data, and 30 PB for the catalog database. The total data volume after processing will be several hundred PB, processed using substantial computing power (∼100 TFlops). Processing such a large volume of data, converting the raw images into a faithful represen-tation of the universe, and archiving the results in useful form for a broad community of users is a ma-jor challenge.
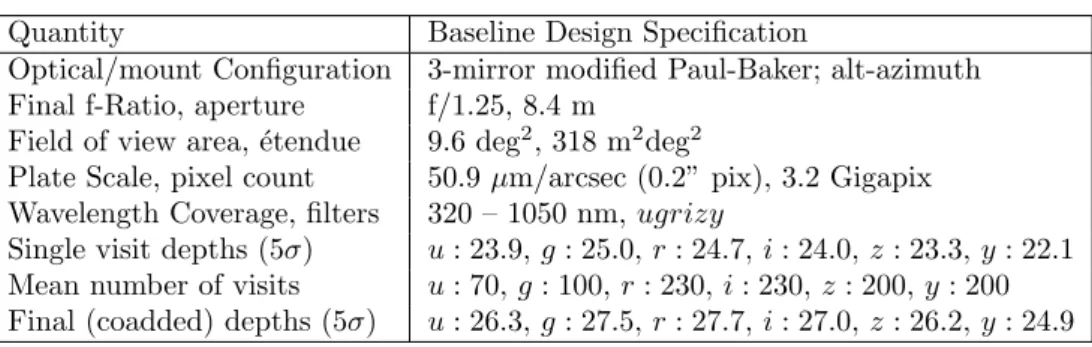
Table 1. The LSST Baseline Design and Survey Parameters.
Quantity Baseline Design Specification
Optical/mount Configuration 3-mirror modified Paul-Baker; alt-azimuth Final f-Ratio, aperture f/1.25, 8.4 m
Field of view area, ´etendue 9.6 deg2, 318 m2deg2
Plate Scale, pixel count 50.9µm/arcsec (0.2” pix), 3.2 Gigapix Wavelength Coverage, filters 320 – 1050 nm,ugrizy
Single visit depths (5σ) u: 23.9,g: 25.0,r: 24.7,i: 24.0,z: 23.3,y : 22.1 Mean number of visits u: 70, g: 100,r: 230,i: 230,z: 200,y: 200 Final (coadded) depths (5σ) u: 26.3,g: 27.5,r: 27.7,i: 27.0,z: 26.2,y : 24.9
well as a central archive facility and multiple data ac-cess centers. The data will be transported over exist-ing high-speed optical fiber links from South America to the U.S.
2.15. The Baseline Main Deep-Wide-Fast Survey
The fundamental basis of the LSST concept is to scan the sky deep, wide, and fast, and to obtain a dataset that simultaneously satisfies the majority of science goals. This concept, so-called ”universal ca-dence”, will yield the main deep-wide-fast survey and use about 90% of the observing time. The observing strategy will be optimized to maximize the scientific throughput by minimizing slew and other downtime and by making appropriate choices of the filter bands given the real-time weather conditions. As often as possible, each field will be observed twice, with vis-its separated by 15-60 minutes. This strategy will provide motion vectors to link detections of moving objects in the Solar System, and fine-time sampling for measuring short-period variability. The resulting sky coverage for LSST baseline cadence, based on detailed operations simulations, is shown for the r band in Fig. 7. The anticipated total number of
Fig. 7. The distribution of the rband visits on the sky for the baseline main survey. The sky is shown in Aitoff projection in equatorial coordinates and the number of visits for a 10-year survey is color-coded according to the inset. The two regions with smaller number of visits than the main survey are the Galac-tic plane (arc on the left) and the so-called ”northern Ecliptic region” (upper right). It is likely that the re-gion around the South Celestial Pole will also receive substantial coverage.
visits for a ten-year LSST survey is 2,767,595 (∼5.5 million 15-second long exposures). The per-band al-location of these visits is shown in Table 1. The re-maining 10% of observing time will be used to obtain improved coverage of parameter space such as very deep (r ∼26) observations, observations with very short revisit times (∼1 minute), and observations of ”special” regions such as the Ecliptic, Galactic plane, and the Large and Small Magellanic Clouds.
3. CONCLUSIONS
Until recently, most astronomical investiga-tions have focused on small samples of cosmic sources or individual objects. Over the past decade, however, advances in technology have made it possible to move beyond the traditional observational paradigm and to undertake large-scale sky surveys, such as SDSS, 2MASS, GALEX and many others. This observa-tional progress, based on synergy of advances in tele-scope construction, detectors, and above all, infor-mation technology, has a dramatic impact on nearly all fields of astronomy, many areas of fundamental physics, and the society in general.
The LSST builds on the experience of these surveys and addresses the broad goals stated in sev-eral nationally endorsed reports by the U.S. National Academy of Sciences. The realization of the LSST involves extraordinary engineering and technological challenges: the fabrication of large, high-precision optics; construction of a huge, highly-integrated ar-ray of sensitive, wide-band imaging sensors; and the operation of a massive data management facility han-dling tens of terabytes of data each day. The project is scheduled to have first light in 2014 and the begin-ning of survey operations in 2015.
LSST has been conceived as a public facility: the database that it will produce, and the associ-ated object catalogs that are generassoci-ated from that database, will be made available to the world’s sci-entific community and to the public at large with no proprietary period. LSST will be a significant mile-stone in the globalization of the information revolu-tion. The LSST data management system will pro-vide user-friendly tools to access this database and to support user-initiated queries, run on LSST com-puters, either at the archive facility or at the data access centers. We expect that many, perhaps even the majority of LSST discoveries will come from re-search astronomers with no formal affiliation to the project, from students, and from interested ama-teurs, intrigued by the accessibility to the universe that this facility uniquely provides.
Acknowledgements– In 2003, the LSST Corporation was formed as a non-profit 501(c)3 Arizona corpora-tion with headquarters in Tucson, AZ. Membership has since expanded to more than twenty members including Brookhaven National Laboratory, Califor-nia Institute of Technology, Carnegie Mellon Uni-versity, Columbia UniUni-versity, Google Inc., Harvard-Smithsonian Center for Astrophysics, Johns Hopkins University, Kavli Institute for Particle Astrophysics and Cosmology - Stanford University, Las Cum-bres Observatory Global Telescope Network, Inc., Lawrence Livermore National Laboratory, National Optical Astronomy Observatory, Princeton Univer-sity, Purdue UniverUniver-sity, Research Corporation, Stan-ford Linear Accelerator Center, The Pennsylvania State University, The University of Arizona, Uni-versity of California at Davis, UniUni-versity of Cali-fornia at Irvine, University of Illinois at Urbana-Champaign, University of Pennsylvania, University of Pittsburgh, and the University of Washington. LSST is a public-private partnership. Design and development activity is in part supported by the Na-tional Science Foundation under Scientific Program Order No. 9 (AST-0551161) and Scientific Program Order No. 1 (AST-0244680) through Cooperative Agreement AST-0132798. Portions of this work are supported by the Department of Energy under con-tract DE-AC02- 76SF00515 with the Stanford Linear Accelerator Center, contract DE-AC02- 98CH10886 with Brookhaven National Laboratory, and contract DE-AC52-07NA27344 with Lawrence Livermore Na-tional Laboratory. AddiNa-tional funding comes from private gifts, grants to universities, and in-kind sup-port at Department of Energy laboratories and other LSSTC Institutional Members. NOAO is operated by the Association of Universities for Research in As-tronomy, Inc. (AURA) under cooperative agreement with the National Science Foundation. KHC’s work was performed under the auspices of the U.S. D.O.E. by LLNL under contract DE- AC52-07NA27344.
REFERENCES
Bartelmann, M. and Schneider, P.: 2001, Physics Reports,340, 291.
Becker, A.C., Wittman, D.M., Boeshaar, P. C. et al.: 2004,Astrophys. J.,611, 418.
Budav´ari, T., Connolly, A. J., Szalay, A. S. et al.: 2003,Astrophys. J.,595, 59.
Davison, W. and Angel, R.: 2002, in ”Survey and Other Telescope Technologies and Discover-ies”, Tyson, J. A. and Wolff, S., eds. Pro-ceedings of the SPIE,4836, 110.
Fukugita, M., Ichikawa, T., Gunn, J.E. et al.: 1996, Astron. J.,111, 1748.
Gunn, J. E., Carr, M., Rockosi, C. et al.: 1998, As-tron. J., 116, 3040.
Gunn, J. E., Siegmund, W. A., Mannery, E. J. et al.: 2006,Astron. J.,131, 2332.
Helmi, A., Ivezi´c, ˇZ., Prada, F. et al.: 2003, Astro-phys. J.,586, 195.
Hu, W. and Tegmark, M.: 1999,Astrophys. J.,514, L65.
Ivezi´c, ˇZ, Tyson, J. A., Juri´c, M. et al.: 2007, Pro-ceedings of IAU Symposium 236. Edited by G.B. Valsecchi and D. Vokrouhlick´y. Cam-bridge: Cambridge University Press, 353 (also astro-ph/0701506).
Kaspi, S., Brandt, W. N., Maoz, D. et al.: 2007, Astrophys. J.,659, 997.
Lenz, D. D., Newberg, J., Rosner, R. et al.: 1998, Astrophys. J. Suppl. Series, 119, 121. Majewski, S. R., Skrutskie, M. F., Weinberg, M. D.
and Ostheimer, J. C.: 2003, Astrophys. J.,
599, 1082.
Martin, D. C., Fanson, J., Schiminovich, D. et al.: 2006,Astrophys. J.,619, L1.
Perlmutter, S., Aldering, G., Goldhaber, G. et al.: 1999,Astrophys. J.,517, 565.
Perryman, M. A. C., de Boer, K. S., Gilmore, G. et al.: 2001,Astron. Astrophys., 369, 339. Richards, G. T., Fan, X., Newberg, H. J. et al.: 2002,
Astron. J.,123, 2945.
Riess, A. G., Filippenko, A. V., Challis, P. et al.: 1998,Astron. J.,116, 1009.
Scranton, R., Connolly, A., Krughoff, S. et al.: 2007, astro-ph/0709.0752
Spergel, D. N., Bean, R., Dor´e, O. et al.: 2007, As-trophys. J. Suppl. Series,170, 377.
Tyson, J. A.: 2006,Nature,442, 364.
Tyson, J. A., Roat, C., Bosch, J. and Wittman, D.: 2008, Astronomical Data Analysis Soft-ware and Systems XVII, ASP Conference Se-ries, Vol. XXX, 2008; J. Lewis, R. Argyle, P. Bunclarck, D. Evans, and E. Gonzales-Solares, eds.
Wittman, D. M., Tyson, J. A., Kirkman, D., Dell’Antonio, I. and Bernstein, G.: 2000, Na-ture, 405, 143.
Wood-Vasey, W. M., Miknaitis, G., Stubbs, C. W. et al.: 2007,Astrophys. J.,666, 694.
York, D. G., Adelman, J., Anderson, S. et al.: 2000, Astron. J.,120, 1579.
LSST: OD NAUQNIH CILjEVA DO DIZAJNA
ˇ
Z. Ivezi´c1, T. Axelrod2, W. N. Brandt3, D. L. Burke4, C. F. Claver5, A. Connolly1,
K. H. Cook6, P. Gee7, D. K. Gilmore4, S. H. Jacoby2, R. L. Jones1, S. M. Kahn4,
J. P. Kantor2, V. Krabbendam5, R. H. Lupton8, D. G. Monet9, P. A. Pinto10, A. Saha5,
T. L. Schalk11, D. P. Schneider3, M. A. Strauss7, C. W. Stubbs12, D. Sweeney2,
A. Szalay13, J. J. Thaler14, and J. A. Tyson7 for the LSST Collaboration
1Department of Astronomy, University of Washington, Box 351580, Seattle, WA 98195
E–mail: [email protected]
2LSST Corporation, 4703 E. Camp Lowell Drive, Suite 253, Tucson, AZ 85712
3Department of Astronomy and Astrophysics, The Pennsylvania State University,
525 Davey Lab, University Park, PA 16802
4Kavli Institute for Particle Astrophyics and Cosmology, Stanford Linear Accelerator Center,
Stanford University, Stanford, CA, 94309
5National Optical Astronomy Observatory, 950 N. Cherry Ave, Tucson, AZ 85719
6Lawrence Livermore National Laboratory, 7000 East Avenue, Livermore, CA 94550
7Physics Department, University of California, One Shields Avenue, Davis, CA 95616
8Department of Astrophysical Sciences, Princeton University, Princeton, NJ 08544
9U.S. Naval Observatory Flagstaff Station, 10391 Naval Observatory Road, Flagstaff, AZ 86001
10Steward Observatory, The University of Arizona, 933 N Cherry Ave., Tucson, AZ 85721
11University of California–Santa Cruz, 1156 High St., Santa Cruz, CA 95060
12Departments of Physics and Astronomy, Center for Astrophysics, Harvard University,
60 Garden St., Cambridge, MA 02138
13Department of Physics and Astronomy, The John Hopkins University,
3701 San Martin Drive, Baltimore, MD 21218
14University of Illinois, Physics and Astronomy Departments,1110 W. Green St., Urbana, IL 61801
UDK 520.2 Pregledni rad po pozivu
U istoriji astronomije, veliki
po-maci u naxem razumevanju Vasione qesto su proizlazili iz dramatiqnog napretka u mogunostima preciznog merenja
astronom-skih veliqina. Zahvaljujui brzom razvoju
informacionih tehnologija, savremeni pre-gledi neba menjaju naqin na koji posmatramo i prouqavamo Vasionu. Pregledi neba sledee
pregleda u kratkim vremenskim
intervali-ma. Dizajn LSST odreuju qetiri primarna
nauqna zadatka: ograniqavanje na parametre vezane za tamnu energiju i tamnu materiju, pravljenje inventara objekata Sunqevog sis-tema, istraжivanje kratkotrajnih pojava na nebu u vidljivom delu spektra i mapiranje Mleqnog puta. Teleskop e predstavljati ve-liki, zemaljski, xirokougaoni sistem dizajni-ran za dobijanje vixestrukih snimaka koji bi u potpunosti pokrili nebo vidljivo iz mesta
Cerro Pach´on u severnom Qileu. Aktuelni osnovni dizajn predvia primarno ogledalo
preqnika 8.4 m (efektivno 6.5 m), vidno
polje od 9.6 kvadratnih stepeni i kameru sa 3200 megapiksela, xto e omoguiti da se u dve ekspozicije od po 15 sekundi, u dva fo-tometrijska filtera, za tri noi u prose-ku, pokrije ukupno 10 000 kvadratnih stepeni neba. Sistem je dizajniran tako da obezbedi visok kvalitet snimaka, kao i izuzetnu
as-trometrijsku i fotometrijsku taqnost. Pre-gled e pokriti ukupnu povrxinu od 30 000 kvadratnih stepeni, u oblasti deklinacija
δ <+34.5◦, snimajui vixe puta u xest
fil-tera, ugrizy, koji pokrivaju oblasti
talas-nih duжina od 320–1050 nm. Oko 90%
posma-traqkog vremena bie iskorixeno za rad u tzv. dubokom-xirokom-brzom modu, pri qemu e se, tokom predvienih 10 godina rada teleskopa, otprilike 1000 puta u xest fil-tera posmatrati oblast od 20 000 kvadrat-nih stepeni. Prikupljeni podaci e biti poh-ranjeni u bazu koja e ukljuqivati oko 10 milijardi galaksija i pribliжno isti broj zvezda, i koja e sluжiti veini nauqnih pro-grama. Preostalih 10% posmatraqkog vremena predvieno je za posebne programe kao xto su
Vrlo Duboki i Vrlo Brzi pregledi. Ovde
opisujemo kako se od nauqnih zadataka
pro-gramaLSSTdoxlo do ovih izbora parametara