Automatic System to Remove Unpleasant Images
Detected by Pupil-Size Changes
Koji Kashihara1, Momoyo Ito1, and Minoru Fukumi1
1
Institute of Technology and Science, The University of Tokushima 2-1 Minamijyousanjima, Tokushima 770-8506, Japan
Abstract
An automatic filtering system to classify individual unpleasant emotions represented by pupil-size changes was proposed. The support vector machines classifier was applied to single-trial data of pupil size and indicated the possibility of the correct judgment of individually unpleasant states immediately after looking at emotional pictures. The framework was then constructed to automatically filter the similar unpleasant information from a picture database, applying the bag of features scheme to search for similar images.
Keywords: Pupil Size, Emotion, Database Search, Support Vector Machines
1. Introduction
For patients with amyotrophic lateral sclerosis (ALS) who cannot freely move their muscles [1], it may be desirable to construct an automatic system such as a brain-machine (BMI) or -computer interface (BCI) to express their emotions and to realize the smooth communication with others. Healthy people also receive various emotional changes to multimedia contents. However, the interactive method considering individually different emotional states has been insufficiently investigated. Individually designed devices to detect the underlying state of human mind would be effective as an interactive communication tool.
A human-machine or -computer interface considering individual preference would be realized by the camera image processing and analysis for facial expressions [2]. However, the individual impression of emotional pictures varies from person to person; there are some difficult cases to speculate or judge the emotional state from the camera image or facial information alone. The idea of an automatic system to abstract individually favorite data or to exclude unpleasant ones would increase the usability for the websites and databases with various kinds of images.
Individual emotions can be estimated by some physiological parameters. For example, the autonomic nervous system (heart rate, pupil size, etc.) as well as brain activity is known as an index associated with emotional
states. Pupil size is particularly modulated by emotional changes such as pleasure and displeasure [3]. Because the pupil size can be noninvasively recorded with an eye camera, it is easier to work toward practical use of various devices.
There are a few examples as the application of eye-movement signals such as eye tracking and saccades [4]. However, the analytical method for a classifier to detect an individual’s emotion based on pupil-size changes has never been established. Accordingly, this study aimed to develop a framework for an automatic system (1) to abstract individually unpleasant images from pupil-size changes, (2) to search for similar pictures from a database without textual information, and finally (3) to filter them from image materials such as websites.
The support vector machines (SVM) classifier with the high rate of classification in electroencephalography (EEG) signals was applied for this study. The noninvasive measurement of EEG signals requires the extraction of meaningful data from low spatial resolution with artificial noises. An SVM classifier can actually solve such a difficulty and has indicated highly accurate performance to detect important information from single-trial signals [5]. Therefore, we investigated the optimal features and parameters of SVM to classify the pupil-size change reflecting emotion. The automatic filtering system was then constructed to remove individually unpleasant information from a picture database, using the bag of features (BoF) scheme.
2. System Design
An automatic system to extract an individually unpleasant image, to search for similar images, and to filter them in multimedia contents was developed. In accordance with the following steps, the proposed system was designed.
recorder. The picture stimuli were rated to evaluate the level of subjective emotion.
(2) Detection of Emotional State. The three features for a classifier were extracted after the preprocessing of the raw data on pupil size. The responses to emotional pictures were classified by the SVM scheme. The emotional state was subdivided into two categories: the unpleasant or neutral state.
(3) Validation of Classification. After the SVM classifier was firstly trained using single-trial data of pupil size, the accuracy of the trained classifiers with several features and parameters were assessed by the unknown data.
(4) Searching for Emotional Pictures. Referencing the unpleasant picture individually detected by the pupil-size change, the similar ones were explored from a picture database. Histograms of visual words were used for this method.
(5) Filtering System. On the emotional pictures detected by above procedures, we proposed an automatic system to remove individually unpleasant materials in websites.
3. Analysis of Pupil Size
3.1 Dataset
Participants in the dataset [6] were eight healthy volunteers with normal or corrected-to-normal vision (4 males and 4 females, age: 28.9 ± 4.9 years). Emotional pictures were selected from the International Affective Picture System (IAPS) [7] and included unpleasant and neutral categories. All pictures were converted to 8-bit grayscale bitmaps. The mean and distribution of the luminance of grayscale pictures were adjusted not to differ among the pictures sets. The picture size was 360 × 270 pixels (12.6 × 9.5º of visual angle).
Binocular pupil size was recorded using an EyeLink CL 1000 Desktop (SR Research Co.) with a software for EyeLink (Ver. 4.4) on a PC (DELL Co., Precision T3400), at a sampling rate of 500 Hz. A standard five-point camera calibration was performed; the absolute error of the gaze position was set within 0.5º of visual angle.
Visual stimuli were presented on a screen of a 19-inch monitor (a resolution of 1024 × 768 pixels) at the same height as the eyes. The distance from the stimuli was set at 60 cm. A trial started with a fixation cross (size of 0.76º),
which was presented between 1 and 1.5 s. An unpleasant or neutral picture selected from the dataset was randomly presented for 100 ms at the center on a screen. The inter-trial interval was set at 8 s.
The emotional pictures for the visual stimuli were rated, using a 1-7 scale (the range from 1, extremely negative, to 7, extremely positive). In the rating scores, the paired t-test revealed that there was a significant difference between the picture conditions (p < 0.01): 4.4 ± 0.9 vs. 2.5 ± 0.5 in the neutral and unpleasant pictures.
3.2 Detection of Pupil-size Change
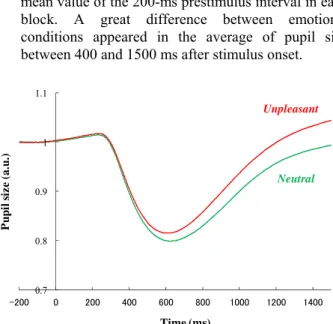
(1) Preprocessing: The trial data with eye blink artifacts were removed from the analysis. The responses of binocular pupil sizes were averaged at every sampling point. The signals were segmented into epochs ranging from 200 ms before to 1500 ms after stimulus onset. For the baseline correction of pupil sizes, the values of each sampling point were divided by the mean value of the 200-ms prestimulus interval in each block. A great difference between emotional conditions appeared in the average of pupil size between 400 and 1500 ms after stimulus onset.
0.7 0.8 0.9 1 1.1
- 4 6 8 4
P
u
p
il
s
iz
e
(a.u
.)
Time (ms)
Unpleasant
Neutral
Fig. 1. Average responses of pupil size to emotional pictures.
(2) Feature Extraction: The following features were extracted from the raw data of pupil size and they were utilized for classifiers.
(b) Time-course raw data. The time-course raw data between 400 and 1500 ms were extracted, focusing on the great change of responses to visual stimuli. Five hundred and fifty data points were used as the feature of each trial.
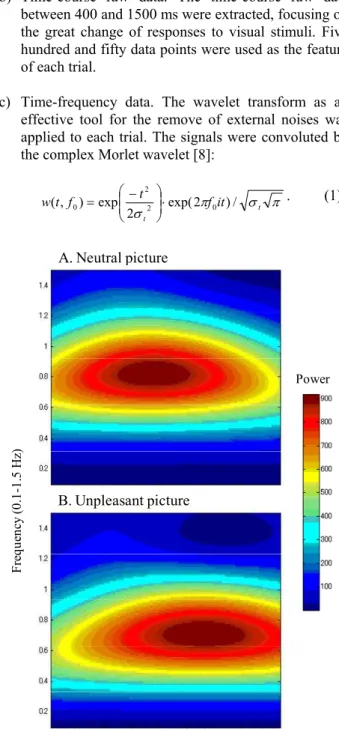
(c) Time-frequency data. The wavelet transform as an effective tool for the remove of external noises was applied to each trial. The signals were convoluted by the complex Morlet wavelet [8]:
t
t
it f t
f t
w exp(2 )/
2 exp ) ,
( 2 0
2
0
. (1)
A. Neutral picture
Power
F
re
que
nc
y
(
0.
1-1.
5
H
z)
B. Unpleasant picture
Time (-200 to 1500 ms from stimulus onset)
Fig. 2. Examples of the wavelet transform in pupil-size responses to emotional pictures within a subject.
The standard deviation (σt) of the time domain is inversely proportional to the standard deviation (σf) of the frequency domain [σf = (2πσt)-1]. The f0/σf determining the effective number of oscillation cycles comprised in the wavelet was set at 6 with f0 ranging from 0.1 to 1.5 Hz in increments of 0.01 Hz.
After a linear trend was subtracted, the continuous wavelet transform of a time series [u(t)] was calculated as the convolution of a complex wavelet with u(t):
u~(t,f0)w(t,f0)*u(t) (2)
The squared norm of the wavelet transform was calculated in a frequency band at around f0.
(3) The characteristics of the wavelet transform remarkably appeared at frequencies between 0.2 and 1.2 Hz in both conditions (Fig. 2). Hence, the time-frequency powers at those frequencies were determined as the SVM feature every single trial. The latency of the peak power in the unpleasant picture was usually later than that in the neutral picture.
(4) Classification. SVM as a supervised learning method was selected for the classification of features; it could construct a hyperplane that optimally separates samples from two classes with maximum margin (see Appendix for detail), compared to other learning methods [9],[10]. The nonlinear kernel based on the radial basis function was chosen in this analysis.
K(xi,xj)exp( xi xj 2), (3)
where is the kernel parameter to regulate the variance of the function.
4. Validation of Pupil-size Detection
The first three trials in each emotional category were removed for this validation owing to the possibility of initial unstable responses. The next 20 trials in each picture category were used as the training (the first 10 trials) and test (the last 10 trials) data for the ν-SVM analysis, adjusting the optimal parameter C (see Eq. (4) in Appendix) within a subject.
The nonlinear kernel parameter of Eq. (3) was tuned for accurate prediction of unknown samples: = 0.0001, 0.01, 1, and 1 / (the number of features). The maximum and minimum values of feature vectors of training dataset were recorded to normalize the data within the range between – 1 and 1; they were used for the test dataset. For unknown feature vectors of the test dataset, the trained SVM outputs the predicted class labels.
considering the individual differences in emotional responses. The value of the tolerance of termination criterion was set at e-12. The average of the accuracy in each condition was calculated among all subjects. The accuracy was defined by the following equation: (the number of correct classification in the two categories) × 100 / (the total number of trials in the two categories) [%]. The paired t-test was applied for the evaluation of the significant differences among the features in each trial. P values less than 0.05 were considered statistically significant.
Table 1: Validation of a classifier for pupil size change.
Kernel Features
Average rates of correct classification (%)
Number of trials
1 2 3 4 5 10
(a) Peak Amplitude
56.3 (41.7)
62.5 (23.1)
66.7 (12.6)
65.6 (8.8)
65.0 (12.0)
62.5 (7.1)
(b) Time-course
raw data
87.5 (23.1)*
75.0 (26.7)
72.9 (19.8)
70.3 (13.3)
71.3 (12.5)
65.0 (8.9)
(c) Wavelet transform
87.5 (23.1)*
75.0 (18.9)
68.8 (18.8)
65.6 (17.4)
65.0 (13.1)
61.3 (8.8)
All data are shown as mean ± (SD); *p < 0.05 vs. (a).
Table 2: Selected values in the nonlinear kernel parameter.
Subjects No.
Values in the kernel parameter
(a) Peak amplitude
(b) Time-course raw data
(c) Wavelet transform
1 1, default 1 1
2 0.0001 1 0.01
3 1 0.0001 1
4 0.01 0.0001 0.01
5 0.0001 0.0001 0.0001, default
6 0.0001 1 1
7 0.01 0.01 0.0001, 1, default
8 0.01 default 1
Default means 1 / (the number of features).
The statistical result of the accuracy for the SVM classifier with three kernel features is summarized in Table 1. The optimal value of the parameter indicating the highest accuracy at the final trial was selected within a subject. On the first trial, the accuracies in the features of raw data and the wavelet transform were significantly higher than that in the peak amplitude with latency. However, those values were gradually attenuated with the increase of trial numbers. Table 2 shows the optimal values selected as the nonlinear kernel parameter; their values were distributed among subjects.
5. Searching for Emotional Pictures
Searing for a picture dataset can be automatically started when one is looking at an unpleasant picture, which is detected by the pupil size change, in accordance with the above methods. The picture dataset (IAPS) including two emotional categories of 60 neutral and 60 unpleasant pictures [7] was set to assess this system.
5.1 Searching Method
The BoF based on the idea of the bag of words scheme for categorization of textural data was selected to search for similar emotional pictures. The BoF shows a flexible and adaptable framework owing to the independent techniques in each step. The following steps were performed to classify emotional images [11].
(1) Detection of image features: Speeded-up robust features (SURF) was utilized for the detection of the features in emotional pictures. SURF is a robust feature descriptor showing the distribution of the pixel intensities within a scale-dependent neighborhood of each interest point; the Haar wavelets to increase robustness and to decrease the computation time are adopted as simple filters.
(2) Codebook generation: Codebooks were made by assigning patch descriptors to a set of predetermined clusters with a vector quantization algorithm. Visual words were created by the k-means algorithm to cluster the feature vectors of SURF and to make a visual vocabulary. Here, the k-means clustering indicates the simplest square-error partitioning method. This algorithm proceeds by iterated assignments of points to their closest cluster centers and recomputation of the cluster centers [12].
(3) Construction of the bag of features: The BoF was constructed by counting the number of patches assigned to each cluster. Each picture was finally represented by a histogram of visual words. The generated histograms make it possible to compute the similarity among emotional images.
5.2 Triggered Filtering System
As a possible method for searching individually emotional pictures, similar pictures were explored from the database. The kd-tree method [13], which is a fast approximate nearest neighbor search algorithm, was applied for the selection of similar images and the similarity between images was calculated.
(1) Searching for similar pictures: Referencing the target picture detected by the pupil-size change, the top three similar images were searched from a picture database. The average of accuracy to correctly classify the unpleasant category was 89.4 % (161 of 180 images); that of a similarity between the target and searched images was 79.0 %.
without a filter
with a filter
Before the application of a filtering system.
A similar image still appears.
An individually unpleasant image is automatically filtered.
(unpleasant)
(unpleasant)
Detection of unpleasant
data; Search for
similar images
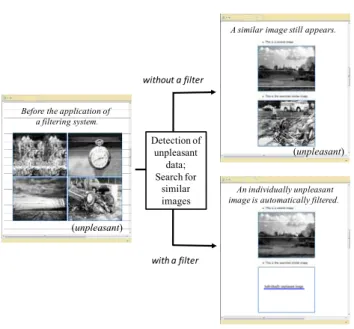
Fig. 3. An example of the applied filtering system for individually unpleasant information.
(2) Application to a database: Figure 3 shows an example of final output in the proposed system after the detection of a pupil-size change. The individually unpleasant pictures were automatically filtered immediately after the detection of an emotional change. The unpleasant image was firstly replaced with the link text; the hidden picture was able to be shown anytime by clicking it.
6. Discussion
The SVM classifier with the features of the raw data and the wavelet data resulted in the high accuracies for emotional judgment (Table 1). However, those accuracies
were gradually decreased with the increase of trial numbers, suggesting that the nearest training data are effective for single-trial analysis in actual situations such as BMI and BCI. Therefore, it is desirable to recalculate the optimal parameters for SVM, renewing the training data recursively. The auto-tuning method for the optimal parameters might be also required to correctly classify individual preferences.
The classifier’s accuracy in the peak response with latency showed the smallest of all features, which will be due to the shortage of significant features in time-course data. The meaningful changes in time-course data should be efficiently extracted for the selection of the classifier’s features. Whereas the raw data include all features of time-course changes, there are some problems such as background noise and calculation time. In the single-trial data of pupil size, the features acquired from the wavelet transform will be effective for noise reduction [8].
Specific methodology would be required to search for emotional images because most of them are constructed by the combination of some objects and/or situations. For example, we probably feel different emotions when looking at a cute puppy or a barking dog, regardless of the same animal category and the very similar image features. A possible method for the improvement is the analysis of the text-based information on emotional images; however, it is difficult to apply it to all images in websites and databases. Considering the increment of a classifier’s rate for generic object recognition, the algorithms for image processing to be able to judge and classify emotional situations will be needed in future studies.
7. Conclusions
An automatic system to identify individual emotion based on a pupil-size change was proposed. The SVM classifier applied to single-trial data of pupil size indicated the possibility of the correct judgment of the individually different unpleasant states when looking at emotional pictures. We also constructed the framework to automatically filter the individually unpleasant information from a picture database. The BoF scheme was able to efficiently search for similar ones detected from a pupil-size change. Further studies will be needed to apply the proposed system to tools for medical welfare and practical devices.
Appendix
two-class problem is to optimally determine a separating hyperplane with largest margin between the classes.
The non-linear SVM can map the feature vector xinto a high dimensional Euclidean space, using a nonlinear mapping function . The given data can be separated by a hyperplane with the mapping function to a sufficiently high dimension. The decision boundary of the two-class problems takes the form of an optimal separating hyperplane, w(x) + b = 0, obtained by solving the convex optimization problem:
N
i i b
w
C w
1 2
,
, 2
1
min
(4)subject to yi(w(xi)b)i 1 and i0 (i = 1,···, N),
where xi is the ith component and yi {-1, +1} is the class label. The parameter wis a weight vector, b is a bias, and isthe slack variable. A parameter C controls the size of w
and the sum of i. For a large C value, a penalty is largely assigned to errors. The two points closest to the hyperplane strongly affect its orientation, leading to a hyperplane coming close to several other data points. For a smaller C value, those points move inside the margin; the orientation of the hyperplane is changed, resulting in a larger margin. Instead of such a method, there is a formulation of SVM using a parameter 0 < ν ≤ 1. The parameter ν regulates the fractions of support vectors and margin errors (ν-SVM).
With the Lagrange multiplier i, the dual formation of (4) can be expressed as follows.
N
j i
j i j i j i N
i
i yyK x x
1 , 1
) , ( 2
1
max
(5)subject to 0
1
N
i i iy
and 0iC,(i = 1,···, N),where the
kernel function is K(xi, xj) = (xi) (xj).
The hyperplane (w(x) + b = 0)is expressed as
N
i
i i
iyK x x b
x f
1
) , ( )
( . (6)
This equation shows the decision function for all unknown samples x. If f(x) is larger than 0, then the predicted class is assigned to +1 (-1 otherwise).
Acknowledgment
This study was funded by a Grant-in-Aid for Young Scientists (B) from the Ministry of Education, Culture,
Sports, Science and Technology of Japan (KAKENHI, 22700466).
References
[1] M. A. Lebedev, and M. A. Nicolelis, “Brain-machine interfaces: past, present and future”, Trends Neurosci., Vol. 29, 2006, pp. 536-546.
[2] S. Ioannou, A. Raouzaiou, V. Tzouvaras, T. Mailis, K. Karpouzis, and S. Kollias, “Emotion recognition through facial expression analysis based on a neurofuzzy network”, Neural Networks, Vol. 18, 2005, pp. 423-435.
[3] M. M. Bradley, L. Miccoli, M. A. Escrig, and P. J. Lang, “The pupil as a measure of emotional arousal and autonomic activation”, Psychophysiology, Vol. 45, 2008, pp. 602-607. [4] M. Porta. “Vision-based user interfaces: methods and
applications”, International Journal of Human-Computer Studies, Vol. 57, 2002, pp. 27-73.
[5] F. Lotte, M. Congedo, A. Lécuyer, F. Lamarche, and B. Arnaldi, “A review of classification algorithms for EEG-based brain-computer interfaces”, Journal of Neural Engineering, Vol. 4, 2007, R1-R13.
[6] K. Kashihara, K. Okanoya, and N. Kawai, “Effects of emotional pictures on eye movements”, Technical Report of IEICE, HCS 2010-8, HIP 2010-8, 2010, pp.41-46.
[7] P. J. Lang, M. M. Bradley, and B. N. Cuthbert, “International Affective Picture System (IAPS): Affective ratings of pictures and instruction manual (Technical Report A-6)”, Gainesville: University of Florida, 2005.
[8] C. Tallon-Baudry, O. Bertrand, C. Delpuech, and J. Pernier, “Stimulus-specificity of phase-locked and non phase-locked 40-Hz visual responses in human”, Journal of Neuroscience, Vol. 16, 1996, pp. 4240-4249.
[9] C. Cortes, and V. N. Vapnik, “Support vector networks”, Machine Learning, Vol. 20, 1995, pp. 273–297.
[10] N. Cristianini, and J. Shawe-Taylor, “Introduction to support vector machines and other kernel-based learning methods”, Cambridge University Press, Cambridge, 2000. [11] G. Csurka, C. R. Dance, L. Fan, J. Williamowski, and C.
Bray, “Visual categorization with bags of keypoints”, Proceedings of the IEEE Workshop on Statistical Learning in Computer Vision (SLCV’04), 2004, pp. 1-16.
[12] R. O. Duda, P. E. Hart, and D. G. Stork, “Pattern classification”, second ed., John Wiley & Sons, Singapore, 2001.
[13] M. Muja, and D. G. Lowe, “Fast approximate nearest neighbors with automatic algorithm configuration”, in VISSAPP, 2009, pp. 331--340.
Koji Kashihara received the Ph.D degree in Engineering from Tokyo Institute of Technology, Japan, in 2001. He is an associate professor at the University of Tokushima.
Momoyo Ito is an assistant professor at the University of Tokushima, Japan (Ph.D in Engineering).