_____________________________
1 Químico, Dr. em Microbiologia Agropecuária, Prof. Dr., UNIFEB - Barretos/UNIFAFIBE - Bebedouro,
marcelobruno2010@live.com.
2 Engenheiro Agrônomo e tecnólogo em construção civil, Prof. Dr., Departamento de Engenharia Rural, UNESP - Jaboticabal, SP. TREATMENT WITH ACTIVATED SLUDGE IN WASTEWATER BATCH OF
WET-PROCESSED COFFEE
MARCELO BRUNO1, ROBERTO A. DE OLIVEIRA2
ABSTRACT: In this study it was evaluated the efficiency of the treatment of wet-processed coffee wastewater in upflow anaerobic sludge blanket (UASB) reactors in two stages, in bench scale, followed by post-treatment with activated sludge in batch. The first UASB reactor was submitted to an hydraulic retention time (HRT) of 6.2 d and organic loading rates (OLR) of 2.3 and 4.5g CODtotal (L d)-1, and the second UASB reactor to HRT of 3.1 d with OLR of 0.4 and 1.4g CODtotal (L d)-1. The average values of the affluent CODtotal increased from 13,891 to 27,926mg L-1 and the average efficiencies of removal of the CODtotal decreased from 95 to 91%, respectively, in the UASB reactors in two stages. The volumetric methane production increased from 0.274 to 0.323L CH4 (L reactor d)-1 with increment in the OLR. The average concentrations of total phenols
in the affluent were of 48 and 163mg L-1, and the removal efficiencies in the UASB reactors in two stages of 92 and 90%, respectively, and increased to 97% with post-treatment. The average values of the removal efficiencies of total nitrogen and phosphorus were of 57 to 80% and 44 to 60%, respectively, in the UASB reactors in two stages and increased to 91 and 84% with the post-treatment.
KEYWORDS: anaerobic digestion, methane, nitrogen, phosphorus, phenols.
DESEMPENHO DE REATORES UASB EM DOIS ESTÁGIOS SEGUIDOS DE PÓS-TRATAMENTO COM LODOS ATIVADOS EM BATELADA DE ÁGUAS RESIDUÁRIAS
DO BENEFICIAMENTO DE CAFÉ POR VIA ÚMIDA
RESUMO: Neste trabalho, avaliou-se a eficiência do tratamento de águas residuárias do beneficiamento de café por via úmida em reatores anaeróbios de fluxo ascendente com manta de lodo (UASB), em dois estágios, em escala de bancada, seguidos de pós-tratamento com lodos ativados em batelada. O primeiro reator UASB foi submetido a tempo de detenção hidráulica (TDH) de 6,2 d e a cargas orgânicas volumétricas (COV) de 2,3 e 4,5 g DQOtotal (L d)-1, e o segundo reator UASB a TDH de 3,1 d e a COV de 0,4 e 1,4 g DQOtotal (L d)-1. Os valores médios de DQOtotal do afluente aumentaram de 13.891 para 27.926 mg L-1, e as eficiências médias de remoção de DQOtotal diminuíram de 95 para 91%, respectivamente, nos reatores UASB, em dois estágios. A produção volumétrica de metano aumentou de 0,274 para 0,323 L CH4 (L reator d)
-1com o acréscimo na COV. As concentrações médias de fenóis totais no afluente foram de 48 e 163
mg L-1, e as eficiências médias de remoção nos reatores UASB em dois estágios, de 92 e 90%, respectivamente, e aumentaram para 97% com o pós-tratamento. As eficiências médias de remoção de nitrogênio e fósforo total variaram, respectivamente, de 57 a 80% e de 44 a 60% nos reatores UASB em dois estágios e aumentaram para 91 e 84% com a inclusão do pós-tratamento.
INTRODUCTION
Several agricultural and agro-industrial processes use water, sometimes as raw material, for other maintenance processes or less noble uses as washing products and equipment, and/or to transport waste.
One of the agro-industrial processes that have stood out in water consumption and generation of solid and liquid waste are the husking and pulping coffee beans, known as wet processing, which originate the pulped coffee, the coffee with the mucilage removed and the peeled cherry. The preparation of pulped and with the mucilage removed coffee consists of removing the peel and mucilage of the mature fruit, requiring an average of 4 liters of water for every liter of coffee washed and pulped (MELO, 2009). Toward the increasingly demanding market, the search for quality is currently a major concern in the various productive sectors and, in particular coffee agribusiness. Estimates for the 2012 crops are approximately 54 million bags of 60kg (CONAB, 2012).
In regions that produces pulped and with mucilage removed coffee, the fate of these effluents has become a major environmental problem, with demand for simplified systems of waste and effluents treatment, with low cost of implantation and operation (BRUNO & OLIVEIRA, 2008). Because of the large consumption of water and introduction of organic matter and nutrients, they eventually acquire a high polluting power and if not properly treated and discharged into water bodies can cause the death of aquatic organisms due to high consumption of oxygen, contamination by toxic organic compounds, such as phenols, eutrophication and because of the high concentration of nitrogen.
For the treatment of such wastewaters, the upflow anaerobic sludge blanket (UASB) can be efficient in removing higher organic loading, solids and toxic organic compounds, and in the production of methane for use in the coffee drying as was observed by SILVA & CAMPOS (2005), BRUNO & OLIVEIRA (2008), PRADO & CAMPOS (2008), PRADO et al. (2010), SELVAMURUGAN et al. (2010a and b). However, in the treated effluent, some control parameters still do not meet the thresholds set out in Resolutions 357 and 430 of the Brazilian National Environment Council - CONAMA (BRAZIL, 2005 and 2011) for the release into water bodies, requiring improved treatment system.
The two stage anaerobic process consists of two reactors in series, the first for the conversion of soluble compounds and mainly the partial hydrolysis and retention of particulate organic matter, and the second to complement the conversion of soluble compounds of the affluent and the ones formed in the first reactor. In addition, important contributions have been observed in the removal of N, P, metals and coliforms in two-stage or serial anaerobic (BRUNO & OLIVEIRA, 2008; SANTANA & OLIVEIRA, 2011; ABREU & OLIVEIRA NETO, 2009 DUDA & OLIVEIRA 2009). In general, in anaerobic reactors, effluents that fit completely in the patterns of Brazilian environmental legislation are not produced. Therefore, it is necessary to use a system of post-treatment to the polishing of these effluents, as was also observed by PRADO & CAMPOS (2008) and SELVAMURUGAN et al. (2010b). The use of post-treatment systems with activated sludge its becoming a viable alternative to improve the quality of effluents from anaerobic reactors (CHERNICHARO, 2007).
The activated sludge systems are widely used worldwide for the treatment of domestic and industrial wastewater, in situations of high quality effluent required and limited availability of area. However, the activated sludge systems include a mechanization index higher than other treatment systems, resulting in more sophisticated operation. Nevertheless, they can safely attend situations in which the quality of the effluent and its release into receiving bodies are priority (VON SPERLING, 1997).
affluent of 8,960 to 36,520mg L-1, varying the volumetric organic load (VOLs), and including a post-treatment system with activated sludge in batch for the polishing of anaerobic effluent aiming the removal of COD, suspended solids, phenols and nutrients (N, P).
MATERIAL AND METHODS
The study was conducted at the Department of Agricultural Engineering, of the University of Agriculture and Veterinary Sciences, of the São Paulo State University - UNESP, campus of Jaboticabal – state of São Paulo (SP), in Brazil, whose geographical coordinates are 21° 15' 22'' South Latitude; 48° 18' 58'' West Longitude and 575 meters of altitude. The climate of the region, according to Koppen's classification, is Awa (humid subtropical, dry in the winter and rainy in summer), with average annual rainfall of 1,300mm and average annual temperature of 21°C (SÃO PAULO STATE UNIVERSITY, 2010).
The experimental unit with the anaerobic treatment system in two stages consisted of two UASB reactors, in bench scale, installed in series, with volumes of 20L (R1) and 10L (R2), built and connected with PVC pipes with diameters of 150mm and 100mm, respectively. The separator of phases, non-conventional in Y shape, with an angle of 45° to the vertical, was constructed as described by VAN HAANDEL et al. (1999). It was also set a 5L tank for storage of the affluent of the UASB reactor (R1). To monitor the production of biogas was installed gasometers of the floating dome type, as illustrated in Figure 1 and described by BRUNO & OLIVEIRA (2008).
FIGURE 1. Schematic side view of the anaerobic treatment system in two stages with UASB reactors followed by post-treatment with activated sludge in batch.
The substrate used for the start and continued feeding of the reactors was the wastewater from the washing and pulping of the coffee beans from the Fortaleza Farm, located in the city of Altinópolis – state of São Paulo (SP), Brazil, which was collected at the end of 2009 harvest in August and stored frozen, with average pH values of 4.1; concentration of total suspended solids (TSS) of 2,544mg L-1 and CODtotal of 13,891mg L-1 (Table 1). This affluent was used during the first 90 days of operation. When it was over, it was replaced by an affluent of the same farm, collected at the beginning of the 2010 harvest, in June, and stored frozen, with average values of pH of 4.3; TSS of 5,687mg L-1 and CODtotal of 27,926mg L-1 (Table 1).
To perform this study, the affluent was defrosted and stored under refrigeration in sufficient quantity for weekly use throughout the study period.
The hydraulic retention time (HRT) on the R1 was 6.2 d and the average organic loading rate (OLR) applied in tests 1 and 2 were, respectively, of 2.26 and 4.53g CODtotal (L d)-1 (Table 1) and ranged from 1.46 to 5.93g CODtotal (Ld)-1.
TABLE 1. Operational conditions of UASB reactors in two stages (R1 e R2) and affluent characteristics in the tests 1 and 2.
Test Duration HRT TSS CODtotal OLR VHL (d) (d) (mg L-1) (mg L-1) (g CODtotal (L d)-1) (d-1)
R1 R2 R1 R1 R1 R1 R2
1 86 6.2 3.1 2544 13891 2.26 0.007 0.013 2 60 6.2 3.1 5687 27926 4.53 0.007 0.013
HRT – hydraulic retention time; OLR – organic loading rate; TSS – total suspended solids; COD –chemical oxygen demand; VHL – volumetric hydraulic loading
After defrosting at room temperature, the volume of affluent was sieved for daily use (nylon sieve with a square mesh of 1.5 x 1.5mm), in order to separate the coarse solids, such as pieces of peelings and coffee grounds pieces, preventing the clogging of the R1 feed line. After sieving, the affluent was neutralized with dolomitic limestone with PN (Power of Neutralization) and RPNT (Relative Power of Total Neutralization) of 99 and 83%, respectively, in order to obtain a pH around 7.0 using about 300g of limestone per liter of wastewater from pulping coffee. Next, the affluent was placed in the storage tank in the amount needed for the daily feeding of the treatment system with two-stage UASB reactors followed by post-treatment with activated sludge in batch.
The experiment was divided in two tests, varying the volumetric organic load (VOL) in the UASB reactors (R1 and R2) with the increase of the affluent CODtotal of R1, as shown in Table 1.
The post-treatment with activated sludge in batch used in experiment 2 was operated with a cycle of 24 h, feed volume of 3.5L in the cycle, feeding time of 24 h, aerobic reaction time of 12 h, anoxic + anaerobic reaction time and sedimentation of 11.84 h and the supernatant discharge time of 0.16 h. The average hydraulic retention time (HRT) in post-treatment was 106.3 h. It was kept 12 L of sludge after the discharge of the affluent. During the aerobic reaction stage, the aeration and agitation systems (with rotations of 30-35 rpm) were triggered. The R1 affluent was conducted to the R2 and from the R2 to the sludge activated by gravity through PVC pipe, connecting the reactors. Thus, the activated sludge received continuously the affluent of R2, characterizing the operation as fed batch, or disposal in batch and continuous feeding.
It was determined twice a week, on samples of the affluent, effluents of R1, R2 and post-treatment: pH, total alkalinity (TA), total suspended solids (TSS) and volatile (VSS), total chemical oxygen demand (CODtotal), dissolved COD (CODdiss.), Total Kjeldahl Nitrogen (TKN), ammonia
nitrogen (Namon.), nitrate (N-NO3-), nitrite (N-NO2-), total phosphorus (Ptotal) and dissolved oxygen
according to APHA, AWWA, WPCF (2005). The volume of produced biogas was daily determined by measuring the gasometers. The biogas composition was weekly analyzed by gas chromatography, according to APHA, AWWA, WPCF (2005). The concentration of total phenols (TF) was measured twice a week, according to the Folin-Ciocalteau method described by SHAHIDI and NACZK (1995).
RESULTS AND DISCUSSION
The average values of affluent CODtotal and CODdiss. were 13,891 and 27,926 and of 12,199
and 24,717mg L-1 in tests 1 and 2, respectively (Table 2), indicating the presence of wastewater with organic matter predominantly soluble. The changes in the composition of the affluent occurred due to variations in the collection time and may be related to changes in the amount of organic compounds present in coffee fruits and/or the amount of water used in washing or processed fruit mass, from start to the end of the season, as was also observed by BRUNO & OLIVEIRA (2008).
The temporal variations in the values of CODtotal in the affluent and in the effluents of UASB
reactors (R1 and R2), and of the post-treatment with activated sludge in batch are presented in Figure 2. It was observed that in test 1 the quality of the effluent for CODtotal was stabilized after 20
days of operation, indicating the quick start resulted from the inoculation in R1 and R2. After 86 days of operation, beginning of the test 2, there was evident increase in the amount of CODtotal of
affluent and as a result of the R1 and R2 effluents.
TABLE 2. Average values and coefficients of variation (CV in %) of total and dissolved COD, total and volatile suspended solids (TSS and VSS), total phenols (TP), total Kjeldahl nitrogen (TKN) and total phosphorus (total P) in mg L-1, in the affluents and effluents, and volumetric organic load (VOL) in the R1, in g CODtotal (L d)-1 of UASB reactors in two
stages (R1 and R2) and of post-treatment with activated sludge in batch (PT) in tests 1 and 2.
Test 1 Test 2
Parameters Affluent Effluent Affluent Effluent
R1 R2 R1 R2 PT
CODtotal 13891 1234 680 27926 4209 2432 1203
CODdiss. 12199 833 384 24717 3782 2135 813
TSS 2544 888 345 5687 2918 831 897
VSS 1471 426 298 3122 1417 761 439
TP 48 9 4 163 40 13 5
TKN 332 167 140 584 154 110 58
P-total 15 10 8 24 13 8 4
VOL - 2,26 0,40 - 4,53 1,37 0,71
CODtotal 18 144 181 12 41 53 28
CODdiss. 25 84 81 19 45 52 26
TSS 34 37 63 15 22 28 28
CV (%) VSS 38 47 82 28 33 32 34
TP 13 43 44 23 29 27 34
TKN 18 18 18 16 17 16 12
P-total 8 9 13 14 18 11 40
VOL - 18 143 - 11 70 45
The CODtotal of the R1 effluent increased until the 141 days of operation, indicating that the
increasing effluent CODtotal was attenuated after 128 days of operation, accommodating the more
pronounced changes occurred in R1. With the inclusion of post-treatment with activated sludge in batch, at 110 d, it was possible to obtain effluent with stable CODtotal, of 1,203mg L-1, with a
coefficient of variation (CV) of 28%, but with lower quality than R2 effluent in the test 1 (Figure 2), reflecting the increase of organic matter in the affluent.
0 5000 10000 15000 20000 25000 30000 35000 40000
10 17 24 31 38 46 52 59 66 73 80 86 93 100 107 114 121 128 132 136 141
Afluente R1 R2 PT
Período (dia s)
DQO
Tot
al
(m
g
L
-1)
FIGURE 2. Values of CODtotal of the affluent and of the effluents from UASB reactors in two
stages (R1 and R2) and of post-treatment with activated sludge in batch (PT) in tests 1 and 2.
The average values of the removal efficiencies of the CODtotal were 91 and 84%, and in the
anaerobic treatment system (R1+R2) were 95 and 91% during the tests 1 and 2, respectively (Table 3).
With the increase in the average values of VOL from 2.26 to 4.53 of CODtotal (L d)-1 in the
R1, the treatment system composed by the UASB reactors in two stages demonstrated capacity to absorb the abrupt change in the added organic load, mainly with the increase of the CODtotal
removal in the R2, observed in Figure 3.
The average value of the removal efficiency of the CODtotal decreased from 95 to 91% in the
UASB reactors in two stages (R1+R2), from test 1 to test2 (Table 3). However, the average values of removal efficiency of the CODtotal in conditions of HRT, VOL and CODtotal of the affluent used
in tests 1 and 2, can be considered high, because SILVA & CAMPOS (2005), treating wastewater from the wet-processed coffee, diluted, with CODtotal around 3,250 mg L-1, in UASB reactor, in
bench scale (11.7L), with HRT of 69 h and VOL of 0.59g COD (L d)-1, obtained removal efficiency of CODtotal of 78%. LUIZ (2007), operating a fixed bed reactor of ascendant flow, with
immobilized biomass with half support of polyurethane foam, volume of 139.5L, with affluent average value of CODtotal of 5,000mg L-1, HRT of 1.3 d and VOL of 4.41g CODtotal (L d)-1, obtained
removal efficiencies of CODtotal and CODfiltered of 80 and 83%, respectively. SELVAMURUGAN et
al., 2010a used a hybrid UASB reactor in bench scale (volume of 19.5L), with HRT of 24 to 6 h, VOL of 7.01 to 28.41g CODtotal (L d)-1 and COD of the affluent of 6.420 to 8.480mg L-1, and
obtained removal efficiencies of COD decreasing from 70 to 46% with increase of VOL. PRADO & CAMPOS (2008), with UASB reactor in bench scale (volume of 12.54L), with HRT of 69.67 to 8.04 h, VOL of 0.14 to 20.29g COD(L d)-1, and COD of the affluent of 235 to 7,064mg L-1, obtained removal efficiencies of COD of 33 to 93%. These authors added a post-treatment of the anaerobic effluent with optional aerated pond of 13L, with HRT similar to the UASB reactor, and the removal efficiencies of COD increased from 47 to 98%.
Ensaio 1 Ensaio 2
C
O
Dto
ta
l
(
m
g
L
-1 )
Period (days) Affluent
TABLE 3. Average values and coefficients of variation (CV %) of removal efficiencies (%) of total and dissolved COD, total and volatile suspended solids (TSS and VSS), total phenols (TP), total Kjeldahl nitrogen (TKN) and total phosphorus (total P) during the operation of UASB reactors (R1 and R1+R2) followed by post-treatment with activated sludge in batch (PT) and in the treatment system (R1+R2+PT) in tests 1 and 2.
Test 1 Test 2
Parameters
R1 R1+R2 R1 R1+R2 PT R1+R2+PT
CODtotal 91 95 84 91 57 95
CODdiss. 92 96 84 91 67 96
TSS 63 86 48 85 - 84
VSS 68 77 57 79 38 87
TP 81 92 75 90 63 97
TKN 49 57 73 80 45 91
Ptotal 33 47 46 66 50 84
CODtotal 15 10 9 7 14 2
CODdiss. 10 4 11 6 12 1
TSS 18 8 20 8 240 5
CV VSS 24 27 21 7 46 5
TP 12 4 6 8 20 1
TKN 22 15 10 8 20 11
Ptotal 18 21 14 14 30 6
With the post-treatment with activated sludge in batch from the 110 days of operation, remained the high removal efficiencies of total and dissolved COD obtained throughout the test 1, thus demonstrating the importance of post-treatment with activated sludge in batch, with which it was obtained 57% of CODtotal removal efficiency. Thus, efficiency of 91% in the UASB reactor in
two stages (R1+R2) increased to 95% in the treatment system (R1+R2+PT) for stability in the quality of the effluent and the total and dissolved COD removal, observed through the accentuated decrease in the coefficient of variation (CV Tables 2 and 3)
The removal efficiencies of the CODdiss. were similar to the CODtotal in R1, in the anaerobic
treatment system in two stages (R1+R2) and with the post-treatment with activated sludge in batch (R1+R2+PT) in tests 1 and 2 (Table 3). For TSS and VSS, with the increase of VOL in test 2, the removal efficiencies decreased in R1, but did not harm the performance of the R1+R2 set, maintaining average values of 85 and 79%, respectively (Table 3).
0 10 20 30 40 50 60 70 80 90 100
10 17 24 31 38 46 52 59 66 73 80 86 93 100 107 114 121 128 132 136 141
R1 R2 R1+R2 PT R1+R2+PT
Período (dias) Ef ic iê nc ia (% )
FIGURE 3. Values of removal efficiency of total COD in the UASB reactors (R1 and R2), in the UASB reactors in two stages (R1+R2), in the post-treatment with activated sludge in batch (PT) and in the treatment system (R1+R2+PT) in tests 1 and 2.
E
fi
ci
ên
ci
a (
%
)
Ensaio 1 Ensaio 2
Period (days)
Test 1 Test 2
The average concentrations of total phenols in the affluent were 48 and 163mg L-1 (Table 2), values well above the allowed for effluent discharge, which is 0.5mg L-1, according to Resolution 430 of CONAMA (BRAZIL, 2011).
With the UASB reactors in two stages (R1+R2), the higher average removal efficiency of phenols was 92% (Table 3), resulting average concentration in the effluent of 4mg L-1 (Table 2), and occurred in the test 1 with VOL of 2.26 and 0.40g CODtotal (L d)-1 in R1 and R2, respectively.
In test 2, with the start of operation of the post-treatment with activated sludge in batch and increased VOL in R1 to 4.53g COD (L d)-1, and elevation of the average concentration of total phenols to 163mg L-1, the removal in the R1+R2 set remained high, averaging 90%. The additional removal of 67% in the activated sludge in batch system raised the average removal efficiency in the treatment system (R1+R2+PT) to 97% and the average concentration in the final effluent was 5mg L-1, demonstrating the capacity to absorb the increased load of potentially toxic phenolic compounds.
Other researchers have also reported high removals of phenols in anaerobic high rate reactors. HUSSAIN et al. (2008), operating a 10L UASB reactor with HRT of 6 h and VOL from 3.9 to 4.1g COD (L d)-1, treated synthetic wastewater with average concentration of phenol of 420mg L-1, supplemented with N and P, and obtained phenols average removal efficiency of 90%.
PRADO & CAMPOS (2008) used wastewater from wet-processed coffee with total concentration of phenol from 29.8 to 387.5mg L-1, in the UASB reactor with VOL of 0.14 to 20.29g COD (L d)-1 and achieved removal efficiencies of phenolic compounds from -3 to 70%. It was included an optional aerated pond for post-treatment and the removal of phenols was 5-78%. FIA et al. (2010) treated wastewater from pulping coffee, with average COD of 4,545mg L-1 in three anaerobic fixed bed reactors (139.5L) with average HRT of 1.3 and VOL of 0.81g CODtotal (L d)-1
and obtained a removal efficiency of phenolic compounds of 68% in the reactor filled with blast furnace slag, 52% in the reactor filled with polyurethane foam and 36% in the reactor filled with crushed stone number 4. The results of these studies confirmed that the concentrations of phenols contained in wastewater from wet-processed coffee were not toxic to anaerobic microbiota and can be reduced in UASB reactors in two stages under the conditions studied. However, with higher VOL, such as those applied by PRADO & CAMPOS (2008), the removal of phenols may decrease. With the inclusion of post-treatment with aerobic stage this problem could be mitigated. However, to reach the threshold standard for effluent discharge (BRAZIL, 2011), the post-treatment needs to be further improved.
The average concentrations of total Kjeldahl nitrogen (TKN) and total phosphorus (total P) in the affluent were 332 and 584mg L-1, and 15 and 24mg L-1, respectively (Table 2). The average removal efficiencies of TKN and total P in UASB reactors in two stages (R1+R2) increased from 57 and 47% in test 1 to 80 and 66% in test 2, even with the increase of VOL, due to the increase of the mass of suspended solids retained in R2, which contain N and P of the affluent.
With the operation of the post-treatment with activated sludge in batch in the test 2, the removal efficiencies of NTK and total P in the system increased to 91 and 84%, respectively, with the reduction in the post-treatment of 45% of the TKN and 51% of the total P of the effluent R2 (Table 3). The reductions in concentrations may be attributed to nitrification, denitrification and biological P removal promoted by the implementation of the operating cycle with aerobic, anoxic and anaerobic stages. The average concentrations of ammonia-N decreased from 72mg L-1 in the R2 effluent to 48mg L-1 in the after treatment effluent. The concentration of N-NO3- and N-NO2- were 6
and 0.5 mg L-1, respectively, in the post-treatment effluent, indicating the occurrence of denitrification.
TKN to 60% and of total P to 81%, confirming that the use of aerobic post-treatment can dramatically reduce the concentrations of N and P in the final effluent.
The higher removal efficiencies of COD, suspended solids, TKN and total P in this study, using as affluent wastewater from wet-processed coffee without dilution, were influenced by the use of UASB reactors in two stages, by the higher HRT applied and by the post-treatment with activated sludge in batch, comparing the tests performed and the results obtained in the studies cited.
The average pH values of the effluents of the reactors R1 and R2, of 7.5 and 7.8, and of 7.2 and 7.4, were satisfactory for stable maintenance of the anaerobic process, in tests 1 and 2, respectively, and also by pH of 7.6 favorable to post-treatment with activated sludge in batch in test 2 (Table 4).
TABLE 4. Average values and coefficients of variation (CV in %) of pH, total volatile acids (TVA in mg CH3COOH L-1) and total alkalinity (TA in mg CaCO3 L-1) during the operation of
UASB reactors in two stages (R1 and R2) followed by post-treatment with activated sludge in batch (PT) in tests 1 and 2.
Test 1 Test 2
Parameters Affluent Effluent Affluent Effluent
R1 R2 R1 R2 PT
pH 6.9 7.5 7.8 7.1 7.2 7.4 7.6
TVA 960 103 124 1050 1688 969 534
TA 730 2310 2682 1088 2351 2424 1878
pH 7 2 2 5 5 7 2
CV TVA 14 45 110 12 31 42 14
TA 15 11 11 9 7 24 13
The average concentrations of total volatile acids (TVA) in the effluents of R1 and R2 in test 1 were 103 and 124mg CH3COOH L-1 (Table 4), demonstrating the stability of the anaerobic
treatment system in two stages. However, in test 2, from 90 days of operation, with the sudden change of the characteristics of the affluent, the average values of TVA in the reactors R1 and R2 and in post-treatment with activated sludge in batch increased to 1688, 969 and 534mg CH3COOH L-1, respectively (Table 4 and Figure 4).
0 500 1000 1500 2000 2500
10 17 24 31 38 46 52 59 66 73 80 86 93 100 107 114 121 128 132 136 141
Afluente R1 R2 PT
Período (dias)
AVT
(m
g
CH
3
C
OOH
L
-1)
FIGURE 4. Concentrations of total volatile acids (TVA) in the affluent and effluents of UASB reactors in two stages (R1 and R2) and in the post-treatment with activated sludge in batch (PT) in tests 1 and 2.
Ensaio 1 Ensaio 2
Period (days)
Test 2 Test 1
Affluent
T
VA
(
m
g
C
H3
C
OOH
L
Although the high concentrations of TVA in UASB reactors, the average value of pH was stable, which may be attributed to the high values of total alkalinity (TA 2,310 to 2,682mg CaCO3
L-1), practically without jeopardizing the performance of the two-stage anaerobic treatment system for removal of COD, suspended solids and nutrients (Tables 3 and 4). METCALF & EDDY (2003) reported that are required concentrations of alkalinity of 2,000-4,000mg CaCO3 L-1 to keep the pH
around 7 in the anaerobic reactors.
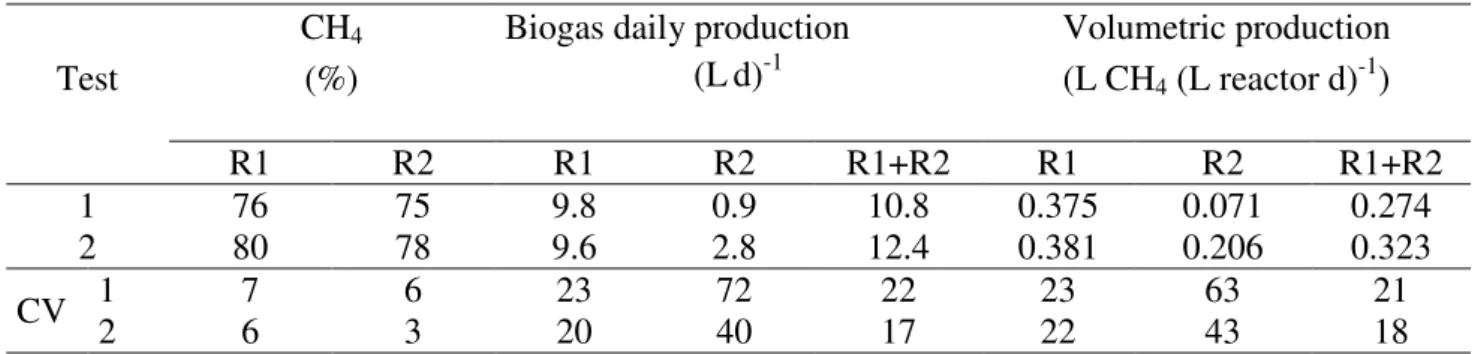
The percentage of methane in the biogas, in reactors R1 and R2 were 76 and 80% and of 75 and 78%, respectively, in tests 1 and 2. The volumetric methane production in UASB reactors in two stages (R1+R2) increased from test 1 to test 2, from 0.274 to 0.323L CH4 (L reactor d)-1,
respectively, with the raise in the VOL from 2.26 to 4.53kg COD (m3 d)-1 (Table 5). The increased concentration of TVA in the reactors R1 and R2 and the lowest air temperatures that occurred during the test 2 damaged the conversion of CODdiss. to biogas because the VOL doubled and the
same did not occur with the production of methane.
In the study of PRADO & CAMPOS (2008), the concentrations of methane in the biogas were lower, 48-68%, and the volumetric biogas production larger and crescent, up to 1.55L (L d)-1, with HRT decreased from 69.7 to 8.0 h and the resulting increase in VOL of 0.14 to 20.29g COD (L d)-1. These differences may be attributed to lower concentrations of COD of the affluent and to the largest VOL applied by the authors.
TABLE 5. Average values and coefficient of variation (CV in %) of methane percentage in the biogas, biogas daily production and methane volumetric production during the operation of UASB reactors in two stages (R1 and R2) in tests 1 and 2.
Test
CH4 Biogas daily production Volumetric production
(%) (Ld)-1 (L CH4 (L reactor d)-1)
R1 R2 R1 R2 R1+R2 R1 R2 R1+R2
1 76 75 9.8 0.9 10.8 0.375 0.071 0.274 2 80 78 9.6 2.8 12.4 0.381 0.206 0.323 CV 1 2 7 6 6 3 20 23 72 40 22 17 22 23 43 63 21 18
SELVAMURUGAN et al. (2010a), with HRT of 18 and 12 h and VOL of 9.55 and 14.23g COD (L d)-1, observed the maximum biogas production of 2.62 and 2.91L d-1 (0.14 and 0.15L (L reactor d-1)) with methane concentrations of 61 and 59%, respectively, which were lower than those obtained in tests 1 and 2, with VOL of 2.23 and 4,56g COD (L d)-1. However, BRUNO & OLIVEIRA (2008) obtained higher values of methane concentration (89 and 88%) and volumetric production (0.45 and 0.483L CH4 (L reactor d)-1), with VOL of 3.0 and 3.6g COD (L d)-1 and
concentrations of TVA of 47 and 85mg CH3COOH L-1, respectively, confirming that the increase in
VOL in test 2 accompanied by increases in the concentration of TVA above 1,500mg CH3COOH
L-1 in R1 and temperature decrease prevent the production of greater quantities of methane. Thus, to increase the VOL with proportional increases of methane production using wastewater from wet-processed coffee without dilution is necessary to maintain the low concentration of TVA. PRADO & CAMPOS (2008) maintained low acidity in the effluent of the UASB reactor, 23-160mg CaCO3
L-1.
CONCLUSIONS
The increase of the volumetric organic loading (VOL) reduced the removal efficiencies of COD, suspended solids and phenols, and increased the concentration of total volatile acids in UASB reactor (R1) effluent, decreasing the conversion of CODdiss. to methane. In the system of two-stage
with increasing removal efficiency and production of methane in the UASB reactor of the second stage (R2), demonstrating the capacity to maintain the performance of the set when there are elevations of VOL.
The implementation of the post-treatment with activated sludge in batch improved the removals, especially N and P, confirming the importance for polishing the effluent of UASB reactors and maintaining high efficiencies.
Thus, the two-stage UASB reactors are suitable for the treatment of wastewater from wet-processed coffee with high removal efficiencies of organic matter and nutrients, and methane production. The activated sludge operated in fed batch is an alternative for polishing the anaerobic effluent.
REFERENCES
ABREU NETO, M. S., OLIVEIRA, R. A. de. Remoção de matéria orgânica de nutrientes e de coliformes no processo anaeróbio em dois estágios (reator compartimentado seguido de reator UASB) para o tratamento deáguas residuárias de suinocultura. Engenharia Agrícola, Jaboticabal,
v.29, n. 1, p. 148-161, 2009.
APHA, AWWA, WPCF. Standard methods for the examination of water and wastewater. 20th ed.
Washington: American Public Health Association , 2005. 1.268 p.
BRASIL. Resolução no 357, de 17 de março de 2005. Dispõe sobre a classificação dos corpos de águas e diretrizes ambientais para o seu enquadramento, bem como estabelece as condições e padrões de lançamento de efluentes, e dá outras providências. Brasília: Conselho Nacional de Meio Ambiente -CONAMA, 2005. 23 p.
BRASIL. Resolução no 430, de 13 de maio 2011. Dispõe sobre as condições e padrões de lançamento de efluentes, complementa e altera a Resolução no 357, de 17-3-2005. Brasília: Conselho Nacional de Meio Ambiente - CONAMA, 2011. 8 p.
BRUNO, M.; OLIVEIRA, R. A. de. Tratamentoanaeróbio de águas residuárias do beneficiamento de café por via úmida em reatores UASB. Engenharia Agrícola, Jaboticabal, v.28, n. 2, p. 364-377,
2008.
CHERNICHARO, C. A. L. de. Princípios do tratamento biológico de águas residuárias: reatores
anaeróbios. Belo Horizonte: Departamento de Engenharia Sanitária e Ambiental, Universidade Federal de Minas Gerais, 2007. v.5, 379 p.
CONAB. Companhia Nacional de Abastecimento. Cafés do Brasil, safra 2010, segundo levantamento. Disponível em < http://www.conab.gov.br/OlalaCMS/uploads/arquivos/
12_05_10_08_56_04_boletim_cafe_-_maio_2012.pdf >. Acesso em: 30 ago. 2012.
DUDA, R. M.; OLIVEIRA, R. A. de. Reatores anaeróbios operados em batelada sequencial seguidos de lagoas de polimento para o tratamento de águas residuárias de suinocultura. Parte II: remoção de nutrientes e coliformes. Engenharia Agrícola, Jaboticabal, v.29, n.1, p.135-147, 2009.
FIA F. R. L.; MATOS, A. T. de.; BORGES, A. C.; MOREIRA, D. A.; FIA, R.; EUSTÁQUIO JUNIOR, V. Remoção de compostos fenólicos em reatores anaeróbios de leito fixo com diferentes materiais suporte. Revista Brasileira de Engenharia Agrícola e Ambiental, Campina Grande, v.14,
n.10, p.1079-1086, 2010.
HUSSAIN, A.; KUMAR, P.; MEHROTRA, I. Treatment of phenolic wastewater in UASB reactor: effect of nitrogen and phosphorus. Bioresource Technology, Lausanne, v. 99, p. 8497 – 8503, 2008.
LUIZ, F. A. R. Desempenho de reatores anaeróbios de leito fixo no tratamento de águas residuárias da lavagem e descascamento/despolpa dos frutos do cafeeiro. Viçosa, 2007. 132f.
MELO, A.C.P. Utilização de água residuária do processo de pós-colheita do café na produção de mudas de cafeeiro. Dissertação. 2009. 48f. (Mestrado em Agronomia) – Faculdade de Ciências
Agronômicas, Universidade Estadual Paulista, Botucatu, 2009.
METCALF & EDDY. Wastewater engineering: treatment and reuse. 4th ed. New York: McGraw-
Hill, 2003. 1.819 p.
PRADO, M. A. C.; CAMPOS, C. M. M. Produção de biogás no tratamento dos efluentes líquidos do processamento de Coffea arábica L. em reator anaeróbico para o potencial aproveitamento na
secagem do café. Ciência e Agrotecnologia, Lavras, v. 32, n. 3, p. 938–947, 2008.
PRADO, M. A. C.; CAMPOS, C. M. M.; SILVA, J. F. da. Estudo da variação da concentração de metano no biogás produzido a partir das águas residuárias do café. Ciência e Agrotecnologia,
Lavras, v.34, n.2, p. 475-484, 2010.
OLIVEIRA, R. A.; SANTANA, A. M. Tratamento de águas residuárias de suinocultura em reatores anaeróbios de fluxo ascendente com manta de lodo (UASB) em dois estágios seguidos de reator operado em batelada seqüencial (RBS). Engenharia Agrícola, Jaboticabal, v. 31, n. 1, p. 178-192,
2011.
SELVAMURUGAN, M.; DORAISAMY, P.; MAHESWARI, M., NANDAKUMAR, N.B. High rate anaerobic treatment of coffee processing wastewater using upflow anaerobic hybrid reactor.
Iranian Journal Environmental Health Science and Engineering, v.7, p.129-136, 2010a.
SELVAMURUGAN, M.; DORAISAMY, P.; MAHESWARI, M. An integrated treatment system for coffee processing wastewater using anaerobic and aerobic process. Ecological Engineering,
v.36, p.1686-1690, 2010b.
SHAHIDI, F., NACZK, M. Food Phenolics: sources, chemistry, effects and aplications. Basel:
Technomic Publishing, 1995. 331 p.
SILVA, B.A., CAMPOS, C.M.M. Tratamento anaeróbio de efluentes líquidos gerados no
beneficiamento úmido do café. In. CONGRESSO BRASILEIRO DE ENGENHARIA AGRÍCOLA, 34., 2005, Canoas. Anais... Jaboticabal: Associação Brasileira de Engenharia Agrícola, 2005. 1
CD-ROM.
UNIVERSIDADE ESTADUAL PAULISTA – Faculdade de Ciências Agrárias e Veterinárias. Departamento de Ciências Exatas. Estação Agroclimatológica: valores médios de período de 1971 a 2010. Disponível em www.fcav.unesp.br/estação Acesso em: junho 2010.
VAN HAANDEL, A.C.; CAVALCANTI, P.F.F.; MEDEIROS, E.J.S.; SILVA, J.K.M. Excess sludge discharge frequency for UASB reactors. Water Science and Technology, Oxford, v.40, n.8,
p.211-219, 1999.
VON SPERLING, M. Princípios do tratamento biológico de águas residuárias: Lodos ativados.