_________________________
1
Bióloga, Mestre pelo Programa de Pós-Graduação em Microbiologia Agropecuária da Faculdade de Ciências Agrárias e Veterinárias, UNESP, Universidade Estadual Paulista, Câmpus de Jaboticabal, Profa. MSc. do Departamento de Ciências Biológicas,UNORP, São José do Rio Preto - SP, [email protected].
2
Engo Agrônomo e Tecnólogo em Construção Civil; Mestre em Agronomia – Prod. Vegetal pela UNESP, Câmpus de Jaboticabal; Doutor em Eng. Civil - Hidráulica e Saneamento pela EESC-USP; Prof. Assist. Dr., Faculdade de Ciências Agrárias e Veterinárias, UNESP, Câmpus de Jaboticabal - SP, Brasil, Departamento de Engenharia Rural, Fone (0XX16)32097281, [email protected]. Recebido pelo Conselho Editorial em: 10-10-2011
IN TWO STAGES TREATING SWINE WASTEWATER
ROSEANE DEL´ARCO RAMIRES1, ROBERTO ALVES DE OLIVEIRA2
SUMMARY: The performance of two upflow anaerobic sludge blanket (UASB) reactors was
evaluated in pilot scale (908 and 188 L), installed in series (R1 and R2), fed with swine wastewater with TSS around 5 and 13 g L-1. The UASB reactors were submitted to HDT of 36 and 18 h with VOL of 5.5 to 34.4 g COD (L d)-1 in the R1 and HDT of 7.5 e 3.7 h with VOL from 5.1 to 45.2 g COD (L d)-1 in the R2. The average removal efficiencies of COD ranged from 55 to 85% in the R1 and from 43 to 57% in the R2, resulting in values from 82 to 93% in the UASB reactors in two stage. Methane concentrations in the biogas were 69 to 74% with specific production from 0.05 to 0.27 L CH4 (g removedCOD)-1 in the R1 and of 0.10 to 0.12 L CH4 (g removedCOD)-1 in the R2. The
average removal efficiencies were 61 to 75% for totalP, 39 to 69% for KN, 82 to 93% for orgN and
20 to 94% for Fe, Zn, Cu and Mn. The amN concentration were not reduced indicating the need to
post-treatment for effluent disposal into water bodies. There were reductions of total coliforms from 99.8123 to 99.9989% and of thermotolerant coliforms from 99.9725 to 99.9999%. The conditions imposed to the UASB reactors in two stage provided high conversions of removedCOD into methane
(up to 77%) and reductions of organic an inorganic pollution loads from swine wastewater.
KEYWORDS: volumetric organic load, methane, N and P removal, metal removal, suspended
solids.
REMOÇÕES DE DQO, SÓLIDOS, NUTRIENTES E COLIFORMES EM REATORES UASB EM DOIS ESTÁGIOS TRATANDO ÁGUAS RESIDUÁRIAS DE SUINOCULTURA
RESUMO: Foi avaliado o desempenho de dois reatores anaeróbios de fluxo ascendente com manta
de lodo (UASB) em escala-piloto (908 e 188 L), instalados em série (R1 e R2), para o tratamento de águas residuárias de suinocultura com concentrações médias de SST em torno de 5 e 13 g L-1.Os
TDH foram de 36 e 18 h com COV de 5,5 a 34,4 g DQO (Ld)-1 no R1 e TDH de 7,5 e 3,7 h com
COV de 5,1 a 45,2 g DQO (Ld)-1 no R2. As eficiências médias de remoção de DQO variaram de 55
a 85% no R1 e de 43 a 57% no R2, resultando valores de 82 a 93% nos reatores UASB em dois
estágios.As concentrações de metano no biogás foram de 69 a 74%, com produções de 0,05 a 0,27 LCH4 (g DQOremovida)-1 no R1 e de 0,10 a 0,12 LCH4 (g DQOremovida)-1 no R2.Os valores médios de
eficiência de remoção de Ptotal foram de 61 a 75%; de NK de 39 a 69%; de Norg. de 82 a 93%, e de
Fe, Zn, Cu e Mn de 20 a 94%. As concentrações de N-am. não foram reduzidas, indicando a
necessidade de pós-tratamento para disposição do efluente em corpos d’água. Houve redução de coliformes totais de 99,8123 a 99,9989%, e de coliformes termotolerantes de 99,9725 a 99,9999%. As condições impostas aos reatores UASB em dois estágios propiciaram reduções acentuadas da carga poluidora orgânica e inorgânica das águas residuárias de suinocultura, com conversão de até 77% da DQO removida em metano.
PALAVRAS-CHAVE: carga orgânica volumétrica, metano, remoção de N e P, remoção de metais,
INTRODUCTION
In the context of environmental pollution control, swine production is considered by inspection agencies as an activity of high pollution potential. The rearing of pigs in confinement generates large volumes of waste with high concentrations of suspended solids, COD, nutrients and pathogens (OLIVEIRA & FORESTI, 2004; RODRIGUES et al., 2010; SONG et al., 2010; AGGARANGSI & TEERASOUNTORNKUL, 2011).
To solve, or at least minimize the environmental impact and health risks caused by the large amount of waste from swine production, it has been highlighted the process of anaerobic digestion as an alternative treatment with low cost of implementation and operation (OLIVEIRA &
FORESTI, 2004; HWANG et al., 2010; LI et al., 2010), with the advantages of biogas production
and low sludge production (SANTANA & OLIVEIRA, 2005 e 2009; HWANG et al., 2010) of nutrient conservation in the effluent and stabilized sludge (AHN et al., 2006; OLIVEIRA & SANTANA, 2011) and odor control (MASSÉ & DROSTE, 1997).
The uplow anaerobic sludge blanket (UASB) reactor represented a great advance of anaerobic technology for secondary treatment of wastewater, often eliminating the primary step. It enables smaller hydraulic detention time and larger cell retention, for natural formation of self-immobilized microbial granules, making them competitive systems compared to other possibilities for wastewater treatment and compatible with the efficiency of some aerobic reactors (MANARIOTIS & GRIGOROPOULOS, 2008).
However, high concentrations of suspended solids in the affluent of high rate anaerobic reactors in single-stage, may limit the removal of the organic fraction, as in the treatment of complex wastewater. Thus, the use of two-stage anaerobic process, which consists of two reactors in series, with UASB, compartmentalized or anaerobic filter can improve the performance of the system as has been observed in the treatment of swine wastewater (PEREIRA, 2003; SANTANA & OLIVEIRA, 2005 e 2009; FERNANDES & OLIVEIRA, 2006; BICHUETTE et al., 2008; DUDA & OLIVEIRA, 2011; OLIVEIRA & SANTANA, 2011). However, among several studies using UASB reactors for treatment of swine wastewater (PEREIRA, 2003; SANTANA & OLIVEIRA, 2005; HUANG et al., 2005; LI et al., 2010; SONG et al., 2010, among others), the concentrations of total suspended solids (SST) of the affluent was of 0.5 to 5.0 g L -1 and the volumetric organic load (VOL) below 10 g COD (Lreactor d)-1. As the swine wastewater may contain TSS above the
recommended values and the UASB reactors can accommodate higher VOL, it is necessary to extend the knowledge for this alternative treatment.
Given the above, this research evaluated the performance of two-stage UASB reactors for treatment of swine wastewater with TSS concentrations around 5 and 13 g L-1, with hydraulic retention time of 36 h and 18 h in the first reactor and 7.5 h and 3.7 h in the second reactor, thus applying high VOL (above 10 g COD (Lreactor d) -1) in the anaerobic treatment system.
MATERIALS AND METHODS
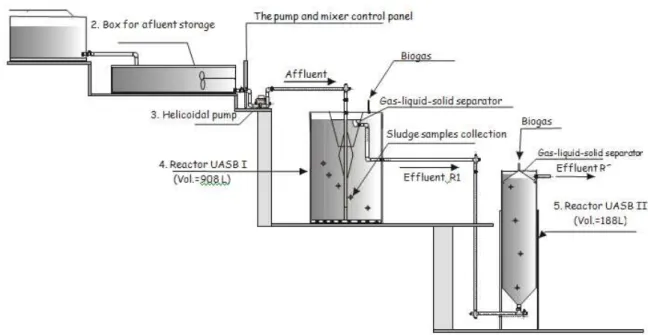
The experimental unit consisted of two pilot-scale UASB reactors installed in series with volumes of 908 L (first stage - R1) and 188 L (second stage - R2). Containers were mounted for the preparation (sieving and dilution) of the swine wastewater, for storage and mixing of the affluent, and with helicoidal pump for feeding the UASB reactors, as illustrated in Figure 1. To monitor the production of biogas were installed hydraulic seals and fiberglass gasometers, as described by SANTANA & OLIVEIRA (2005).
supplement. The raw swine wastewater was collected daily and stored in boxes of 1000 L for the preparation of the affluent.
FIGURE 1. Scheme representing anaerobic treatment system in two stages with UASB reactors in pilot scale testing: (1) container to preparation and dilution of swine wastewater. (2) affluent storage reservoirs, (3) helicoidal pump, (4) UASB reactor with 908 L - R1 and (5) UASB reactor with 188 L - R2. Source: SANTANA & OLIVEIRA (2005).
The experiment was divided into four assays as described in Table 1.
For the startup of the UASB reactors, it was used as inoculum sludge from UASB reactors treating swine wastewater with SST concentrations of 8,232 mg L-1 and COD of 19,622 mg L-1. The amount of sludge placed at the beginning of the assay 1 was sufficient to fill 40 to 50% of the volume of each reactor. At the beginning of each new assay was held the same volume of sludge in the reactors, performing discharge of the excess sludge. This was done to standardize the starting conditions for each assay, with respect to the volume of sludge contained in the reactor. The sludge blanket was drawn through the ball valve installed in the median region of the height of the reactors. Thus was maintained 40-50% of the volume of reactor occupied by the sludge before the beginning of the next assay. Therewith, the negative effects of early drag of accumulated sludge from the previous test were prevented.
TABLE 1. Operational conditions of the first (R1) and second (R2) UASB reactors of the two stage anaerobic treatment system in assays 1 to 4.
Assay
Duration HDT(a)
(h)
TSS(b)
affluent
COD (c)
affluent VOL
(d)
(g COD (Lreactor d)-1)
VHL (e)
(d) (mg L
-1
) L (L d)-1
R1 R2 R1 R1 R1 R1 R2
1 47 36 7.5 4940 8390 5.5 0.7 3.2
2 48 18 3.7 5175 10914 14.4 1.3 6.4
3 47 36 7.5 12788 19917 13.2 0.7 3.2
4 44 18 3.7 12860 26025 34.4 1.3 6.4
(a) - hydraulic detention time, (b) - the concentration of total suspended solids (c) - chemical oxygen demand, (d) - volumetric organic load (e) - volumetric hydraulic load.
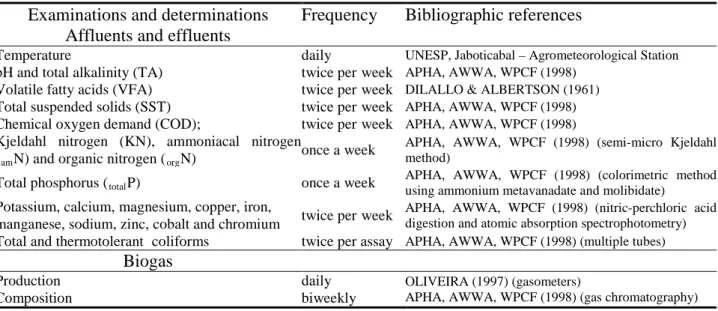
The examination and determination of the organic and inorganic constituents were performed as described in Table 2.
TABLE 2. Affluents and effluents examinations and determinations, frequency and employed methodologies.
Examinations and determinations Frequency Bibliographic references
Affluents and effluents
Temperature daily UNESP, Jaboticabal – Agrometeorological Station
pH and total alkalinity (TA) twice perweek APHA, AWWA, WPCF (1998)
Volatile fatty acids (VFA) twice perweek DILALLO & ALBERTSON (1961)
Total suspended solids (SST) twice perweek APHA, AWWA, WPCF (1998)
Chemical oxygen demand (COD); twice perweek APHA, AWWA, WPCF (1998)
Kjeldahl nitrogen (KN), ammoniacal nitrogen
(amN) and organic nitrogen (orgN)
once a week APHA, AWWA, WPCF (1998) (semi-micro Kjeldahl
method)
Total phosphorus (totalP) once a week
APHA, AWWA, WPCF (1998) (colorimetric method using ammonium metavanadate and molibidate)
Potassium, calcium, magnesium, copper, iron,
manganese, sodium, zinc, cobalt and chromium twice perweek
APHA, AWWA, WPCF (1998) (nitric-perchloric acid digestion and atomic absorption spectrophotometry)
Total and thermotolerant coliforms twice per assay APHA, AWWA, WPCF (1998) (multiple tubes)
Biogas
Production Composition
daily biweekly
OLIVEIRA (1997) (gasometers)
APHA, AWWA, WPCF (1998) (gas chromatography)
The affluent and effluent samples were collected at sampling taps in feeding (out of the helicoidal pump) and at the output R1 and R2. For exames and determinations in the affluent and effluent were obtained composite samples from sub-samples of 200 mL collected every 1 hour, between 7h30min to 13h30min. The determination of the volume and composition of the biogas are also listed in Table 2.
RESULTS AND DISCUSSION
The average air temperatures ranged from 23.8 to 24.9°C in the assays 1 to 4 (Table 3), so the UASB reactors were operated at mesophilic range of 20 to 45°C. KHANAL (2008) cited that this temperature range is suitable for the application and operation of anaerobic processes in wastewater treatment.
The pH values in the effluent of R1 and R2 (Table 3) increased relative to the affluent and remained in the optimal range for the growth of methanogenic archaea, which is from pH 6.6 to 7.4; although the stable production of methane occurs at pH 6.0 to 8.0 (KHANAL,2008).
The average concentrations of total volatile acids (TVA) in the effluent of R1 and R2 were 187 to 409 mg L-1 and 111 to 242 mg L-1, respectively (Table 3). TVA values from 50 to 500 mg L
-1
are recommended by GERARDI (2003) for stability in anaerobic process, which was observed in both reactors.
The concentration of volatile acids should be in balance with the alkalinity in the system, as occurred in R1 and R2, so the pH will remain with values that do not take the treatment process into collapse (PEREIRA et al. 2009). According to RIBAS et al. (2007), the instability of the anaerobic process occurs when the speed of the acid production is higher than its consumption, decreasing the pH and inhibition of methanogenic archaea, which are sensitive to changes in environmental conditions. In R1 and R2, volatile acids were consumed and converted to methane (Table 4).
The average values of COD in the affluent of R1 from anaerobic treatment system in two stages ranged from 8,390 to 26,025 mg L-1. For the TSS the average values remained near to the expected around 5,000 and 13,000 mg L-1 (Table 3). The average values of VSS in the affluent
corresponded to 70 to 84% of TSS. This demonstrates the predominantly organic composition of
the suspended solids from swine wastewater and the possibility of biological conversion under anaerobic conditions; which was corroborated by the sharp reduction in the values of CODand TSS in the effluent of R1 and R2 (Table 3), and increasing methane production (Table 4).
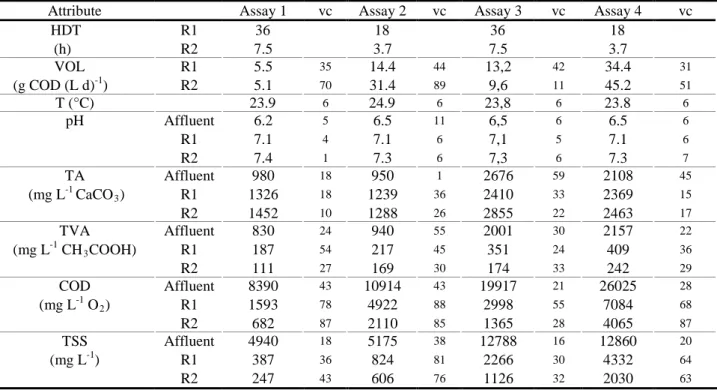
TABLE 3. Mean values and variation coefficients (vc in %) of average air temperature (T), pH, total alkalinity (TA), total volatile acids (TVA), chemical oxygen demand (COD), total suspended solids (TSS) in affluents and effluents, and hydraulic detention time (HDT) and volumetric organic load (VOL) in the UASB reactors (R1 and R2) in two stages during assays 1 to 4.
Attribute Assay 1 vc Assay 2 vc Assay 3 vc Assay 4 vc
HDT R1 36 18 36 18
(h) R2 7.5 3.7 7.5 3.7
VOL R1 5.5 35 14.4 44 13,2 42 34.4 31
(g COD (L d)-1) R2 5.1 70 31.4 89 9,6 11 45.2 51
T (°C) 23.9 6 24.9 6 23,8 6 23.8 6
pH Affluent 6.2 5 6.5 11 6,5 6 6.5 6
R1 7.1 4 7.1 6 7,1 5 7.1 6
R2 7.4 1 7.3 6 7,3 6 7.3 7
TA Affluent 980 18 950 1 2676 59 2108 45
(mg L-1 CaCO3) R1 1326 18 1239 36 2410 33 2369 15
R2 1452 10 1288 26 2855 22 2463 17
TVA Affluent 830 24 940 55 2001 30 2157 22
(mg L-1 CH3COOH) R1 187 54 217 45 351 24 409 36
R2 111 27 169 30 174 33 242 29
COD Affluent 8390 43 10914 43 19917 21 26025 28
(mg L-1 O2) R1 1593 78 4922 88 2998 55 7084 68
R2 682 87 2110 85 1365 28 4065 87
TSS Affluent 4940 18 5175 38 12788 16 12860 20
(mg L-1) R1 387 36 824 81 2266 30 4332 64
R2 247 43 606 76 1126 32 2030 63
In the effluents of R1 and R2 there were increases in average values of COD and SST of assay 1 to assay 2 and assay 3 to assay 4, because of the decrease in HDT; and of assay 1 to assay 3 and assay 2 to assay 4, due to increase of TSS concentration in the affluents. These results showed the direct influence of HDT and TSS concentration of the affluent in the quality of the UASB reactors' effluent treating swine wastewater, as was also observed by PEREIRA (2003), SANTANA & OLIVEIRA (2005) and DUDA & OLIVEIRA (2009).
(assays 1 and 2, and assays 3 and 4), the decrease in HDT from 36 to 18 h with consequent increase in VOL reduced the removal of COD and TSS (Table 4).
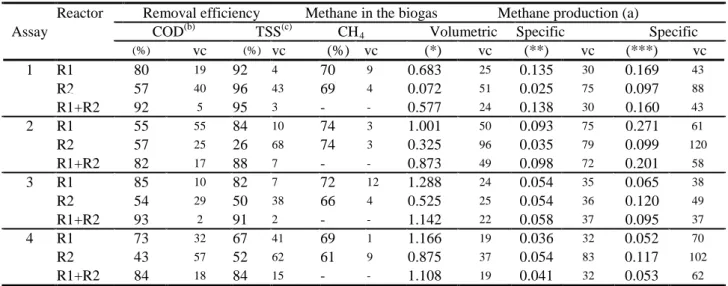
TABLE 4. Mean values and variation coefficients (vc in %) of the removal efficiencies of CODand TSS, of methane percentage in biogas and methane volumetric and methane specifics productions in UASB reactors (R1 and R2) and in reactors set (R1+R2) during the operation of the anaerobic treatment system in two stage in assays 1 to 4.
Reactor Removal efficiency Methane in the biogas Methane production (a)
Assay COD(b) TSS(c) CH4 Volumetric Specific Specific
(%) vc (%) vc (%) vc (*) vc (**) vc (***) vc
1 R1 80 19 92 4 70 9 0.683 25 0.135 30 0.169 43
R2 57 40 96 43 69 4 0.072 51 0.025 75 0.097 88
R1+R2 92 5 95 3 - - 0.577 24 0.138 30 0.160 43
2 R1 55 55 84 10 74 3 1.001 50 0.093 75 0.271 61
R2 57 25 26 68 74 3 0.325 96 0.035 79 0.099 120
R1+R2 82 17 88 7 - - 0.873 49 0.098 72 0.201 58
3 R1 85 10 82 7 72 12 1.288 24 0.054 35 0.065 38
R2 54 29 50 38 66 4 0.525 25 0.054 36 0.120 49
R1+R2 93 2 91 2 - - 1.142 22 0.058 37 0.095 37
4 R1 73 32 67 41 69 1 1.166 19 0.036 32 0.052 70
R2 43 57 52 62 61 9 0.875 37 0.054 83 0.117 102
R1+R2 84 18 84 15 - - 1.108 19 0.041 32 0.053 62
(a) converted to standard temperature and pressure (STP), (b) chemical oxygen demand, (c) total suspended solids (*) L CH4 (L
reactor d) -1, (**) L CH
4 (g addedCOD) -1 and (***) L CH4 (g removedCOD) -1.
Several researchers treated swine wastewater in UASB reactors, in one stage, with different operating conditions. LI et al. (2010) used affluent with COD from 3,000 to 6,000 mg L-1 in a UASB reactor of 18 L with HDT of 3 d, VOL of 1.0 to 2.0 g COD (L d) -1, temperature of 30 to 35oC and obtained removal efficiencies of COD of 90 to 95%. SONG et al. (2010) in a UASB reactor of 35,000 L operated with HDT from 7.0 to 3.5 d, VOL from 1.3 to 5.8 g COD (L d) -1 and affluent with COD from 7,300 to 30,900 mg L-1, obtained removal efficiencies of COD from 74 to 79%. RODRIGUES et al. (2010) used UASB reactor of 11,500 L for the treatment of pre-decanted swine wastewater and obtained removal efficiencies of COD of 93%, TSS of 88%; VSS of 85%, with volumetric organic load (VOL) from 1.1 to 17.5 g COD (L d)-1 and HDT from 40.8 to 98.4 h. Similar values for the removal of COD and SST were obtained in assays 1 and 3 with lower HDT of 36 h, similar VOL of 5.5 and 13.2 g COD (Lreactor d) -1, respectively.
These results demonstrate that even with variations in the characteristics of the affluent and operational conditions of the UASB reactor, it is possible to obtain high removals of COD and TSS with HDT until 18 h and VOL until 34.4g COD (Lreactor d) -1, as occurred in assay 4.
In the assays 2 and 3, when VOL were similar in the R1 (Table 3), the COD removal efficiency was higher with the increase in HDT for 36 h (Table 4), even with higher values of COD and TSS in the affluents. This indicates that VOL up to 14 g of COD (L d)-1 and TSS concentrations of affluent from 5,000 to 13,000 mg L-1, HDT is the limiting parameter for COD removal.
In anaerobic treatment system in two stage (R1 + R2), the average values of removal efficiency of COD and TSS were high and remained constant during the tests (vc of 3 to 18%). For COD, the average values in assays 1, 2, 3 and 4 were 92, 82, 93 and 84%, respectively (Table 4). The reductions in removal efficiencies ofCOD and TSS of the assay 1 to assay 2 and of the assay 3 to assay 4 were due to the decrease in HDT.
The results obtained by PEREIRA (2003) and SANTANA & OLIVEIRA (2005) were similar to these experiment, with average removal efficiencies of COD and TSS above 82% in the anaerobic treatment system in two stage. PEREIRA (2003)operated UASB reactors in two stage, in bench scale (volumes of 39.0 and 10.5 L), fed with swine wastewater with TSS around 5,000 mg L
-1
and HDT of 62 to 16 h in the first reactor and 16 to 4 h in the second reactor, and achieved removal efficiencies of COD from 79 to 95% and TSS from 73 to 94% in the anaerobic treatment system in two stage. Evaluating the performance of UASB reactors in two stage on a pilot scale with volumes of 705 and 175L, operated with HDT of 48 h and 24 h and VOL from 4.37 to 19.04 g COD (L reactor d) -1 in the first reactor, and HDT of 12 and 6 h and VOL from 2.32 to 20.58 g COD (L reactor d) -1 in the second reactor, with average concentrations of TSS in the affluent from
2,216 to 7,131 mg L-1, SANTANA & OLIVEIRA (2005) obtained COD and TSS removal
efficiencies from 87 to 93% and 87 to 88%, respectively.
DENG et al. (2008) evaluated the UASB reactor followed by sequencing batch reactor (SBR) in the treatment of swine wastewater with COD of 6,561 mg L-1 and applied VOL from 1.5 to 4.0 g BOD5 (L d-1) in UASB reactor. The average values of COD removal efficiency were 87 to 94% in
the combined anaerobic and aerobic system operated with HDT from 3.5 to 4.6 d and temperatures
from 20 to 25°C. Therefore, the mean values of COD removal efficiency were similar to those
obtained in assay 1, of 92%, which was lower HDT, of 43.5 h in R1 + R2. This indicates that, for these operating conditions, it is possible to remove COD with similar efficiencies in UASB reactors in two stage with lower volume and still no energy costs and equipment for aeration.
The VOL applied in UASB reactors was not limiting to achieve high removal efficiencies of COD and TSS in the anaerobic treatment system in two stages (R1 + R2). The lowest COD and TSS removal efficiencies, of 82 and 84%, were observed with the lower HDT, 21.7 h, in assays 2 and 4, when occurred the higher VOL in R1 and R2 (Table 3).
The percentage of CH4 was high in biogas and was maintained in the range of 69 to 74% in
the R1 and of 61 to 69% in R2 (Table 4), despite of high values of VOL applied. The decrease in HDT and increases in VOL resulted in increased of methane production. The volumetric production in R1, of 0.683 to 1.288 L CH4 (Lreactor d) -1, were higher than in R2, 0.072 to 0.875 L CH4 (Lreactor
d) -1 in the four assays (Table 4). This difference decreased with decreasing of HDT and increasing of VOL, in assays 2 and 4, and when the TSS concentration in the affluent increased in assays 3 and 4. In assay 1, the average value of the volumetric methane production in R2 was 11% in relation to R1, and in assays 2, 3 and 4 increased to 33, 41 and 75%, respectively. This was because the remaining COD in the effluent of R1 increased from assay 1 to 4 and, consequently, larger amount of organic matter was converted to methane in R2.
With lower VOL, from 1.0 to 2.0 g COD (L d) -1, Li et al. (2010) had methane concentration from 60 to 65% and lower volumetric productions, from 0.53 to 0.73 L CH4 (Lreactor d ) -1.
SANTANA & OLIVEIRA (2005) applied higher VOL, from 3.4 to 14.4 g COD (L d)-1, and found methane concentrations from 77 to 81% and higher volumetric productions, from 0.59 to 1.13 L CH4 (Lreactor d) -1. These results confirm that with increasing of VOL occurring increases in
methane production.
increase in the volumetric methane production was less than with the increase in TSS concentration of the affluent, considering that have been applied similar VOL in assays 2 and 3.
In assay 4, when the HDT was 18 h and the TSS concentration of the affluent was similar to the assay 3, the VOL applied was 6.3 times higher than in assay 1 and the volumetric methane production increased only 1.7 times. By comparing with the assays 2 and 3, there was an increase of 16% and reduction of 10%, respectively.
Thus, it is evident that increases in volumetric methane production were not proportional to increases in VOL. In this study, this can be attributed to the sharp decline in HDT which reduced the COD removals in the R1, in the assays 2 and 4 (Table 3). Another condition that resulted in lower volumetric methane production was the increase of TSS concentration of the affluent in assays 3 and 4 (Tables 3 and 4).
Taking as a basis the average values of specific methane production (Table 4), it was found that the increase of TSS concentrations of the affluents in the assays 3 and 4 caused a significant reduction in the conversion of COD removed to methane in R1 and consequently in the set R1 + R2. The maximum value of 0.271 L CH4 (g removedCOD)-1, occurred in assay 2 and the minimum of
0.052 L CH4 (g removedCOD)-1 in assay 4. For similar VOL, in assays 2 and 3, the increase of TSS
concentration in the affluent reduced, respectively, from 57% to 27% the conversion of COD removed to methane. In assay 4, the simultaneous effect of reducing the HDT and the highest TSS concentration of the affluent and VOL led to lower conversion of COD removed to methane, only 15%.
SONG et al. (2010) had higher values of specific production of methane, from 0.28 to 0,33 L CH4 (g removedCOD) -1, by virtue of having used higher HDT (7.0 to 3.5 d) and lower VOL (1.3 to
5.8 g COD (L d) -1).
The increase in TSS concentrations of the affluents in assays 3 and 4 was achieved by the opening of the mesh of the sieve from 2 mm to 4 mm, which also resulted in an increase in the maximum particle size in the affluent. Thus, there was greater physical removal of particulate COD by sedimentation and interception in the sludge blanket, in assays 3 and 4, and lower conversion of
removedCOD into methane, due to limitations of hydrolysis of the VSS.
SANTANA & OLIVEIRA (2005), using swine wastewater with TSS concentrations from
2,216 to 7,131 mg L-1, with maximum particle size of 2 mm, obtained specific production of
methane from 0.156 to 0.289 L CH4 (g removedCOD)-1 in UASB reactors in two stage (R1 + R2) and
from 0.170 to 0.335 L CH4 (g removedCOD) -1 in the UASB reactor (R1), which were similar to those
in assays 1 and 2 and larger than those of assays 3 and 4 (Table 4). DUDA & OLIVEIRA (2011) in UASB reactor fed with swine wastewater with TSS concentrations from 6,950 to 9,730 mg L-1, with maximum particle size of 3 mm, applied VOL of 12.4 to 23.2 g COD (L d) - 1 and HDT of 24 and 12 h; and specific methane productions were 0.080 and 0.062 L CH4 (g removedCOD)-1 similar to
assays 3 and 4. Both results confirmed the negative effect of increasing in TSS concentration of the affluent, VOL and particle size in the conversion of COD removed to methane.
The mean values of totalP concentration in the affluent of assays 1, 2, 3 and 4 ranged from
161.8 to 337.1 mg L-1 and in the effluent of R1 and R2 from 90.7 to 178.3 and from 49.1 to 133.2 mg L-1, respectively (Table 5). This reduction of the concentrations varied with the flow time of wastewater through the treatment system, achieving at the output of R2 removals from 61 to 75%. RODRIGUES et al. (2009) used decanter, UASB reactor and polishing pond in series, and obtained
totalP removal of 62%, confirming the good results obtained with the UASB reactors in two stage.
The decrease in removal efficiency of totalP in the anaerobic treatment system in two stage
occurred with the use of lower HDT, which was also observed by DUDA & OLIVEIRA (2011) and OLIVEIRA & SANTANA (2011). Similar to the results obtained in this study, PEREIRA (2003) also obtained minors removal efficiencies of totalP, of 60, 62 and 48%, by reduction the HDT to 78,
The results of totalP removal in the anaerobic system of two stage showed better performance
when compared to the system in the single stage. In R1 with HDT of 36 h, in assays 1 and 3, the removal efficiencies were 44 and 64% and in set R1 + R2 with HDT of 21.7 h in assays 2 and 4 the values were 61%. Therefore, with lower TSS concentrations of the affluent as in assay 2, the advantage of the two stage UASB reactors is greater, because in addition to using less volume of reactors is possible to obtain higher removals. DUDA & OLIVEIRA (2011) achieved removals of 42 and 64% with HDT of 24 h in the UASB reactor, and 49 and 66% with HDT of 17.8 h in the UASB reactor and anaerobic filter in series.
The removals of totalP were attributed by OLIVEIRA et al. (1997), DENG et al. (2008) and
OLIVEIRA & SANTANA (2011) to sedimentation of solids and precipitation with aluminum, calcium, iron or magnesium, besides the formation of phosphine under anaerobic conditions. These processes may facilitate higher removal of totalP when the solids retention time (SRT) is higher as
observed by DUDA & OLIVEIRA (2011).
The highest concentrations of KN, amN and orgN in the affluent were observed in assays 2 and
3 (Table 5). The mean concentrations of KN, amN and orgN in the effluent increased with decreasing
of HDT (Table 5). Similar behavior was observed by PEREIRA (2003). In both studies, in which the same average TSS concentration (5,000 mg L-1) was used, the higher values achieved for removal efficiency of KN and orgN occurred with higher HDT and less VOL.
The average removals of KN and orgN in the anaerobic treatment system in two stage were 39
to 69% and 82 to 92%, respectively (Table 5). OLIVEIRA & SANTANA (2011) obtained similar removal efficiencies of KN 47 to 63% and orgN 70 to 84%, with HDT of 39 h.
As observed by PEREIRA (2003) and OLIVEIRA & SANTANA (2011) and also in this study, the concentrations of amN in the effluent did not increase proportionally to the reduction of
orgN. It is suggested that the majority of orgN removed has been trapped in the biomass of sludge
blanket reactors.
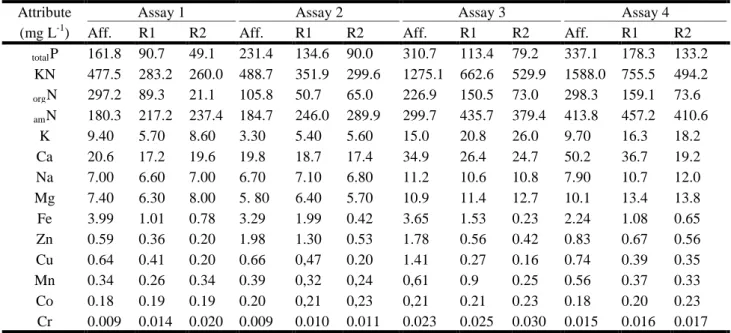
TABLE 5. Mean values of the concentrations of totalP, KN, orgN, amN, K, Ca, Na, Mg, Fe, Zn, Cu,
Mn, Co, and Cr in the affluents and effluents from UASB reactors (R1 and R2) during the operation of the anaerobic treatment in two stage in the assays 1 to 4.
Attribute Assay 1 Assay 2 Assay 3 Assay 4
(mg L-1) Aff. R1 R2 Aff. R1 R2 Aff. R1 R2 Aff. R1 R2
totalP 161.8 90.7 49.1 231.4 134.6 90.0 310.7 113.4 79.2 337.1 178.3 133.2
KN 477.5 283.2 260.0 488.7 351.9 299.6 1275.1 662.6 529.9 1588.0 755.5 494.2
orgN 297.2 89.3 21.1 105.8 50.7 65.0 226.9 150.5 73.0 298.3 159.1 73.6
amN 180.3 217.2 237.4 184.7 246.0 289.9 299.7 435.7 379.4 413.8 457.2 410.6
K 9.40 5.70 8.60 3.30 5.40 5.60 15.0 20.8 26.0 9.70 16.3 18.2
Ca 20.6 17.2 19.6 19.8 18.7 17.4 34.9 26.4 24.7 50.2 36.7 19.2
Na 7.00 6.60 7.00 6.70 7.10 6.80 11.2 10.6 10.8 7.90 10.7 12.0
Mg 7.40 6.30 8.00 5. 80 6.40 5.70 10.9 11.4 12.7 10.1 13.4 13.8
Fe 3.99 1.01 0.78 3.29 1.99 0.42 3.65 1.53 0.23 2.24 1.08 0.65
Zn 0.59 0.36 0.20 1.98 1.30 0.53 1.78 0.56 0.42 0.83 0.67 0.56
Cu 0.64 0.41 0.20 0.66 0,47 0.20 1.41 0.27 0.16 0.74 0.39 0.35
Mn 0.34 0.26 0.34 0.39 0,32 0,24 0,61 0.9 0.25 0.56 0.37 0.33
Co 0.18 0.19 0.19 0.20 0,21 0,23 0,21 0.21 0.23 0.18 0.20 0.23
Cr 0.009 0.014 0.020 0.009 0.010 0.011 0.023 0.025 0.030 0.015 0.016 0.017
OLIVEIRA et al. (2007), DENG et al. (2008) and OLIVEIRA & SANTANA (2011) also attributed part of removal of KN to the formation of struvite (Mg NH4 PO4 6H2O) from the
The results obtained by PEREIRA (2003), average removals of KN from 17 to 22% and of
orgN from 76 to 88%. It is noted that the efficiencies in this study (Figure 3) were higher due to
applied higher HDT and TSS concentrations of the affluent, increasing organic solids retention with subsequent stabilization in the sludge blanket.
HUANG et al. (2005) treated swine wastewater pre-decanted with COD of 2,000 mg L-1, TSS from 250 to 400 mg L-1 and KN of 400 mg L-1 in UASB reactor and activated sludge with retention time of granules from 20 to 50 days and solid retention time of 10 to 25 days, respectively. The removal efficiencies were 95 to 97% for COD, 100% for KN, 54 and 55% for totalN. The authors
found that the best removals occurred with longer retention time of granules and solids, and with consequent stabilization of the sludge blanket. RODRIGUES et al. (2009), treating swine wastewater pre-decanted in UASB reactors and lagoon, obtained removal efficiencies in the system of 97.4% for BOD, 65% for KN; 11.1% for amN, 62% totalP, whereas in the UASB reactor there
were not removals of KN and amN.
In this experiment there was no removal of amN, a fact confirmed by PEREIRA (2003)
operating UASB reactors in two stage with HDT of 62, 31 and 16 h.
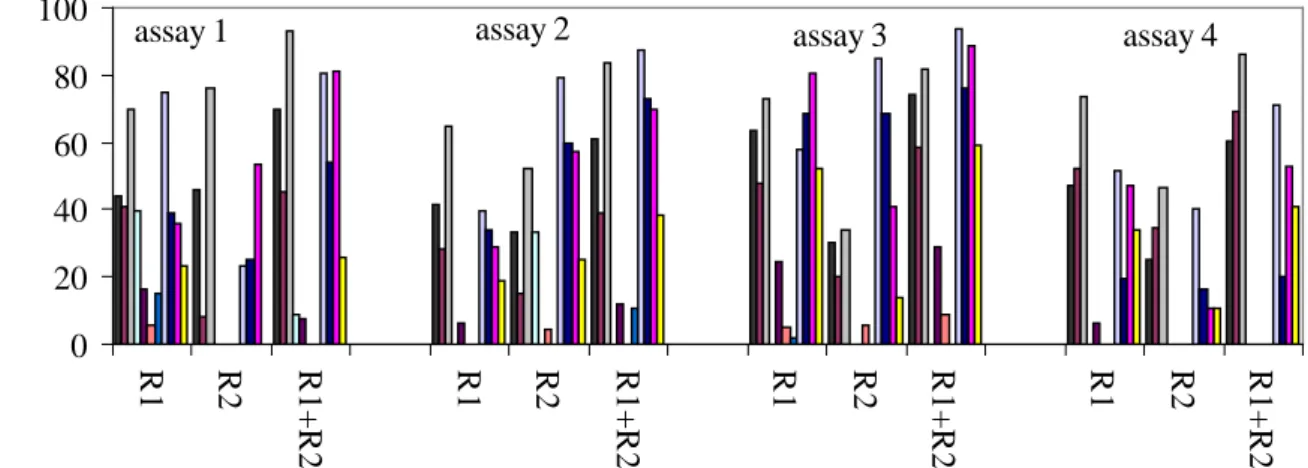
The average concentrations of K, Ca, Mg, Na, Fe, Zn, Cu, Mn, Co and Cr in the affluent are showed in Table 5. Among the macronutrients K, Ca, Mg and Na, only Ca was slightly removed in reactors R1 and R2 and in the treatment system (R1 + R2) during the four assays (Figure 3) due to the greater solubility of K, Mg and Na and lower susceptibility to the formation of the precipitate. Removal efficiencies of Fe, Zn, Cu, and Mn in the treatment system varied from 71 to 94%, 20 to 77%, 53 to 89% and 26 to 59%, respectively.
0 20 40 60 80 100 R
1 R2 R1
+
R
2
R
1 R2 R1
+
R
2
R
1 R2 R1
+
R
2
R
1 R2 R1
+ R 2 R em o v a l e ff ic ie n cy ( % )
P-total NTK N-org. K Ca Na Mg Fe Zn Cu Mn
assay 1 assay 2 assay 3 assay 4
FIGURE 4. Means values of removal efficiency of nutrients in UASB reactors (R1 and R2) and anaerobic treatment system in two stage (R1+R2) in assays 1 to 4.
In anaerobic treatment system in two stage (R1+ R2), the highest removal efficiencies of Fe, Zn, Cu and Mn occured in assay 3 with mean values of 94, 77, 89 and 59%, respectively. DUDA & OLIVEIRA (2009) also observed high removals of Fe (85%), Zn (72%), Cu (58%) and Mn (66%) in the UASB reactor followed by anaerobic filter treating swine wastewater with HDT of 36 and 17.6 h, respectively. No removal of Co and Cr was observed in four assays of this study.
The concentrations of total and thermotolerant coliforms in the affluent ranged from 6,64x10⁸ NMP (100 mL)-1 to 1,15x10¹⁰ NMP (100 mL)-1 and 5,54x10⁸ NMP (100 mL)-1 to4,89x109 NMP (100 mL)-1, respectively. In the treatment system in two stage, with UASB reactors, there were reductions in the concentrations of total coliforms from 99.8123 to 99.9998% and of thermotolerant coliforms from 99.7299 to 99.9999% (Table 6).
TABLE 6. Geometric means of most probable number (MPN) of total and thermotolerant coliforms in affluents and effluents, and removal efficiencies in UASB reactors (R1 and R2) and anaerobic treatment system in two stage (R1+R2) in assays 1 to 4.
Assays Sampling site Totalcoliforms Removal efficiency thermotolerant
Coliforms Removal efficiency
(NMP/100mL) (%) (NMP/100mL) (%)
Affluent 6.6 4 x 10⁸ - 5.47X 10⁸ -
R1 4.30 x 10⁶ 99.3524 9.10X 10⁵ 99.8338
1 R2 4.06 x 10⁵ 90.5581 1.50X 10⁵ 83.5164
R1 + R2 99.9385 99.9725
Affluent 1.15x 10¹⁰ - 4.89X 10⁹ -
R1 1.78X 10⁷ 99.8452 6.48X 10⁶ 99.8674
2 R2 2.06X 10⁵ 98.4260 4.74X 10⁴ 99.2585
R1 + R2 99.9998 99.9999
Affluent 1.18x 10⁹ - 8.03X 10⁸ -
R1 6.32X 10⁶ 99.4648 4.30X 10⁶ 99.4645
3 R2 7.42X 10⁵ 88.2593 7.42X 10⁵ 82.7441
R1 + R2 99.9371 99.9075
Affluent 7.31x 10⁸ - 5.08X 10⁸ -
R1 1.01X 10⁸ 86.1833 2.05X 10⁷ 95.9645
4 R2 1.37X 10⁶ 98.6415 1.37X 10⁶ 93.3073
R1 + R2 99.8123 99.7299
The highest removal efficiencies were obtained in assays 1 and 2, which has the highest temperatures. CÔTÉ et al. (2006) observed efficiency from 97.94 to 100% in reduction total
coliforms and Escherichia coli in anaerobic digestion system at temperatures of 20°C.
RODRIGUES et al. (2009) obtained reduction of 99.99% in the number of thermotolerant coliforms in the treatment system with UASB reactor and pond (4 logarithmic units removed), resulting in an effluent with an average concentration of thermotolerant coliforms of 1.1 x 10³ (100 mL)-1. According to the authors, the removal efficiency in number of coliforms was equal in UASB reactor and pond. These removals were lower than that obtained in this study using two UASB reactors in series, where there was a reduction of up to 5 log units, in assay 2.
It was also observed by BICHUETTE et al. (2008) and OLIVEIRA & SANTANA (2011), the anaerobic treatment system in two stage provided better removals of coliforms when compared to the efficiency of a single reactor with higher HDT. However, the mean values of thermotolerant coliforms in effluents were above 4x10³ NMP (100mL)-1, restricting the application of treated wastewater for irrigation of plants, taking as a basis the limits established by CONAMA Resolution 357 (BRAZIL, 2005) for thermotolerant coliforms in water bodies of class 3, which can be used for the irrigation of tree, cereal and forage crops, and for animal consumption.
CONCLUSIONS
The anaerobic treatment system in two stage, with UASB reactors in operating conditions imposed, was efficient in the removal of organic and inorganic pollutants, reaching up to average
values of 93% for COD, 96% for VSS, 99.9999% for coliforms; 75% for totalP; 69% for KN; 92%
for orgN; 77% for Zn, 94% for Fe and 89% for Cu. The removal efficiencies of organic matter and
The highest volumetric methane productions were obtained with higher VOL (34.4 and 45.2 g COD (L d) -1).
The VOL values from 14.4 to 34.4 g COD (L d)-1 applied in UASB reactor were not limiting to obtain high removal efficiencies of COD and VSS with conversion to methane, indicating that it can still withstand increased VOL with lower HDT and that use may be feasible in the treatment of swine wastewater.
ACKNOWLEDGEMENTS
The authors thank CAPES-MEC, TIGRE S.A. and UNORP (Centro Universitário de São José do Rio Preto) for financial support.
REFERENCES
AGGARANGSI, P; TEERASOUNTORNKUL, T. Practical design and efficiency of large–scale biogas digesters for swine farms in Thailand. Journal of Sustainable Energy Environment. p. 51-55, 2011. Special Issue.
AHN, J.H et al. The effect of calcium on the anaerobic digestion treating swine wastewater. Biochemical Engineering Journal, Amsterdam, v. 30, p. 33-60, 2006.
APHA, AWWA, WPCF. Standard methods for the examination of water and wastewater. 20th ed.
Washington: American Public Health Association, 1193p. 1998.
BICHUETTE, A.A.; DUDA, R.M.; OLIVEIRA, R.A. de. Treatment of swine wastewater in a two-stage upflow anaerobic sludge blanket reactors. In: CONGRESSO BRASILEIRO DE
ENGENHARIA SANITARIA E AMBIENTAL, 24., 2008, Belo Horizonte. Anais... Belo Horizonte: Associação Brasileira de Engenharia Sanitária e Ambiental, 2008. 1CD-ROM.
BRASIL. Ministério do Meio Ambiente. Resolução 357 de 17 de março de 2005. Dispõe sobre a classificação dos corpos de água, diretrizes ambientais para o seu em quadramento bem como estabelece as condições e padrões de lançamento de efluentes e dá outra providências. Brasília, DF: CONAMA, 2005. 23p.
BRASIL. Ministério do Meio Ambiente. Resolução 430 de 13 de maio de 2011. Dispõe sobre as condições e padrões de lançamento de efluentes, complementa e altera a Resolução no 357, de 17 de março de 2005. Brasilia, DF: CONAMA, 2011. 9p.
CÔTÉ, C.; MASSE, D.I.; QUESSY, S. Reduction of indicator and pathogenia microorganism by psychrophilic anaerobic digestion in swine slurries. Bioresource Techonology, Oxford, v. 97, n. 1, p.683-691, 2006.
DENG, L.W.; ZHENG, P.; CHEN, Z.A.; MAHMOOD, Q. Improvement in post-treatment of digested swine wastewater. Bioresource Technology, Barking, v.99, n.8, p.3.136-3.145, 2008.
DIAMANTIS, V.; AIVASIDIS, A. Comparison of single and two stage uasb reactors used for anaerobic treatment of syntethic fruit wasterwater. Enzyme and Microbial Technology, New York, v. 42, p. 6-10, 2007.
DILALLO, R.; ALBERTSON, O. E. Volatile acids by direct titration. Journal Water Pollution Control Federation, Alexandria, v.33, n.4, p.356-365, 1961.
DUDA, R.M.; OLIVEIRA, R.A. de Avaliação de partida de um sistema anaeróbio em dois estágios, constituído por reator UASB seguido de um filtro anaeróbio, no tratamento de águas residuárias de suinocultura. In: CONGRESSO BRASILEIRO DE ENGENHARIA SANITÁRIA E
AMBIENTAL, 25., 2009. Recife. Anais... Recife: Associação Brasileira de Engenharia Sanitária e Ambiental, 2009. 1CD-ROM.
UASB e filtro anaeróbio em série seguidos de filtro biológico percolador. Engenharia Sanitária Ambiental, Rio de Janeiro, v. 16, n. 1, p. 91-100, jan./mar. 2011.
FERNANDES, G.F.R; OLIVEIRA, R.A. de. Desempenho de processo anaeróbio em 2 estágios (reator compartimentado seguido de reator UASB) para tratamento de águas residuárias de suinocultura. Engenharia Agrícola, Jaboticabal, v. 26, n. 1, p. 243-256, jan./jun. 2006.
GERARDI, M. H. The microbiology of anaerobic digesters. Chichester: John Wiley & Sons, 2003. 130p.
HWANG, K.; SONG, M.; KIM, W.; HWANG, S. Effects of prolonged starvation on methanogenic population dynamics in anaerobic digestion of swine wastewater. Bioresource Tecnhology, Barking, v.101, n.1, p.2-6. 2010.
HUANG, J.S.; WU, C.S.; CHEN, C.M. Microbial activity in a combined UASB-activated sludge reactor system. Chemosphere, Taiwan, v. 61, n. 7, Nov, p. 1032-1041. 2005.
KHANAL, S. K. Anaerobic biotechnology for bioenergy production: principle and applications. Chichester: John Wiley & Sons, 2008. 293p.
LI, P.; WANG, Y.; WANG, Y.; LIU, K.; TONG, L. Bacterial community structure and diversity during establishment of an anaerobic bioreactor to treat swine wastewater. Water Science & Technology, Kidlington, v. 61, n. 1, p 243–252. 2010.
MANARIOTIS, I.D.; GRIGOROPOULOS, S.G. Restart of anaerobic filters treating low-strength wastewater. Bioresource Technology, Barking , v.99, n.9, p. 3579-3589. 2008.
MASSÉ, D.I.; DROSTE, R.L. Microbial interaction during anaerobic treat met of swine manure slurry in sequencing batch reactor. Canadian Agricultural Engineering Journal, v.39, n.1, p.35-41, 1997
OLIVEIRA, R. A. de. Efeito da concentração de sólidos suspensos do afluente no desempenho e características do lodo de reatores anaeróbios de fluxo ascendente com manta de lodo tratando águas residuárias de suinocultura. 1997. 389f. Tese (Doutorado em Hidráulica e Saneamento) – Escola de Engenharia de São Carlos, Universidade de São Paulo, São Carlos, 1997.
OLIVEIRA R.A. de; VAZOLLER, R.F.; FORESTI, E. Sludge bed characteristics of UASB reactors: growth, activity, microbial structure and chemical composition of granules. In: INTERNATIONAL CONFERENCE ON ANAEROBIC DIGESTION, 8., 1997, Sendai. Proceedings... Sendai: International Association Water Quality, 1997. p.524-531.
OLIVEIRA, R.A. de; FORESTI, E. Balanço de massa de reatores anaeróbios de fluxo ascendente com manta de lodo (UASB) tratando águas residuárias de suinocultura. Engenharia Agrícola, Jaboticabal, v. 24, n. 3, p. 807-820, 2004.
OLIVEIRA, R.A. de.; SANTANA, A.M. Tratamento de águas residuárias de suinocultura em reatores anaeróbios de fluxo ascendente com manta de lodo (uasb) em dois estágios seguidos de reator operado em batelada sequencial (rbs). Engenharia Agrícola, Jaboticabal, v. 31, n. 1, p. 178-192, Jan/Fev. 2011.
PEREIRA, E. R. Desempenho e caracterização microbiana do processo de dois estágios com reatores anaeróbios de fluxo ascendente com manta de lodo (UASB) tratando águas residuárias de suinocultura . 2003. 103 f. Dissertação (Mestrado em Hidráulica e Saneamento) - Escola de
Engenharia de São Carlos, Universidade de São Paulo, São Carlos, 2003.
RIBAS, M.M.F.; MORAES, E.M.; FORESTI, E. Avaliação da acurácia de diversos métodos para determinação de ácidos graxos voláteis e alcalinidade a bicarbonato para monitoramento de reatores anaeróbios. Engenharia Sanitária Ambiental, Pelotas, v.12, n.3, p. 240-246, jul/set. 2007.
RODRIGUES, L.S.; SILVA, I. J.; SANTOS, R. L. H.; GOULART, D. B.; OLIVEIRA, P. R.; VON SPERLING, M.; FONTES, D. O. Avaliação de desempenho de lagoa de polimento para o pós- tratamento de reator anaeróbico de manta de lodo (UASB) no tratamento de águas residuárias de suinocultura. Arquivo Brasileira Medicina Veterinária Zootecnia, Belo Horizonte, v. 61, n. 6, p. 1428-1433. 2009.
RODRIGUES, L.S.; SILVA, I. J. de; ZOCRATO, M. C. O.; PAPA, D.N.; VON SPERLING, M. ; OLIVEIRA, P. R. Avaliação de desempenho de reator UASB no tratamento de águas residuárias de suinocultura. Revista Brasileira de Engenharia Agrícola e Ambiental, Campina Grande, v. 14, n. 1, p. 94 -100. 2010.
SANTANA, A.M.; OLIVEIRA, R.A. Desempenho de reatores anaeróbios de fluxo ascendente com manta de lodo em dois estágios tratando águas residuárias de suinocultura. Revista Brasileira Engenharia Agrícola, Jaboticabal, v. 25, n.3, p.817-830. 2005.
SANTANA, A.M.; OLIVEIRA, R.A. Remoção de matéria orgânica, nutrientes e coliformes de águas residuárias de suinocultura em reatores UASB, em dois estágios, seguidos de reator aeróbio seqüencial em batelada. In: CONGRESSO BRASILEIRO DE ENGENHARIA SANTÁRIA E AMBIENTAL,25., 2009, Recife, Anais... Recife: Associação Brasileira de Engenharia Sanitária e Ambiental, 2009. 1CD-ROM.