www.atmos-chem-phys.net/15/6205/2015/ doi:10.5194/acp-15-6205-2015
© Author(s) 2015. CC Attribution 3.0 License.
Quantifying sources, transport, deposition, and radiative forcing of
black carbon over the Himalayas and Tibetan Plateau
R. Zhang1,2,3, H. Wang2, Y. Qian2, P. J. Rasch2, R. C. Easter2, P.-L. Ma2, B. Singh2, J. Huang1, and Q. Fu1,3 1Key Laboratory for Semi-Arid Climate Change of the Ministry of Education, College of Atmospheric Sciences, Lanzhou University, Lanzhou 730000, Gansu, China
2Atmospheric Sciences and Global Change Division, Pacific Northwest National Laboratory (PNNL), Richland, WA 99352, USA
3Department of Atmospheric Sciences, Box 351640, University of Washington, Seattle, WA 98195, USA
Correspondence to: H. Wang ([email protected])
Received: 25 October 2014 – Published in Atmos. Chem. Phys. Discuss.: 7 January 2015 Revised: 11 May 2015 – Accepted: 16 May 2015 – Published: 8 June 2015
Abstract. Black carbon (BC) particles over the Himalayas and Tibetan Plateau (HTP), both airborne and those de-posited on snow, have been shown to affect snowmelt and glacier retreat. Since BC over the HTP may originate from a variety of geographical regions and emission sectors, it is essential to quantify the source–receptor relationships of BC in order to understand the contributions of natural and anthropogenic emissions and provide guidance for potential mitigation actions. In this study, we use the Community At-mosphere Model version 5 (CAM5) with a newly developed source-tagging technique, nudged towards the MERRA me-teorological reanalysis, to characterize the fate of BC parti-cles emitted from various geographical regions and sectors. Evaluated against observations over the HTP and surround-ing regions, the model simulation shows a good agreement in the seasonal variation in the near-surface airborne BC concentrations, providing confidence to use this modeling framework for characterizing BC source–receptor relation-ships. Our analysis shows that the relative contributions from different geographical regions and source sectors depend on season and location in the HTP. The largest contribution to annual mean BC burden and surface deposition in the en-tire HTP region is from biofuel and biomass (BB) emissions in South Asia, followed by fossil fuel (FF) emissions from South Asia, then FF from East Asia. The same roles hold for all the seasonal means except for the summer, when East Asia FF becomes more important. For finer receptor regions of interest, South Asia BB and FF have the largest impact on BC in the Himalayas and central Tibetan Plateau, while East
Asia FF and BB contribute the most to the northeast plateau in all seasons and southeast plateau in the summer. Central Asia and Middle East FF emissions have relatively more im-portant contributions to BC reaching the northwest plateau, especially in the summer. Although local emissions only con-tribute about 10 % of BC in the HTP, this contribution is ex-tremely sensitive to local emission changes. Lastly, we show that the annual mean radiative forcing (0.42 W m−2) due to BC in snow outweighs the BC dimming effect (−0.3 W m−2) at the surface over the HTP. We also find strong seasonal and spatial variation with a peak value of 5 W m−2in the spring over the northwest plateau. Such a large forcing of BC in snow is sufficient to cause earlier snow melting and poten-tially contribute to the acceleration of glacier retreat.
1 Introduction
the midlatitudes of the Northern Hemisphere (Bond et al., 2013).
Modeling studies (e.g., Hansen et al., 2005; Qian et al., 2011) indicate that the climate efficacy of BC in snow is much greater than efficacy of carbon dioxide or other an-thropogenic forcers owing to a sequence of positive feedback mechanisms (Warren and Wiscombe, 1980, 1985; Conway et al., 1996; Hansen and Nazarenko, 2004; Jacobson, 2004; Flanner et al., 2007; Ye et al., 2012; Hadley and Kirchstet-ter, 2012; Doherty et al., 2014). Flanner et al. (2009) demon-strated that the global annual BC snow-albedo effect (darken-ing) outweighs the aerosol (BC and organic matter) dimming effect (i.e., reduced the downwelling irradiance reaching the surface) by a factor of about 6. The snow/ice-covered Hi-malayas and Tibetan Plateau (HTP) region is more prone to these BC effects than other regions because of the surround-ing two major BC source regions, East Asia and South Asia, at present and likely in the future (e.g., Bond et al., 2007; Ohara et al., 2007; Xu et al., 2009; Lamarque et al., 2010; Menon et al., 2010).
The HTP, often referred to as the “third pole”, has re-ceived much less scientific attention than the polar regions (Qiu, 2008), although it is the highest and largest plateau and stores one of the largest ice masses of the Earth system. The HTP also has a large area of seasonal and permanent snow cover and represents the most sensitive and visible indicator of climate change with its unique location for complex inter-actions among the atmosphere, hydrosphere, and cryosphere (e.g., Pu et al., 2007; Xu et al., 2009; Yao et al., 2012). The glaciers and the associated snowmelt over the HTP have a great potential to modify the regional hydrology and to trig-ger natural hazards that impact a large portion of the popula-tion in and around the region (e.g., Barnett et al., 2005; Singh and Bengtsson, 2004; Xu et al., 2008; Kaser et al., 2010; Im-merzeel et al., 2010; Yao et al., 2012; Bolch et al., 2012). The HTP also exerts profound influences on atmospheric circu-lation patterns and climate through mechanical and thermal effects due to its large area, highly elevated topography and geographical location in the Earth system (Yeh et al., 1957; Manabe and Terpstra, 1974; Ye and Gao, 1979; Yanai et al., 1992; Ye and Wu, 1998; Wu et al., 2012). The HTP acts as a giant wall across the Eurasian continent that blocks cold outbreaks from high latitudes in winter and confines the win-ter monsoon to easwin-tern and southern Asia, while in summer the HTP serves as a huge heat source through the strong sur-face sensible heating and latent heating over the central and eastern plateau (Wu et al., 2012).
The climate of the HTP is changing rapidly. For exam-ple, the surface sensible heat flux has weakened in recent decades, mainly due to global warming (Duan and Wu, 2008). Observational evidence indicated that the surface air temperatures on the HTP have increased about 1.8◦C over the past 50 years (Wang et al., 2008), while the large area at elevations above 4000 m has warmed at 0.3◦C per decade in the past three decades (Xu et al., 2009). A number of
re-cent studies reported that glaciers on the HTP have under-gone widespread losses at an increasing rate in past decades (e.g., Qin et al., 2006; Li et al., 2008; Kang et al., 2010; Bolch et al., 2012) and have undergone accelerated retreat in recent years (Yao et al., 2007). The rapid warming and the accelerated glacier retreat have been primarily attributed to increasing greenhouse gases (e.g., Duan et al., 2006; Ren et al., 2006), but other factors may be partly responsible for the accelerated warming over the HTP, such as atmospheric heating by absorbing aerosols, land use changes, and reduc-tion of snow albedo induced by light-absorbing impurities in snow (Kang et al., 2000; Prasad and Singh, 2007; Ra-manathan et al., 2007; Flanner et al., 2007, 2009; Yasunari et al., 2010; Xu et al., 2009; Qian et al., 2011, 2015). Lau et al. (2006, 2010) proposed and demonstrated the elevated heat pump mechanism, whereby heating induced by airborne BC and dust absorption can strengthen local circulations and lead to a northward shift of the monsoon rain belt, widespread en-hanced warming over the HTP, and accelerated snowmelt and glacier retreat. Previous observational and modeling studies have indicated that BC deposition on snow and ice, which has experienced a trend of rapid increase in recent years, has been a significant contributor to the early snowmelt and rapid glacier retreat over the HTP (e.g., Flanner et al., 2007, 2009; Ming et al., 2008; Xu et al., 2009; Kaspari et al., 2011; Menon, et al., 2010; Qian et al., 2011, 2015; Wang et al., 2015). Flanner et al. (2007) found that the largest regional annual mean forcing due to BC in snow is located in the HTP. Xu et al. (2009) and Lau et al. (2010) suggested that the BC in snow/ice may be partly responsible for the observed accel-eration of glacier retreat in the HTP.
Understanding the role of BC in accelerating snow cover reduction and glacier retreat is becoming increasingly impor-tant. Over 60 % of BC in the present-day atmosphere origi-nates from anthropogenic activities (e.g., Bond et al., 2007; Lamarque et al., 2010). Reduction of emissions from BC-rich sources represents a potential mitigation strategy to slow down present-day climate change because BC has a positive radiative forcing but a short atmospheric lifetime (Bond et al., 2013). Since BC over the HTP may originate from a va-riety of geographical regions and emission sectors, it is es-sential to quantify the source–receptor relationships of BC in order to understand the contributions of open-fire and anthro-pogenic emission sectors to BC over the HTP. This exercise is also essential to provide guidance for potential mitigation actions.
the spatial distribution of sources for BC reaching the HTP region based on a large set of 7-day back trajectories arriv-ing at the given height (i.e., 500 m) and receptor locations, BC emissions, and transport efficiencies. The statistical anal-ysis of trajectories has good accuracy on short timescales for source regions with close proximity to the receptor, but this approach has limitations in determining contributions from distant sources to BC in the middle and upper troposphere that could contribute significantly to the total column bur-den but less to BC deposition and boundary-layer concentra-tions. Using the adjoint of the GEOS-Chem global chemical transport model, Kopacz et al. (2011) attempted to identify the originating locations of BC arriving at five glacier sites (i.e., five model grid cells as the receptors) in the HTP for year 2001. This method can provide a global distribution of emissions that directly contribute to BC concentrations at re-ceptor locations. Note that the adjoint model results are not source attributions but rather the source–receptor sensitivi-ties, which can be interpreted as the effectiveness of incmental changes to existing emissions in affecting BC at re-ceptor locations. While the adjoint approach has the advan-tage of not predefining source regions, it does require per-forming separate simulations for each of the defined receptor regions.
In this study, we use an aerosol–climate model with a newly developed explicit source-tagging approach (Wang et al., 2014) to produce a detailed characterization of the fate of BC emitted from various geographical regions and sec-tors (e.g., fossil fuel, biofuel, and biomass burning emis-sions) and transport pathways to the HTP. In contrast to the back-trajectory and the adjoint approaches, the direct tagging method has the flexibility to do source attribution of BC mass mixing ratio at any model layer and the surface dry and/or wet deposition within a single simulation for any receptor regions. Section 2 describes the aerosol–climate model and the tagging method used in this study. Section 3 presents an evaluation of modeled BC surface concentrations and sea-sonal snow cover over the HTP region. The transport path-ways and source attribution results are presented in Sect. 4. The radiative effects of BC in the atmosphere and of both BC and mineral dust in snow are compared in Sect. 5, followed by the summary and conclusions in Sect. 6.
2 Model configuration and experimental design 2.1 The CAM5 model and the source-tagging method We use the Community Atmosphere Model version 5 (CAM5; Neale et al., 2012), which is the atmospheric com-ponent of the Community Earth System Model version 1 (CESM1) (Hurrell et al., 2013). It includes relatively com-prehensive representations of aerosols and clouds, and mech-anisms for their interactions with each other and with climate (Gettelman et al., 2010; Liu et al., 2012). CAM5 employs a
modal aerosol module (MAM) to represent aerosols in mul-tiple log-normally distributed modes, with internal mixing assumed for aerosol species within each individual mode, in-cluding a three-mode standard representation (MAM3) and a more complex seven-mode representation (MAM7). The major difference between MAM3 and MAM7 related to car-bonaceous aerosols lies in the treatment of aging. In MAM3, BC and primary organic matter (POM) particles are emit-ted into the accumulation mode, which also contains highly hygroscopic species such as sulfate and sea salt, while in MAM7, BC and POM are emitted into a primary carbon mode, which contains no other species. BC is hydrophobic upon emission, and thus the hygroscopicity of the primary-carbon-mode particles depends on the assumed hygroscopic-ity for POM. As more hygroscopic species (e.g., H2SO4and NH3) condense onto the primary-carbon-mode particles, the particles become more hygroscopic and are gradually ferred into the MAM7 accumulation mode. The rate of trans-fer is controlled by uncertain aging parameters and the avail-ability of gas precursors (Liu et al., 2012). In the accumu-lation mode of both MAM3 and MAM7, BC is internally mixed with other more hygroscopic species and is thus sub-ject to wet scavenging and removal processes. During the transport from sources to remote regions, aerosols are re-moved too efficiently in the default CAM5 (Liu et al., 2012). Recently, H. Wang et al. (2013) revised some key processes associated with aerosol wet removal and convective trans-port, which significantly improved the vertical distribution of aerosols and their transport to remote regions such as the Arctic.
index of the accumulation mode that is used in the radiation calculation.
In addition to the free-running mode, CAM5 can also be configured in an offline mode, in which temperature, wind, surface fluxes (heat, moisture, and momentum), and pres-sure are constrained to agree closely with observations, while clouds and aerosol are allowed to evolve freely (Rasch et al., 1997; Lamarque et al., 2012; Ma et al., 2013). In this study, we run the CAM5 model in the offline mode with the di-rect BC source-tagging capability, including the improved representation of convective transport and wet removal of aerosols. We use the NASA Modern Era Retrospective-Analysis for Research and Applications (MERRA) reanal-ysis data set (Rienecker et al., 2011), using a horizontal res-olution of 1.9◦×2.5◦and 56 vertical levels. The goal is to characterize the fate of BC emitted from various geographi-cal regions and sectors, their transport pathways to the HTP, and their radiative forcing with seasonal variations. The sim-ulation is performed for year 2001 with prescribed sea sur-face temperatures.
2.2 BC source regions and sectors
BC emission data sets have large uncertainties (e.g., Bond et al., 2013), and there are different inventories available for climate modeling. We use the present-day (i.e., year 2000) monthly mean emission inventories for BC provided by Lamarque et al. (2010). They were built for the climate model simulations in the Coupled Model Intercomparison Project Phase 5 (CMIP5) (Taylor et al., 2012) performed for the Fifth Assessment Report (AR5) of the Intergovernmen-tal Panel on Climate Change (IPCC). The AR5 BC emis-sions being used in our CAM5 simulation include monthly varying elevated open-fire emissions (injection altitude up to 6 km), and yearly constant surface emissions from shipping and from six sectors over land: agricultural waste burning, domestic, energy, industry, transportation, and waste treat-ment. These surface BC emissions sectors do not distinguish between biofuel and fossil fuel combustion. To prepare for the BC source sector tagging, we divide the total surface emissions into two broader sectors, biofuel and fossil fuel, by using the ratio of biofuel to biofuel plus fossil fuel at each model grid provided by Dentener et al. (2006). We then com-bine the biomass burning (open fire) emissions and surface biofuel emissions, hereafter referred to as the BB (biofuel and biomass) sector. The shipping emissions are combined with the fossil fuel emissions over land to form the FF (fossil fuel) sector. Note that emissions in the BB sector have sea-sonal variations (associated with the open-fire emissions) but the FF sector emissions used in this study have no seasonal variation at all.
The 16 geographical BC source regions (Fig. 1a) are de-fined using the definition of source/receptor regions by Work Plan (WP 2.1) of the Task Force on Hemispheric Transport of Air Pollution (http://iek8wikis.iek.fz-juelich.de/HTAPWiki/
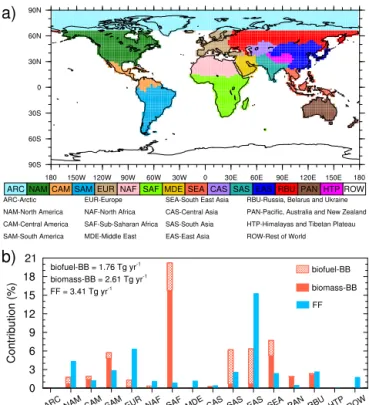
Figure 1. (a) Tagged source regions and (b) the respective
percent-age contributions to global annual mean BC emissions from the individual source regions and sectors (including biofuel, biomass burning, and fossil fuel). The global annual mean BC emission rate is 7.78 Tg yr−1, which is divided into the three sectors as indicated by the numbers in the upper-left corner.
WP2.1). They are ARC (Arctic), NAM (North America), CAM (Central America), SAM (South America), EUR (Eu-rope), NAF (North Africa), SAF (Sub-Saharan Africa), MDE (Middle East), CAS (Central Asia), SAS (South Asia), EAS (East Asia), SEA (South East Asia), PAN (Pacific, Australia and New Zealand), RBU (Russia, Belarus and Ukraine), HTP (Himalayas and Tibetan Plateau), and ROW (rest of world).
days), due in part to higher open-fire emissions (in the BB sector) during local dry seasons. Another reason is that open-fire emissions have initial injection heights of up to 6 km, resulting in less removal below 6 km. The availability of co-emitted hygroscopic species that are internally mixed with BC in the accumulation mode of the MAM3 aerosol treat-ment also impacts the scavenging and wet removal rate of BC. This also in part explains the variability of BC lifetime among the different source regions and sectors. Regarding the seasonal cycle, BC emitted from the major source regions (e.g., SAF, EAS, SEA, SAS) has substantially lower lifetime in summer (JJA) than in the other seasons, likely due to rela-tively strong removal by the summer monsoon precipitation. We use two metrics for quantifying source–receptor rela-tionships and the sensitivity of BC in a receptor region to various sources following Wang et al. (2014), but we extend them to treat BB and FF sectors separately.
1. The fractional contribution of BB and FF emissions from source region ito a BC property in receptor re-gionj(the entire HTP or a subset of it),CiBBorCiFF, is defined as
CiBB=A BB i
Aj
, CiFF=A FF i
Aj
, (1)
whereABBi andAFFi are a BC property (e.g., mass mix-ing ratio, column burden, or deposition flux) in/over receptor region j resulting from BB and FF emis-sions, respectively, in source region i, and Aj=
N
P
i=1
ABBi +AFFi represents the total BC property in the receptor region from all source regions (N=16 in this study) and sectors (BB and FF). Note that for BC prop-erties such as column burden, surface mixing ratio, and deposition flux, the tagging method in CAM5 explic-itly calculates how much is due to emissions from each source region and sector.
2. The efficiency of BB and FF emissions from source re-gioniin changing BC in a receptor regionj is defined as
SiBB=C BB i EBB
i Etot
, SiFF=C FF i EFF
i Etot
, (2)
whereCiBBandCiFFare the fractional contribution de-fined in Eq. (1), EBBi and EiFF are the total BB and FF emission rates, respectively, in source regioni, and Etot=
N
P
i=1
(EiBB+EiFF)in Eq. (2) represents the global total emission rate. The efficiency metric SiBB or SiFF characterizes the sensitivity of aerosol properties in a receptor region to per unit (BB or FF) emissions in
source regioni. As noted in Wang et al. (2014), the ef-ficiency is proportional to the metric of relative contri-bution per unit source region emission used by Shin-dell et al. (2008). Physically, the efficiency metric can be viewed as the efficiency of transport from a source region to the receptor region. This metric is perhaps of more interest to policymakers for the purpose of miti-gation action, which is not the focus of this study but is worth mentioning.
3 Model evaluation against available observations The CAM5 model has been evaluated in detail from different perspectives with available observations such as aerosol mass concentration, aerosol number concentration and size distri-bution, aerosol optical properties, cloud properties, aerosol deposition, and BC in snow over various regions in previ-ous studies (Liu et al., 2012; H. Wang et al., 2013; Ma et al., 2013; Jiao et al., 2014; Lee et al., 2013; Qian et al., 2014). Because of the complex topography and meteorology of the HTP and the relatively coarse resolution of the global model, further model evaluation focusing on the HTP region is criti-cal. Here we use near-surface atmospheric BC concentrations measured at a few HTP sites and the snow cover fraction re-trieved from satellite to evaluate the CAM5 performance in the HTP.
3.1 Atmospheric BC surface concentration
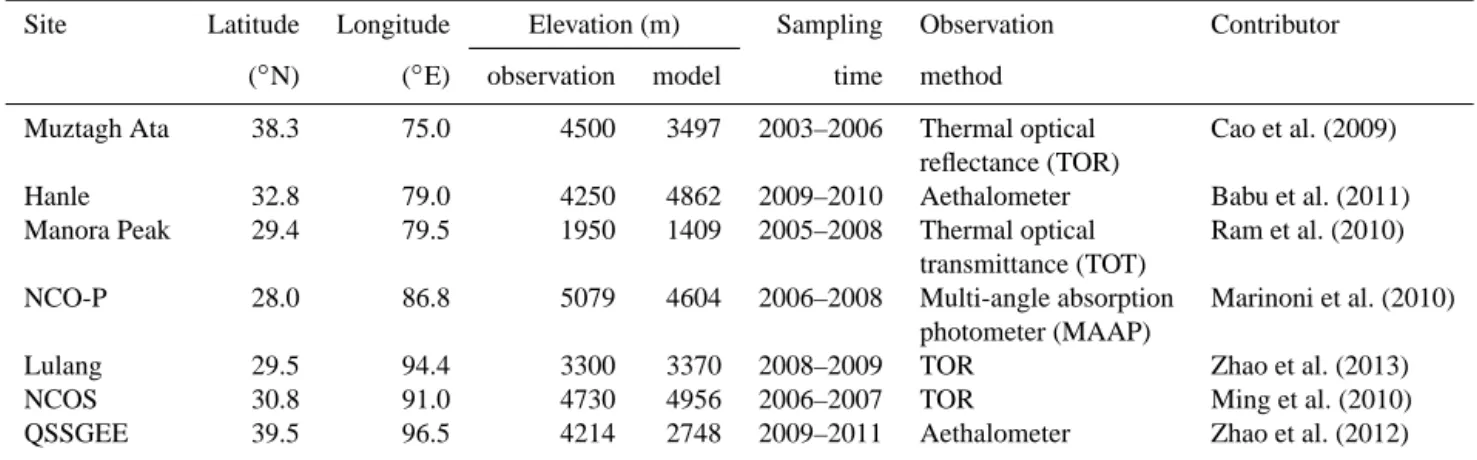
underesti-Table 1. List of sites for the observations of atmospheric BC surface concentrations used in this study to evaluate our model simulation.
Site Latitude Longitude Elevation (m) Sampling Observation Contributor
(◦N) (◦E) observation model time method
Muztagh Ata 38.3 75.0 4500 3497 2003–2006 Thermal optical Cao et al. (2009) reflectance (TOR)
Hanle 32.8 79.0 4250 4862 2009–2010 Aethalometer Babu et al. (2011) Manora Peak 29.4 79.5 1950 1409 2005–2008 Thermal optical Ram et al. (2010)
transmittance (TOT)
NCO-P 28.0 86.8 5079 4604 2006–2008 Multi-angle absorption Marinoni et al. (2010) photometer (MAAP)
Lulang 29.5 94.4 3300 3370 2008–2009 TOR Zhao et al. (2013) NCOS 30.8 91.0 4730 4956 2006–2007 TOR Ming et al. (2010) QSSGEE 39.5 96.5 4214 2748 2009–2011 Aethalometer Zhao et al. (2012)
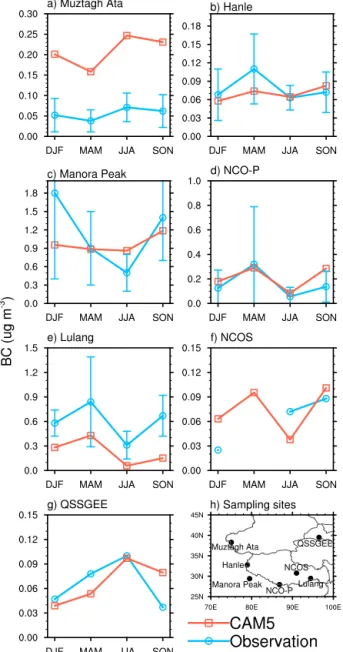
mation (about 1000 m; see Table 1) of the Muztagh Ata site elevation in the model, determined by the model grid resolu-tion, could largely explain the overestimation of BC since BC concentrations have sharp decreases with height in this re-gion. At the sites over the southern HTP (i.e., Hanle, Manora Peak, NCO-P, Lulang, and NCOS), the BC surface concen-trations in the summer (JJA) are lower, mainly due to wet scavenging by more frequent precipitation and partly due to the minimal emissions from domestic heating and wildfires over the Himalaya foothills and Indo-Gangetic Plain (IGP) during the Indian summer monsoon season (Marinoni et al., 2010, 2013). Among all these sites, the largest BC surface concentrations occur at the Manora Peak site, which is closer to the major sources in South Asia, especially in the win-ter (DJF), when the model underestimates the concentrations by about 50 %. The high concentrations in winter at Manora Peak is mainly due to the dry winter monsoon conditions and increased transport of emissions from regional biomass burn-ing, agricultural waste, and wood fuel burning from the IGP (e.g., Ram et al., 2010; Moorthy et al., 2013). The BC sur-face concentrations peak in the springtime (MAM) at Hanle, NCO-P, Lulang, and NCOS sites. This might be related to an increase in BB and/or FF emissions in the Indian Sub-continent, along with the higher regional boundary-layer top over the IGP during the springtime that may favor the trans-port of particles from the surface up to higher altitudes (e.g., Marinoni et al., 2010, 2013). Moreover, long-range trans-port of pollution emitted from distant regions like the Mid-dle East, North Africa, or Europe (Marinoni et al., 2010) could further contribute to BC variability over the southern Himalayas, which will also be examined in this study. Part of the discrepancies between observations and model results can be attributed to the inherent difficulty in simulating the cloud/precipitation fields over the complex topography and subsequent wet removal of aerosols during the transport, but emission uncertainties (e.g., Bond et al., 2013) might play a primary role.
3.2 Snow cover fraction
It is important to evaluate the performance of model in sim-ulating seasonal snow over this region in order to assess the importance of BC-in-snow effect. Figure 3 shows the CAM5 simulated seasonal and annual mean snow cover fraction (SCF) during year 2001, in comparison to observed mean SCF, derived from the Moderate Resolution Imaging Spec-trometer (MODIS) (Hall et al., 2006) monthly mean of daily products at 0.05◦ resolution. For a better comparison, the MODIS monthly mean SCFs are mapped to the CAM5 grid. The summer (JJA) season only includes July and August for both CAM5 and MODIS due to missing MODIS data in June 2001. To illustrate whether year 2001 can represent the average condition in terms of SCF, the MODIS SCF climatol-ogy (2000–2013) is also plotted. The overall SCF in HTP has very small difference between climatology and year 2001 in all seasons except for JJA, when SCF is notably higher over the northwest plateau for the climatology that included June SCF in the average. On average, SCF is about 5 % (absolute amount) higher in June than in July and August. Over the 52 HTP grid cells, the CAM5 SCF is highly correlated spatially with that of MODIS (for both 2001 and 2000–2013) with the statistical confidence level greater than 99 %, except for summer (JJA), when the linear correlation is significant only at 80 % level.
Figure 2. Seasonal mean surface BC concentration (µg m−3) from observations (blue lines with error bars denoting SD) and CAM5 simulation (red lines) at the seven sampling sites listed in Table 1 and marked in the map of panel (h).
to its earlier version (CAM3) that remarkably overestimated the SCF especially over the HTP interior (Qian et al., 2011), although the CAM5 still significantly overestimates the SCF in the western plateau in DJF and MAM and underestimates it in JJA. The CAM3 model used by Qian et al. (2011) over-estimates SCF by up to a factor of 2 during the cold season (November to April). The CAM3 spring (MAM) mean SCF is greater than 35 %, while the CAM5 spring mean (21 %) in the present study is in good agreement with the MODIS spring SCF (18±5 %).
Although we believe that the CAM5 SCF biases are quali-tatively robust, it is worth noting that the MODIS products
Figure 3. Seasonal and annual mean snow cover fraction from
CAM5 simulation for year 2001 (left), and MODIS retrieval for 2001 (middle) and 2000–2013 (right). The summer (JJA) in 2001 for both CAM5 and MODIS only includes July and August due to missing MODIS data in June. The number in the lower-left corner of each panel is the corresponding spatial mean SCF for the HTP region (which is marked with a black outline), and for MODIS the standard deviation calculated from the MODIS multi-year means is also included.
4 Modeled transport pathways and source attribution of BC in the HTP
4.1 Transport pathways
The direct source-tagging method can clearly characterize the three-dimensional transport pathways of BC emitted from various source regions and sectors to the HTP receptor region. General circulation patterns over the HTP and sur-roundings are typically affected by midlatitude westerlies in the winter and Asian monsoon in the summer, including the South Asian summer monsoon and East Asian summer mon-soon (Xu et al., 2009; Yao et al., 2012; Wu et al., 2012; also see Fig. S2).
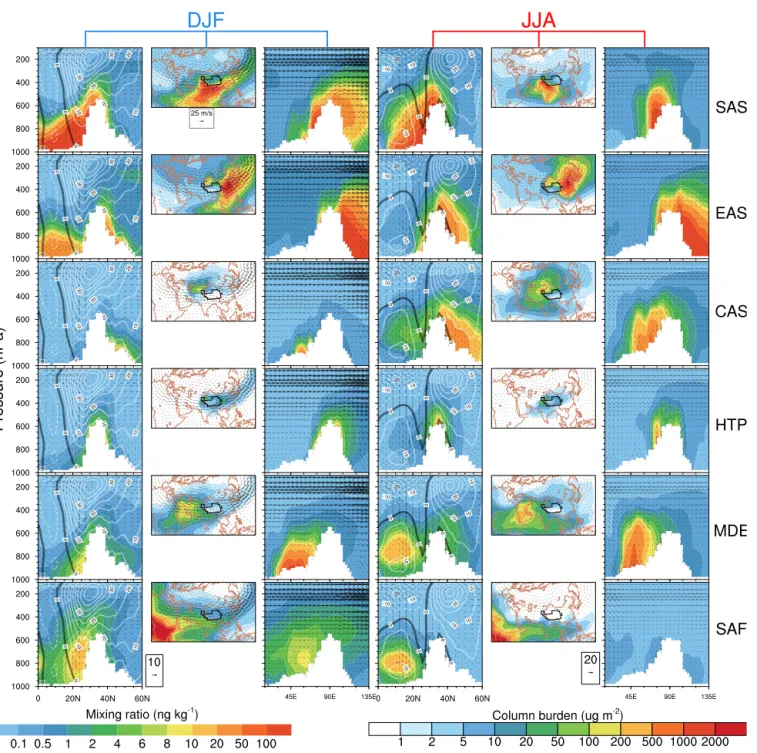
Figure 4 illustrates circulation patterns over HTP and BC transport pathways from six major source regions to the HTP in the winter (DJF) and summer (JJA). (See similar plots in Figs. S3–S5 for other tagged source regions.) In the win-ter, the strong surface cooling over the HTP leads to subsi-dence/divergence and the formation of an enhanced local cir-culation cell, while in the summer air converges toward the HTP from the surroundings, particularly from South Asia, due to the ascending of strongly heated air over the HTP (e.g., Wu et al., 2012), as also indicated by the arrows in the vertical cross sections in Fig. 4. In the winter, the subtropi-cal westerlies extend to about 10◦N in middle/upper tropo-sphere and 20◦N near the surface, and the tropical easterlies are weak (see the white contours of latitude–height cross-section panels in Fig. 4). The circulation patterns near the HTP change dramatically during the summer monsoon sea-son. The reversal of surface wind regime in the tropics (e.g., Arabian Sea, Bay of Bengal, and South China Sea) is charac-teristic of the Asian summer monsoon climate (see Fig. S2e, g). The subtropical westerlies recede to north of 30◦N and the center of the westerly jet shifts to about 40◦N in JJA (from about 30◦N in DJF). The strong easterlies character-ize the upper troposphere of tropical region (south of HTP), while the southwesterly flow prevails in the lower tropo-sphere (white contours of latitude–height cross-section pan-els in Fig. 4). The prevailing winds during the transition sea-sons (MAM and SON) between DJF and JJA are still west-erlies (Fig. S2b, d).
The circulation patterns determine the transport of BC around the HTP region. However, the variations in spatial distributions of BC emitted from the different source regions and in different seasons could be due to the differences in source location and strength, wet removal rate, and lifting. Note that although we combined BC emitted from BB and FF sections to characterize transport pathways in Fig. 4, only BC emissions from the BB sector have seasonal variations in the emission inventory we use.
The HTP region is surrounded by two major BC source re-gions, SAS and EAS (Fig. 1a), which potentially have great impact on BC in the HTP (e.g., Menon et al., 2010; Bond et al., 2007; Ohara et al., 2007; Xu et al., 2009; Kopacz et
al., 2011; Lu et al., 2012). BC emissions from SAS are dom-inated by the BB sector, and by FF sector from EAS (Fig. 1b). As shown in Fig. 4, in the winter, a significant amount of BC from SAS can be transported to the eastern plateau by the strong westerlies under the dry winter monsoon conditions. During the South Asian summer monsoon BC from SAS is effectively removed by the local abundant precipitation, as indicated by the low lifetime in summer (Table S2), but can still affect large area in the southwest of the HTP. However, BC from EAS can be uplifted higher and transported more to the northeast plateau in the summer monsoon season than in the winter. Along the wintertime westerlies, BC from up-wind source regions (e.g., EUR, NAF, SAF, MDE, and CAS; see Fig. S3) can easily move to the HTP, while the HTP local emissions are transported far away (Fig. 4). BC originating from the distant sources such as SAF and MDE reaches up high (to 300hPa) in the HTP. In the summer, continental deep convection can loft BC into higher altitudes, where it can be transported to the HTP along the relatively weaker westerlies from upwind source regions (e.g., EUR, RBU, MDE, and CAS; see Figs. 4 and S3). However, BC from distant low-latitude source regions such as SAF barely reaches the HTP region due to weak emissions but strong removal along the transport pathways to the HTP during the summer monsoon season.
4.2 Seasonal variation in BC in the HTP
Figure 4. The first column shows the latitude–height distributions of DJF BC mass mixing ratios (in ng kg−1, colors) averaged over 71.25– 101.25◦E, originating from BB and FF sectors in the tagged source regions (corresponding to different rows); the white area denotes topography, and the superimposed white contours at intervals of 5 m s−1represent the westerly (solid) and easterly (dashed) DJF mean zonal winds along the cross section with the thick solid black contour at 0 m s−1; the wind vectors (consisting of vertical velocity in units of
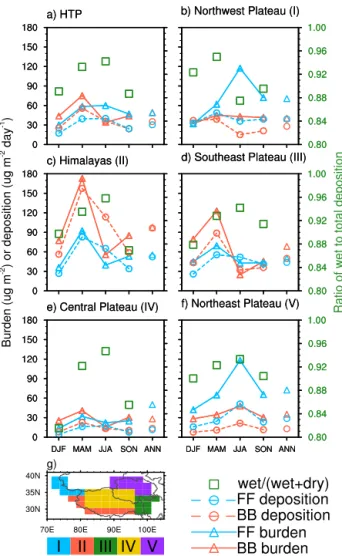
Figure 5. Seasonal and annual mean BC column burden (solid lines
and open triangles, in µg m−2) and deposition rate (dashed lines and open circles, in µg m−2day−1) over (a) the HTP, (b) northwest plateau, (c) Himalayas, (d) southeast plateau, (e) central plateau and
(f) northeast plateau, emitted from BB (red) and FF (blue) source
sectors. The green squares denote the ratio of wet to total BC depo-sition (usingyaxis on the right) in four seasons over each receptor region. The geographical locations of five subregions of HTP are indicated in panel (g).
decreases in SON (Fig. 5b and f), partly due to the peak con-tribution of EAS and CAS emissions in JJA. This trend is also similar to that in the observed surface concentrations (Fig. 2a and g). The deposition rate follows the same seasonal varia-tion in column burden over the northeast plateau, while the deposition has a minimum in JJA over the northwest plateau when the column burden is at maximum, likely due to the less efficient wet removal in this region (Fig. 5b and f).
The annual mean BC column burden over the HTP has almost the same contributions from BB and FF emission ori-gins, with BB dominating in DJF and MAM and FF in JJA. In the Himalayas, BC is predominantly from the BB sector for all seasons (Fig. 5c). In the southeast and central plateaus, the
dominant source sector is BB in DJF and MAM, but FF dom-inates in JJA. The dominant source sector over the northwest and northeast plateaus is always FF, especially in the sum-mer. We need to analyze the source–receptor relationships in order to quantify the roles of BB and FF emissions from the various source regions in determining BC over the HTP and the subregions.
4.3 BC source–receptor relationships
Previous studies (e.g., Xu et al., 2009; Kopacz et al., 2011) have shown that BC and its source–receptor relationships vary significantly with season and location in the HTP. We intend to quantify source contributions to BC at different lo-cations of the HTP and in different seasons. Our analysis also shows that the relative contributions to BC from differ-ent source regions and sectors depend on season and location in the HTP. As shown in Fig. 6, the largest contribution to the annual mean BC burden and surface deposition for the entire HTP region is from BB emissions from SAS, followed by FF emissions from SAS and then the FF from EAS. The same roles hold for all the seasonal means except for the summer (JJA), when the EAS FF becomes more important for BC column burden in the HTP and, to a lesser extent, for deposi-tion.
The SAS emissions account for 50 % of the annual mean burden over the HTP, including 33 % from BB and 17 % from FF. The other 50 % is mostly from the EAS (5 % BB and 14 % FF), HTP (6 % BB and 6 % FF), CAS FF (4 %), MDE FF (4 %), and SAF BB (3 %). The source attribution for an-nual mean BC deposition for the entire HTP is similar, but SAS contributes even more to BC deposition than to the col-umn burden. Although RBU has a lower contribution to the annual mean BC in the HTP than the six regions shown in Fig. 6, its contribution to the JJA mean, especially at some locations, is quite substantial (included in the black bar) and even more important than some of the six regions in Fig. 6, as discussed in detail below.
BC annual mean burden over the HTP has nearly equal contributions from BB and FF emissions. However, the con-tribution by BB emissions, mainly from SAS, is larger than from the FF sector in DJF and MAM. In the summer (JJA), the largest contribution (about 29 %) to HTP BC is from EAS FF emissions. This is partly due to the change in circulation patterns (Fig. 4) and effective wet removal of SAS BB emis-sions. Note that EAS FF emissions are much larger than FF emissions from any other of the source regions, and are more than twice the EAS BB emissions.
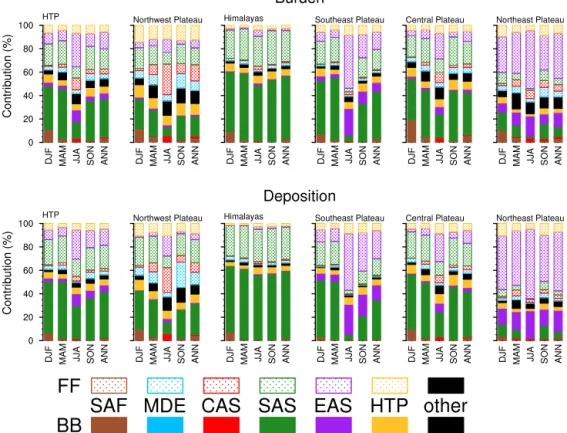
im-Figure 6. Fractional contributions (measured by the lengths of color bars) to seasonal and annual mean BC column burden (top six panels)
and deposition (bottom six panels) over the HTP, northwest plateau, Himalayas, southeast plateau, central plateau, and northeast plateau, originating from six major tagged source regions (indicated by colors) for BB (solid bar) and FF (dotted bar) emissions. The black bar in each column represents the contribution from all of the other tagged source regions and sectors combined.
portant contribution to BC reaching the northwest plateau, especially in the summer.
For the northwest plateau, the prevailing winds in this sub-region are westerly throughout the year (Fig. S2; Cao et al., 2009; Xu et al., 2009), so the important source regions should be located at the west of the HTP (e.g., MDE, EUR, and parts of SAS and RBU in Fig. 1a). As shown in Fig. 6, SAS emis-sions are still the dominant source for the annual BC burden in this subregion (17 % from BB and 14 % from FF), fol-lowed by HTP local emissions (9 % from BB and 13 % from FF), CAS (2 % from BB and 14 % from FF), MDE FF (8 %), and EAS FF (7 %). BC emissions from SAS are the dominant source in DJF, MAM, and SON. CAS becomes the dominant source region (5 % from BB and 26 % from FF) in JJA, even though CAS is not a significant emission source region on a global basis (Fig. 1b). BC emitted from MDE is predomi-nantly in the FF sector throughout the year. Emissions from the rest of the tagged sources (in addition to the six sources listed; black bar in Fig. 6) become more significant in this subregion, mostly from EUR and RBU through long-range transport (Fig. S3). The source attribution for BC deposition in this subregion is similar to that of the column burden, but BC emitted from SAS and MDE appears to be more efficient
in deposition, except for the JJA season, when BC from EAS contributes more to deposition than to column burden.
The Himalayas subregion located along the southern edge of the HTP is in close proximity to the SAS. Thus emissions from SAS are absolutely the dominant source for BC in the Himalayas throughout the year. This subregion receives more BC from the BB sector than FF because BC emissions in SAS are mainly in the BB sector, especially in the MAM season (Figs. 1b and S6). For the annual mean burden, BC from SAS contributes 81 % (54 % from BB and 27 % from FF), followed by HTP local emissions (6 % from BB and 3 % from FF). It is worth noting that SAF BB emissions contribute about 10 % to burden in DJF through long-range transport. BC deposition in this subregion also predomi-nantly originates from SAS, which is consistent with previ-ous studies by Ming et al. (2008) and Kopacz et al. (2011).
branch of the westerlies during the winter and spring. How-ever, the BC source contribution profile changes dramati-cally during the summer, when emissions in EAS become the dominant source to this subregion (68 % to column bur-den, including 23 % from BB and 45 % from FF). Kopacz et al. (2011) also found that the BC from southeastern China is the dominant contributor to the southeast plateau in July. For the annual mean burden in this subregion, SAS is still the dominant contributor (40 % from BB and 17 % from FF), followed by EAS (8 % from BB and 15 % from FF), and HTP (6 % from BB and 6 % from FF). BC originating from EAS contributes more to deposition than to burden in this subre-gion.
For the central plateau (Fig. 6), source attribution profiles for annual and seasonal BC are very similar to those of the entire HTP region, with SAS being the dominant source re-gion throughout the year, except that EAS has comparable contributions in JJA. Ming et al. (2010) pointed out that pol-lutants from the Indo-Gangetic Basin could be transported to the central plateau by both the summer monsoon and the westerlies. Xia et al. (2011) also found that the substantial regional atmospheric brown haze from the nearby regions of SAS is the main source for the background aerosols in the central plateau based on sun photometer and satellite obser-vations.
Compared to the other subregions, the northeast plateau receives the largest contribution of BC from EAS throughout the year (50 % to annual mean burden, including 12 % from BB and 38 % from FF; see Fig. 6), especially in JJA (17 % from BB and 49 % from FF). The EAS FF sector contribu-tion and the magnitude of burden (Fig. 5f) over the northeast plateau have strong seasonal variations, mostly due to varia-tions in meteorology, because the FF emissions in our sim-ulation do not vary seasonally. Kopacz et al. (2011) indicate that the primary contribution to BC over the northeast plateau is from western China during January and April (transported by midtropospheric westerlies), and from central-eastern China during July and October (transported by boundary-layer flow). Other main contributions to BC burden over the northeast plateau include 13 % from SAS and 10 % from HTP local emissions. Similar to the northwest plateau, some other upwind source regions (e.g., CAS, MDE, RBU, and EUR; see Figs. 4 and S3) have a significant contribution to the northeast subregion as well.
4.4 Seasonal variation in HTP BC sensitivity
Following Wang et al. (2014), we defined the “efficiency” metric in Sect. 2.2 to quantify the sensitivity of BC response to absolute change (e.g., per unit perturbation) of emissions in different source regions. This metric has the value of 1 if the entire globe is treated as a single source region, so we may assume the global mean efficiency of 1 as a reference to measure the sensitivity to perturbation from different source regions/sectors.
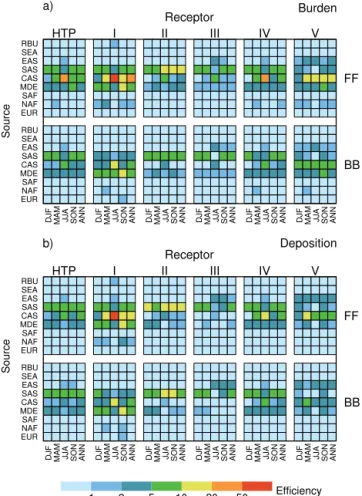
Figure 7. Efficiency of FF (top) and BB (bottom) emissions from
9 source regions (on theyaxis) in changing seasonal and annual mean (a) BC column burden and (b) deposition over the HTP and each of the five subregions: northwest plateau (I), Himalayas (II), southeast plateau (III), central plateau (IV), and northeast plateau (V).
in all seasons, while BC in the southeast plateau is sensitive to EAS emissions in JJA and SON. Although BC emissions from MDE and CAS are weak (Fig. 1b) and their contribu-tions to the HTP are relatively low, their efficiencies are high. BC over the northwest plateau (receptor I) and central plateau (receptor IV) is extremely sensitive to emissions from CAS in JJA. These source–receptor relationships of sensitivity will provide useful information for policymakers to improve the effective mitigation road map in order to potentially slow down the glacier retreat in the HTP region.
5 Radiative forcing
The BC-in-snow effect can be quantified using the online cal-culation of radiative forcing in the SNICAR (Snow, Ice, and Aerosol Radiative) model (Flanner et al., 2007) coupled to CAM5, and then compared to airborne BC radiative forcing. Figure 8 shows seasonal and annual mean BC all-sky short-wave direct radiative forcing (DRF) at the surface (dimming) and the top of the atmosphere (TOA), and the BC-in-snow radiative forcing (darkening) averaged over the entire HTP and the five subregions (as defined in Fig. 5g). Note that the BC-in-snow forcing is averaged over all model grids in the area (i.e., zero enters the calculation for any grid when snow is not present). The radiative forcing of BC (and dust) in snow is small in JJA and SON due to a lack of snow cover (Fig. 3). The forcing maximum occurs during the spring melt (MAM), when the insolation is rather intense and BC accu-mulates at the surface of the snowpack as the snow melts (Conway et al., 1996; Flanner et al., 2007, 2009), and when the snow-albedo feedback is strongest (Hall and Qu, 2006). This strong seasonal variation also explains why the coeffi-cient of variation (i.e., the ratio of the SD to the mean) is greater than 1 for the annual mean BC-in-snow forcing over the entire HTP and all subregions. The seasonal variations in airborne BC DRF at the TOA and surface are consistent with that of the BC column burden (Fig. 5). For the entire HTP (Fig. 8a1), the annual mean surface radiative forcing due to BC in snow (0.42 W m−2) exceeds the BC dimming effect at the surface (−0.3 W m−2). The annual mean BC-in-snow forcing is even higher over the northwest plateau (Fig. 8b1) and Himalayas (Fig. 8c1), and far exceeds the other forcings in the same subregions, although the BC-in-snow effect may be overestimated due to the potential positive bias in snow cover fraction in our simulation (Fig. 3). The annual mean BC surface dimming exceeds the BC-in-snow effect in the southeast (Fig. 8d1), central (Fig. 8e1), and northeast plateau (Fig. 8f1). The minima of all BC-related forcings appear in the central plateau, where the BC burden and deposition are the lowest among all the subregions (Fig. 5), and the SCF is very small (Fig. 3).
We have also calculated an approximate source attribution for the BC-in-snow radiative forcing over the HTP and its subregions, using the tagged-source BC deposition, which is
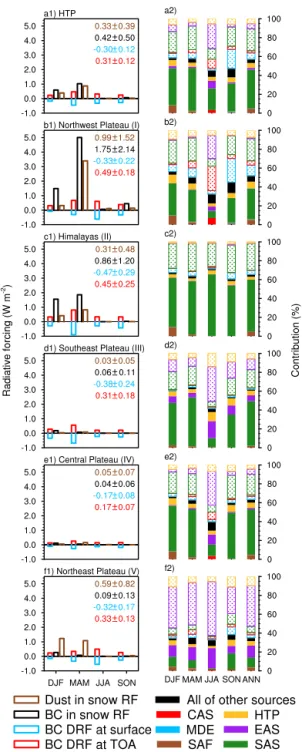
Figure 8. Seasonal mean radiative forcing (left column) induced by
the various BC effects (indicated by the color legend at the bottom) and dust-in-snow effect over (a1) the HTP, (b1) northwest plateau,
(c1) Himalayas, (d1) southeast plateau, (e1) central plateau, and (f1) northeast plateau. The corresponding annual mean forcings and
simply assumed to be linearly proportional to BC-in-snow radiative forcing. The SCF is taken into account in the calcu-lation (i.e., the deposition at each model grid is multiplied by SCF when calculating the area-average deposition). Overall, despite small quantitative differences, the source contribu-tions to BC-in-snow forcing are similar to those for BC de-position (Fig. 6). The SAS BB emissions contribute the most to annual mean forcing over the HTP and subregions except for the northeast plateau, for which the contribution is mostly by EAS FF emissions. During the winter and spring seasons over the northwest plateau and Himalayas, when and where the forcing is the largest, SAS (especially the BB sector) is the major contributor.
Dust is a major contributor to the total aerosol burden over the HTP (e.g., Zhang et al., 2001). Although we do not focus on other snow impurities such as mineral dust, it is worth not-ing that dust-in-snow radiative forcnot-ing has been considered in our model simulation, and it could be an important forcing agent. We also plotted dust-in-snow forcing over the HTP and subregions in Fig. 8 (along with the BC-induced forc-ings). The annual mean dust-in-snow forcing (0.33 W m−2) is comparable to all of the other forcings over the HTP, es-pecially in the springtime, when dust outbreaks occur and can be transported to the HTP from the surrounding sources such as the Taklimakan and Gobi deserts (Liu et al., 2008). The annual mean dust-in-snow forcing is as large as 0.99 and 0.59 W m−2in the northwest and northeast plateau, re-spectively (Fig. 8b1 and f1), which is in close proximity to the Taklimakan Desert (Huang et al., 2007; Chen et al., 2013), but negligibly small in the southeast plateau and cen-tral plateau. In the winter, the dominant dust-in-snow effect over the northeast plateau is consistent with the recent ob-servations. Huang et al. (2011), X. Wang et al. (2013) and Zhang et al. (2013) found that insoluble light-absorbing par-ticles in snow are dominated by local soil and desert dust in the Qilian Mountains (northeast plateau).
Both snow cover fraction (SCF) and mass concentration of snow impurities affect the calculation of radiative forcing in snow. We have evaluated the model estimation of SCF in different seasons (Fig. 3). We have also compared BC con-centration and deposition flux from our model results to a recent modeling study by Ménégoz et al. (2014) and to ob-servations in the HTP (Ginot et al., 2014) (Table S3). Bond et al. (2013) pointed out that observations of BC in snow pits or ice cores mostly involve snow/ice samples obtained in the summer and early fall, when almost all grid boxes the sam-ple sites located in are snow free in the HTP. They also in-dicated that the CAM3 global climate model (Flanner et al., 2009) may be overestimating snow BC concentrations in the HTP, especially in the spring. Our comparison shows that de-spite a smaller bias than in Ménégoz et al. (2014) the CAM5 model still largely overestimates BC concentrations in snow but underestimates dust concentrations in snow over the HTP. Ménégoz et al. (2014) provided a few possible reasons for the differences between model simulations and observations.
Factors such as measurement uncertainties (due to sample treatment and analysis methodology), temporal (interannual and seasonal), and spatial variations in BC deposition, and vertical variations in BC in snowpack, can strongly affect the accuracy and representativeness of BC-in-snow measure-ments for the purpose of evaluating global models. Ming et al. (2013) and Qian et al. (2015) pointed out that BC concen-trations in snow and ice samples over the HTP tend to de-crease with increasing glacier elevations, while global mod-els with coarse grid resolution cannot accurately represent elevation of sampling sites. Often times the difference is sig-nificant. Nonetheless, it is likely that positive biases exist in the modeled concentration and radiative forcing of BC and dust in snow.
6 Summary and conclusions
In this study, we employed the CAM5 model with a newly developed source-tagging technique, nudged towards the MERRA meteorological reanalysis, to characterize the fate of BC particles emitted from various geographical regions and sectors to the HTP region. In addition, we compare the radiative forcing induced by BC in the atmosphere and in snow over the HTP, as well as forcing induced by dust in snow. Although there are biases in the simulated BC, partly due to the inherent difficulty for coarse-resolution global models to accurately represent transport and wet deposition in this topographically complex region, the CAM5 model simulation shows a reasonable agreement in the seasonal variation in the near-surface airborne BC concentrations with observations over the HTP and surrounding regions. This provides us the confidence to use this modeling framework to characterize BC source–receptor relationships in the HTP. Using very different approaches, Kopacz et al. (2011), Lu et al. (2012), and the present study all show that South Asia and East Asia are the main source regions for BC transported to the HTP, while the magnitude of contributions from each of the source regions varies with season and receptor loca-tion. Although all of the three studies can provide quantita-tive source attributions, a quantitaquantita-tive intercomparison of the findings is quite difficult, given the differences in the defi-nition of geographical source and receptor regions, emission inventories, time periods for model simulation, and analysis methods. Nevertheless, in addition to quantifying the con-tributions of source regions, our direct source-tagging ap-proach allows us to further break down regional contribu-tions by sectors (i.e., fossil fuel vs. biomass and biofuel) and to characterize the transport pathways of individual re-gional/sectoral emissions.
emis-sion inventories, the annual mean BC column burden and surface deposition in the entire HTP region is contributed the most by biomass and biofuel (BB) emissions from South Asia (SAS) (33 and 40 %, respectively), followed by fossil fuel (FF) emissions from SAS (17 and 20 %, respectively) and then the FF from East Asia (EAS) (14 and 14 %, respec-tively). The same roles hold for all the seasonal means except for the summer, when the EAS FF becomes more important. Although BC emissions from the entire EAS source region are much stronger than those from SAS, the concentrated FF BC emissions in central-eastern China are only transported towards the HTP during the East Asian summer monsoon. Thus seasonal prevailing winds are important in determining the seasonal variations in BC transport and source–receptor relationships.
Both the annual and seasonal mean BC properties and their source–receptor relationships vary significantly with location in the HTP. For the multiple finer receptor regions of inter-est, SAS BB and FF have the largest impact on BC in the Himalayas and central plateau, while EAS FF and BB con-tribute the most to northeast plateau in all seasons and south-east plateau in the summer. The Central Asia (CAS) and Mid-dle East (MDE) FF emissions make important contributions to BC over the northwest plateau, especially from CAS in JJA.
The HTP BC is most sensitive by far to per unit changes in the local emissions, although they only contribute about 10 % to the BC burden in the HTP. The SAS region makes large contributions to BC burden and deposition over the HTP, and the BC sensitivities to SAS emissions are also high for al-most all of the subregions of HTP, especially the Himalayas. BC over the northeast plateau is quite sensitive to EAS emis-sions in all seasons, and southeast plateau BC is also sensi-tive to EAS emissions in JJA. Although BC emissions from MDE and CAS are weak and their contributions to the HTP overall are low, their efficiencies are quite high. BC over the northwest and central plateau is extremely sensitive to emis-sions from CAS in JJA. These source–receptor relationships and sensitivities can be useful to policymakers for improving the effective mitigation road map in order to potentially slow down the glacier retreat in the HTP region.
The impact of BC on snow and glacier melting can be characterized by the magnitude of radiative forcing. Our calculations show that the annual mean BC-in-snow radia-tive forcing (0.42 W m−2) outweighs the BC dimming effect (−0.3 W m−2) at the surface over the HTP. In the five sub-regions, the annual mean BC-in-snow forcing ranges from 0.04 W m−2 in the central plateau to 1.75 W m−2 in the northwest plateau. We also showed that the annual mean dust-in-snow radiative forcing over the HTP can be quite sig-nificant (0.33 W m−2for the entire HTP, and 0.99 W m−2for the northwest plateau). More importantly, both BC- and dust-in-snow forcing peaks in the spring melting season, when the area-average forcing reaches 1.03 and 0.87 W m−2, re-spectively, over the entire HTP, and their combined forcing
is more than 8 W m−2 over the northwest plateau. Such a large forcing is sufficient to cause earlier snow melting and contribute to the acceleration of glacier retreat, although the model is likely to overestimate BC-in-snow forcing due to the possible positive bias of snow cover fraction in the win-ter and early spring. According to our estimates of the source attribution, the biomass burning and biofuel emissions in South Asia contribute the most to annual mean forcing over the HTP and its subregions except for the northeast plateau, where the largest contribution is from East Asia fossil fuel emissions. During the winter and spring seasons over the northwest plateau and Himalayas, when and where the forc-ing is the largest, South Asia (especially the biomass burnforc-ing and biofuel sector) is the major contributor.
The Supplement related to this article is available online at doi:10.5194/acp-15-6205-2015-supplement.
Acknowledgements. This research is based on work supported by the U.S. Department of Energy (DOE), Office of Science, Biological and Environmental Research as part of the Earth System Modeling Program. The Pacific Northwest National Laboratory (PNNL) is operated for DOE by Battelle Memorial Institute under contract DE-AC05-76RLO1830. The CESM project is supported by the National Science Foundation and the DOE Office of Science. R. Zhang acknowledges support from the China Scholarship Fund. J. Huang and Q. Fu acknowledge support from the National Basic Research Program of China (2012CB955303), NSFC grant 41275070, and the China 111 project (no. B13045). Computational resources were provided by the National Energy Research Scien-tific Computing Center (NERSC), a national scienScien-tific user facility located at Lawrence Berkeley National Laboratory in Berkeley, California. NERSC is the flagship scientific computing facility for the Office of Science of DOE.
Edited by: X. Xu
References
Bonasoni, P., Laj, P., Marinoni, A., Sprenger, M., Angelini, F., Ar-duini, J., Bonafè, U., Calzolari, F., Colombo, T., Decesari, S., Di Biagio, C., di Sarra, A. G., Evangelisti, F., Duchi, R., Facchini, MC., Fuzzi, S., Gobbi, G. P., Maione, M., Panday, A., Roccato, F., Sellegri, K., Venzac, H., Verza, G. P., Villani, P., Vuillermoz, E., and Cristofanelli, P.: Atmospheric Brown Clouds in the Hi-malayas: first two years of continuous observations at the Nepal Climate Observatory-Pyramid (5079 m), Atmos. Chem. Phys., 10, 7515–7531, doi:10.5194/acp-10-7515-2010, 2010.
Bond, T. C., Bhardwaj, E., Dong, R., Jogani, R., Jung, S., Ro-den, C., Streets, D. G., and Trautmann, N. M.: Historical emis-sions of black and organic carbon aerosol from energy-related combustion, 1850–2000, Global Biogeochem. Cy., 21, GB2018, doi:10.1029/2006GB002840, 2007.
Bond, T. C., Doherty, S. J., Fahey, D. W., Forster, P. M., Berntsen, T., DeAngelo, B. J., Flanner, M. G., Ghan, S., Kärcher, B., Koch, D., Kinne, S., Kondo, Y., Quinn, P. K., Sarofim, M. C., Schultz, M. G., Schulz, M., Venkataraman, C., Zhang, H., Zhang, S., Bellouin, N., Guttikunda, S. K., Hopke, P. K., Jacobson, M. Z., Kaiser, J. W., Klimont, Z., Lohmann, U., Schwarz, J. P., Shindell, D., Storelvmo, T., Warren, S. G., and Zender, C. S.: Bounding the role of black carbon in the climate system: A sci-entific assessment, J. Geophys. Res.-Atmos., 118, 5380–5552, doi:10.1002/jgrd.50171, 2013.
Cao, J. J., Xu, B. Q., He, J. Q., Liu, X. Q., Han, Y. M., Wang, G. H., and Zhu, C. S.: Concentrations, seasonal variations, and transport of carbonaceous aerosol at a remote Mountain-ous region in western China, Atmos. Environ., 43, 4444–4452, doi:10.1016/j.atmosenv.2009.06.023, 2009.
Chen, S., Huang, J., Zhao, C., Qian, Y., Leung, L. R., and Yang, B.: Modeling the Transport and Radiative Forcing of Taklimakan Dust over the Tibetan Plateau in Summer, J. Geophys. Res., 118, 797–812, doi:10.1002/jgrd.50122, 2013.
Conway, H., Gades, A., and Raymond, C. F.: Albedo of dirty snow during conditions of melt, Water Resour. Res., 32, 1713–1718, doi:10.1029/96WR00712, 1996.
Dentener, F., Kinne, S., Bond, T., Boucher, O., Cofala, J., Generoso, S., Ginoux, P., Gong, S., Hoelzemann, J. J., Ito, A., Marelli, L., Penner, J. E., Putaud, J.-P., Textor, C., Schulz, M., van der Werf, G. R., and Wilson, J.: Emissions of primary aerosol and precur-sor gases in the years 2000 and 1750 prescribed data-sets for Ae-roCom, Atmos. Chem. Phys., 6, 4321–4344, doi:10.5194/acp-6-4321-2006, 2006.
Doherty, S. J., Dang, C., Hegg, D. A., Zhang, R., and Warren, S. G.: Black carbon and other light-absorbing particles in snow of central North America, J. Geophys. Res.-Atmos., 119, 12807– 12831, doi:10.1002/2014JD022350, 2014.
Duan, A. M. and Wu, G. X.: Weakening trend in the at-mospheric heat source over the Tibetan Plateau during re-cent decades. Part I: Observations, J. Clim., 21, 3149–3164, doi:10.1175/2007JCLI1912.1, 2008.
Duan, A., Wu, G., Zhang, Q., and Liu, Y.: New proofs of the recent climate warming over the Tibetan Plateau as a result of the in-creasing greenhouse gases emissions, Chin. Sci. Bull., 51, 1396– 1400, doi:10.1007/s11434-006-1396-6, 2006.
Flanner, M. G., Zender, C. S., Randerson, J. T., and Rasch, P. J.: Present day climate forcing and response from black carbon in snow, J. Geophys. Res., 112, D11202, doi:10.1029/2006JD008003, 2007.
Flanner, M. G., Zender, C. S., Hess, P. G., Mahowald, N. M., Painter, T. H., Ramanathan, V., and Rasch, P. J.: Springtime warming and reduced snow cover from carbonaceous particles, Atmos. Chem. Phys., 9, 2481–2497, doi:10.5194/acp-9-2481-2009, 2009.
Gettelman, A., Liu, X., Ghan, S. J., Morrison, H., Park, S., Con-ley, A. J., Klein, S. A., Boyle, J., Mitchell, D. L., and Li, J. L. F.: Global simulations of ice nucleation and ice su-persaturation with an improved cloud scheme in the Com-munity Atmosphere Model, J. Geophys. Res., 115, D18216, doi:10.1029/2009jd013797, 2010.
Ginot, P., Dumont, M., Lim, S., Patris, N., Taupin, J.-D., Wagnon, P., Gilbert, A., Arnaud, Y., Marinoni, A., Bonasoni, P., and Laj, P.: A 10 year record of black carbon and dust from a Mera Peak ice core (Nepal): variability and potential impact on melting of Himalayan glaciers, The Cryosphere, 8, 1479–1496, doi:10.5194/tc-8-1479-2014, 2014.
Hadley, O. L. and Kirchstetter, T. W.: Black-carbon reduction of snow albedo, Nat. Clim. Change, 2, 437–440, 2012.
Hall, A. and Qu, X.: Using the current seasonal cycle to constrain snow albedo feedback in future climate change, Geophys. Res. Lett., 33, L03502, doi:10.1029/2005GL025127, 2006.
Hall, D. K., Riggs G. A., and Salomonson V. V.: updated monthly. MODIS/TERRA Snow Cover Monthly L3 Global 0.05Deg CMG V005, [2001], Boulder, CO, National Snow and Ice Data Center. Digital Media, distributed in netCDF format by the Integrated Climate Data Center (ICDC, available at: http://icdc.zmaw.de, last access: 26 December 2014, University of Hamburg, Ham-burg, Germany), 2006.
Hansen, J. and Nazarenko, L.: Soot climate forcing via snow and ice albedos, P. Natl. Acad. Sci. USA, 101, 423–428, doi:10.1073/pnas.2237157100, 2004.
Hansen, J., Sato, M., Ruedy, R., Nazarenko, L., Lacis, A., Schmidt, G. A., Russell, G., Aleinov, I., Bauer, M., Bauer, S., Bell, N., Cairns, B., Canuto, V., Chandler, M., Cheng, Y., Del Genio, A., Faluvegi, G., Fleming, E., Friend, A., Hall, T., Jackman, C., Kel-ley, M., Kiang, N., Koch, D., Lean, J., Lerner, J., Lo, K., Menon, S., Miller, R., Minnis, P., Novakov, T., Oinas, V., Perlwitz, Ja., Perlwitz, Ju., Rind, D., Romanou, A., Shindell, D., Stone, P., Sun, S., Tausnev, N., Thresher, D., Wielicki, B., Wong, T., Yao, M., and Zhang, S.: Efficacy of climate forcings, J. Geophys. Res., 110, D18104, doi:10.1029/2005JD005776, 2005.
Huang, J., Minnis, P., Yi, Y., Tang, Q., Wang, X., Hu, Y., Liu, Z., Ayers, K., Trepte, C., and Winker, D.: Summer dust aerosols de-tected from CALIPSO over the Tibetan Plateau, Geophys. Res. Lett., 34, L18805, doi:10.1029/2007GL029938, 2007.
Huang, J., Fu, Q., Zhang, W., Wang, X., Zhang, R., Ye, H., and Warren, S. G.: Dust and black carbon in seasonal snow across Northern China, B. Am. Meteorol. Soc., 92, 175–181, doi:10.1175/2010BAMS3064.1, 2011.
Immerzeel, W., VanBeek L. P. H., and Bierkens, M. F. P.: Climate Change Will Affect the Asian Water Towers, Science, 328, 1382– 1385, doi:10.1126/science.1183188, 2010.
Jacobson, M. Z.: Climate response of fossil fuel and bio-fuel soot, accounting for soot’s feedback to snow and sea ice albedo and emissivity, J. Geophys. Res., 109, D21201, doi:10.1029/2004JD004945, 2004.
Jiao, C., Flanner, M. G., Balkanski, Y., Bauer, S. E., Bellouin, N., Berntsen, T. K., Bian, H., Carslaw, K. S., Chin, M., De Luca, N., Diehl, T., Ghan, S. J., Iversen, T., Kirkevåg, A., Koch, D., Liu, X., Mann, G. W., Penner, J. E., Pitari, G., Schulz, M., Seland, Ø., Skeie, R. B., Steenrod, S. D., Stier, P., Takemura, T., Tsigaridis, K., van Noije, T., Yun, Y., and Zhang, K.: An AeroCom assess-ment of black carbon in Arctic snow and sea ice, Atmos. Chem. Phys., 14, 2399–2417, doi:10.5194/acp-14-2399-2014, 2014. Kang, S., Wake, C., Qin, D., Mayewski, P. A., and Yao, T.: Monsoon
and dust signals recorded in Dasuopu glacier, Tibetan Plateau, J. Glaciol., 46, 222–226, 2000.
Kang, S., Wei, X., You, Q., Flugel, W., Pepin, N., and Yao, T.: Review of climate and cryospheric change in the Ti-betan Plateau, Environ. Res. Lett., 5, 015101, doi:10.1088/1748-9326/5/1/015101, 2010.
Kaser, G., Grosshauser, M., and Marzeion, B.: Contribu-tion of glaciers to water availability in different climate regimes, P. Natl. Acad. Sci. USA, 107, 20223–20227, doi:10.1073/pnas.1008162107, 2010
Kaspari, S. D., Schwikowski, M., Gysel, M., Flanner, M. G., Kang, S., Hou, S., and Mayewski, P. A.: Resent increase in black carbon concentrations from a Mt. Everest ice core spanning 1860–2000 AD, Geophys. Res. Lett., 38, L04703, doi:10.1029/2010GL046096, 2011.
Kopacz, M., Mauzerall, D. L., Wang, J., Leibensperger, E. M., Henze, D. K., and Singh, K.: Origin and radiative forcing of black carbon transported to the Himalayas and Tibetan Plateau, Atmos. Chem. Phys., 11, 2837–2852, doi:10.5194/acp-11-2837-2011, 2011.
Lamarque, J.-F., Bond, T. C., Eyring, V., Granier, C., Heil, A., Klimont, Z., Lee, D., Liousse, C., Mieville, A., Owen, B., Schultz, M. G., Shindell, D., Smith, S. J., Stehfest, E., Van Aar-denne, J., Cooper, O. R., Kainuma, M., Mahowald, N., Mc-Connell, J. R., Naik, V., Riahi, K., and van Vuuren, D. P.: His-torical (1850–2000) gridded anthropogenic and biomass burning emissions of reactive gases and aerosols: methodology and ap-plication, Atmos. Chem. Phys., 10, 7017–7039, doi:10.5194/acp-10-7017-2010, 2010.
Lamarque, J.-F., Emmons, L. K., Hess, P. G., Kinnison, D. E., Tilmes, S., Vitt, F., Heald, C. L., Holland, E. A., Lauritzen, P. H., Neu, J., Orlando, J. J., Rasch, P. J., and Tyndall, G. K.: CAM-chem: description and evaluation of interactive at-mospheric chemistry in the Community Earth System Model, Geosci. Model Dev., 5, 369–411, doi:10.5194/gmd-5-369-2012, 2012.
Lau, K. M., Kim, M. K., and Kim, K. M.: Asian monsoon anomalies induced by aerosol direct forcing: the role of the Tibetan Plateau, Clim. Dyn., 26, 855–664, 2006.
Lau, K.-M., Kim, M. K., Kim, K.-M., and Lee, W. S.: Enhanced surface warming and accelerated snow melt in the Himalayas and Tibetan Plateau induced by absorbing aerosols, Environ. Res. Lett., 5, 025204, doi:10.1088/1748-9326/5/2/025204, 2010.
Lee, Y. H., Lamarque, J.-F., Flanner, M. G., Jiao, C., Shindell, D. T., Berntsen, T., Bisiaux, M. M., Cao, J., Collins, W. J., Cur-ran, M., Edwards, R., Faluvegi, G., Ghan, S., Horowitz, L. W., McConnell, J. R., Ming, J., Myhre, G., Nagashima, T., Naik, V., Rumbold, S. T., Skeie, R. B., Sudo, K., Takemura, T., Thevenon, F., Xu, B., and Yoon, J.-H.: Evaluation of preindustrial to present-day black carbon and its albedo forcing from Atmospheric Chemistry and Climate Model Intercomparison Project (AC-CMIP), Atmos. Chem. Phys., 13, 2607–2634, doi:10.5194/acp-13-2607-2013, 2013.
Li, X., Cheng, G., Jin, H., Kang, E., Che, T., Jin, R., Wu, L., Nan, Z., Wang, J., and Shen, Y.: Cryospheric change in China, Global Planet. Change, 62, 210–218, 2008.
Liu, X., Easter, R. C., Ghan, S. J., Zaveri, R., Rasch, P., Shi, X., Lamarque, J.-F., Gettelman, A., Morrison, H., Vitt, F., Conley, A., Park, S., Neale, R., Hannay, C., Ekman, A. M. L., Hess, P., Mahowald, N., Collins, W., Iacono, M. J., Bretherton, C. S., Flan-ner, M. G., and Mitchell, D.: Toward a minimal representation of aerosols in climate models: description and evaluation in the Community Atmosphere Model CAM5, Geosci. Model Dev., 5, 709–739, doi:10.5194/gmd-5-709-2012, 2012.
Liu, Z., Liu, D., Huang, J., Vaughan, M., Uno, I., Sugimoto, N., Kit-taka, C., Trepte, C., Wang, Z., Hostetler, C., and Winker, D.: Air-borne dust distributions over the Tibetan Plateau and surround-ing areas derived from the first year of CALIPSO lidar obser-vations, Atmos. Chem. Phys., 8, 5045–5060, doi:10.5194/acp-8-5045-2008, 2008.
Lu, Z., Streets, D. G., Zhang, Q., and Wang, S.: A novel back-trajectory analysis of the origin of black carbon transported to the Himalayas and Tibetan Plateau during 1996–2010, Geophys. Res. Lett., 39, L01809, doi:10.1029/2011GL049903, 2012. Ma, P.-L., Rasch, P. J., Wang, H., Zhang, K., Easter, R. C., Tilmes,
S., Fast, J. D., Liu, X., Yoon, J.-H., and Lamarque, J.-F.: The role of circulation features on black carbon transport into the Arc-tic in the Community Atmosphere Model Version 5 (CAM5), J. Geophys. Res.-Atmos., 118, 4657–4669, 2013.
Manabe, S. and Terpstra, T. B.: The effects of mountains on the general circulation of the atmosphere as identified by numerical experiments, J. Atmos. Sci., 31, 3–42, 1974.
Marinoni, A., Cristofanelli, P., Laj, P., Duchi, R., Calzolari, F., Decesari, S., Sellegri, K., Vuillermoz, E., Verza, G. P., Villani, P., and Bonasoni, P.: Aerosol mass and black carbon concentrations, a two year record at NCO-P (5079 m, Southern Himalayas), At-mos. Chem. Phys., 10, 8551–8562, doi:10.5194/acp-10-8551-2010, 2010.
Marinoni, A., Cristofanelli, P., Laj, P., Duchi, R., Putero, D., Calzo-lari, F., Landi, T. C., Vuillermoz, E., Maione, M., and Bonasoni, P.: High black carbon and ozone concentrations during pollution transport in the Himalayas: Five years of continuous observations at NCO-P global GAW station, J. Environ. Sci., 25, 1618–1625, doi:10.1016/S1001-0742(12)60242-3, 2013.
Ménégoz, M., Krinner, G., Balkanski, Y., Boucher, O., Cozic, A., Lim, S., Ginot, P., Laj, P., Gallée, H., Wagnon, P., Marinoni, A., and Jacobi, H. W.: Snow cover sensitivity to black carbon depo-sition in the Himalayas: from atmospheric and ice core measure-ments to regional climate simulations, Atmos. Chem. Phys., 14, 4237–4249, doi:10.5194/acp-14-4237-2014, 2014.