ACPD
10, 15485–15536, 2010West African TTL chemical composition: air
mass origins
K. S. Law et al.
Title Page
Abstract Introduction
Conclusions References
Tables Figures
◭ ◮
◭ ◮
Back Close
Full Screen / Esc
Printer-friendly Version Interactive Discussion
Discussion
P
a
per
|
Dis
cussion
P
a
per
|
Discussion
P
a
per
|
Discussio
n
P
a
per
|
Atmos. Chem. Phys. Discuss., 10, 15485–15536, 2010 www.atmos-chem-phys-discuss.net/10/15485/2010/ doi:10.5194/acpd-10-15485-2010
© Author(s) 2010. CC Attribution 3.0 License.
Atmospheric Chemistry and Physics Discussions
This discussion paper is/has been under review for the journal Atmospheric Chemistry and Physics (ACP). Please refer to the corresponding final paper in ACP if available.
Air mass origins influencing TTL
chemical composition over West Africa
during 2006 summer monsoon
K. S. Law1, F. Fierli2, F. Cairo2, H. Schlager3, S. Borrmann4,5, M. Streibel6, E. Real7, D. Kunkel4, C. Schiller8, F. Ravegnani2, A. Ulanovsky9, F. d’Amato10, S. Viciani10, and C. M. Volk11
1
UPMC Univ. Paris 06, Universit ´e Versailles St-Quentin, CNRS/INSU, UMR 8190, LATMOS-IPSL, Paris, France
2
Istituto di Scienze dell’Atmosfera e del Clima, Consiglio Nazionale delle Ricerche (ISAC–CNR), Italy
3
DLR Institut f ¨ur Physik der Atmosph ¨are, Oberpfaffenhofen, Germany
4
Institute of Atmospheric Physics, Univ. Mainz, Germany
5
Max-Planck Institute for Chemistry, Particle Chemistry Department, Mainz, Germany
6
European Ozone Research Coordinating Unit, Univ. Cambridge, UK
7
ACPD
10, 15485–15536, 2010West African TTL chemical composition: air
mass origins
K. S. Law et al.
Title Page
Abstract Introduction
Conclusions References
Tables Figures
◭ ◮
◭ ◮
Back Close
Full Screen / Esc
Printer-friendly Version Interactive Discussion
Discussion
P
a
per
|
Dis
cussion
P
a
per
|
Discussion
P
a
per
|
Discussio
n
P
a
per
|
8
ICG-1, Forschungszentrum J ¨ulich, Germany
9
Central Aerological Observatory, Moscow, Russia
10
Consiglio Nazionale delle Ricerche-Istituto Nazionale di Ottica (CNR-INO), Firenze, Italy
11
Wuppertal University, Wuppertal, Germany
ACPD
10, 15485–15536, 2010West African TTL chemical composition: air
mass origins
K. S. Law et al.
Title Page
Abstract Introduction
Conclusions References
Tables Figures
◭ ◮
◭ ◮
Back Close
Full Screen / Esc
Printer-friendly Version Interactive Discussion
Discussion
P
a
per
|
Dis
cussion
P
a
per
|
Discussion
P
a
per
|
Discussio
n
P
a
per
|
Abstract
Trace gas and aerosol data collected in the tropical tropopause layer (TTL) between 12–18.5 km by the M55 Geophysica aircraft as part of the SCOUT-AMMA campaign over West Africa during the summer monsoon in August 2006 have been analysed in terms of their air mass origins. Analysis of domain filling back trajectories arriving over 5
West Africa, and in the specific region of the flights, showed that the M55 flights were generally representative of air masses arriving over West Africa during the first 2 weeks of August, 2006. Air originating from the mid-latitude lower stratosphere was under-sampled (in the mid-upper TTL) whilst air masses uplifted from central Africa (into the lower TTL) were over-sampled in the latter part of the campaign. Signatures of recent 10
(previous 10 days) origins were superimposed on the large-scale westerly flow over West Africa. In the lower TTL, air masses were impacted by recent local deep convec-tion over Africa at the level of main convective outflow (350 K, 200 hPa) and on certain days up to 370 K (100 hPa). Estimates of the fraction of air masses influenced by local convection vary from 10 to 50% depending on the method applied and from day to day 15
during the campaign. The analysis shows that flights on 7, 8 and 11 August were more influenced by local convection than on 4 and 13 August allowing separation of trace gas and aerosol measurements into “convective” and “non-convective” flights. Strong signatures, particularly in short-lived species like CO, NO and fine-mode aerosols were seen during flights most influenced by convection up to 350–365 K. Observed profiles 20
were also constantly perturbed by uplift (as high as 39%) of air masses from the mid to lower troposphere over Asia, India, and oceanic regions resulting in import of clean oceanic (e.g., O3-poor) or polluted air masses from Asia (high O3, CO, CO2) into West Africa. Thus, recent uplift of CO2 over Asia may contribute to the observed positive CO2gradients in the TTL over West Africa. This suggests a more significant fraction of 25
ACPD
10, 15485–15536, 2010West African TTL chemical composition: air
mass origins
K. S. Law et al.
Title Page
Abstract Introduction
Conclusions References
Tables Figures
◭ ◮
◭ ◮
Back Close
Full Screen / Esc
Printer-friendly Version Interactive Discussion
Discussion
P
a
per
|
Dis
cussion
P
a
per
|
Discussion
P
a
per
|
Discussio
n
P
a
per
|
importing air masses with high O3 and NOy. Ozone profiles show a less pronounced lower TTL minimum than observed previously by regular ozonesondes at other tropical locations. Concentrations are less than 100 ppbv in the lower TTL and vertical gradi-ents less steep than in the upper TTL. The air mass origin analysis and simulations of in-situ net photochemical O3 production, initialised with observations, suggest that 5
the lower TTL is significantly impacted by uplift of O3precursors (over Africa and Asia) leading to positive production rates (up to 2 ppbv per day) in the lower and mid TTL even at moderate NOxlevels. Photochemical O3production increases with higher NOx and H2O in air masses with O3less than 150 ppbv.
1 Introduction
10
Understanding the processes that govern the chemical composition, microphysics and transport in the tropical upper troposphere (UT) and lower stratosphere (LS) is impor-tant for the quantification of transport of trace gases and aerosols into the stratosphere, where they can impact stratospheric O3depletion and the stratospheric water budget. This region, designated the tropical tropopause layer (TTL), represents a transition 15
zone between the troposphere and stratosphere and has been defined in a number of different ways. A comprehensive review of the TTL was given by Fueglistaler et al. (2009) who, for stratospheric purposes, prefer to define the TTL as the region char-acterised by slow ascending motion driven by radiative heating and the large-scale Brewer-Dobson circulation extending from the region above main convective outflow 20
(neutral buoyancy) at 355 K (150 hPa, 14 km) up to 425 K (70 hPa, 18.5 km). This re-gion is bounded laterally by the position the sub-tropical jets (STJs) which limits merid-ional transport in the lower part of the TTL but not in the upper TTL (e.g., see Volk et al., 2000). Other definitions (e.g., Gettelman et al., 2004) have fixed the lower bound-ary at the level of main deep convective outflow (350 K, 200 hPa, 12.5 km) although 25
ACPD
10, 15485–15536, 2010West African TTL chemical composition: air
mass origins
K. S. Law et al.
Title Page
Abstract Introduction
Conclusions References
Tables Figures
◭ ◮
◭ ◮
Back Close
Full Screen / Esc
Printer-friendly Version Interactive Discussion
Discussion
P
a
per
|
Dis
cussion
P
a
per
|
Discussion
P
a
per
|
Discussio
n
P
a
per
|
the composition of the air masses that enter the TTL, their residence time in the TTL before upward transport as well as processes that can change their concentrations (chemistry, microphysics, in-mixing from mid-latitudes). Quantification of processes influencing the chemical composition of the TTL is also important for climate since several trace gases, namely H2O, O3 and CO2, make significant contributions to the 5
Earth’s radiative budget at these altitudes. Tropospheric O3, which can be produced downwind from convective regions from lightning NOx or following uplift of ozone pre-cursors, governs the global oxidizing capacity and the lifetime of several greenhouse gases such as CH4, through the production of the hydroxyl radical (OH). Also, the TTL constitutes a major source of new particle formation probably contributing to the main-10
tenance of the global, stratospheric Junge aerosol layer (Brock et al., 1995; Borrmann et al., 2010).
In this paper, we present an analysis of air mass origins influencing chemical compo-sition of the TTL over West Africa based on aircraft data collected during the summer monsoon in 2006 as part of a joint AMMA (African Monsoon Multidisciplinary Analy-15
sis) and SCOUT-O3 (Stratospheric-Climate Links with Emphasis on the Upper Tropo-sphere and Lower StratoTropo-sphere) airborne campaign. We analyse flights made by the M55-Geophysica aircraft between 12 and 20 km during August 2006 as part of a multi-aircraft measurement deployment. The SCOUT-AMMA M55 multi-aircraft campaign is one of the first campaigns to take place in the Northern Hemisphere summer in a region 20
influenced by both the African and Asian monsoons. Previous tropical campaigns have taken place in other locations and other times of year and focused primarily on diagnos-ing contributions from local deep convection and advection of air from the mid-latitude lower stratosphere. These campaigns took place in Southern Hemisphere summer over Australia (Brunner et al., 2009) and Brazil (Pommereau et al., 2009; Huntrieser et 25
ACPD
10, 15485–15536, 2010West African TTL chemical composition: air
mass origins
K. S. Law et al.
Title Page
Abstract Introduction
Conclusions References
Tables Figures
◭ ◮
◭ ◮
Back Close
Full Screen / Esc
Printer-friendly Version Interactive Discussion
Discussion
P
a
per
|
Dis
cussion
P
a
per
|
Discussion
P
a
per
|
Discussio
n
P
a
per
|
advection of air masses from upwind regions, and b) by recent regional convective up-lift. Air masses advected into the TTL over West Africa may have been influenced by uplift from the lower troposphere over upwind regions (e.g., Asia), intrusion of air from the mid-latitude lower stratosphere or cross-hemispheric transport of air masses from the Southern Hemisphere.
5
The meteorological situation during the summer monsoon over West Africa is dis-cussed in Sect. 2. A brief description of the M55 campaign is given in Sect. 3. The fractions of air masses arriving from different upwind regions via large-scale transport are estimated based on back trajectory calculations to quantify the influence of diff er-ent origins (Sect. 4). Comparison of results calculated for a West African domain with 10
those calculated in the region or along M55 flight tracks allows the flights to be put into a broader context during August 2006. The influence of recent convective uplift over central and western Africa, diagnosed using coincidences between back trajectories and convective cloud tops is discussed in Sect. 5. Results are compared with results from mesoscale model simulations (Fierli et al., 2010). The results are used to divide 15
the M55 flights into those more or less influenced by recent convective uplift over Africa. The influence of large-scale transport and regional convective uplift on measured M55 trace gas and aerosol profiles is then discussed in Sect. 6. Conclusions are presented in Sect. 7.
2 Meteorological situation
20
A detailed discussion about the characteristics of the summer monsoon over West Africa and comparisons between 2006 and 1990–2005 can be found in Janicot et al. (2008). A description of the general meteorological situation during July and August 2006 in the upper troposphere and lower stratosphere (UTLS) including relation to the passage of convective systems is also given in Cairo et al. (2010). By way of a brief 25
ACPD
10, 15485–15536, 2010West African TTL chemical composition: air
mass origins
K. S. Law et al.
Title Page
Abstract Introduction
Conclusions References
Tables Figures
◭ ◮
◭ ◮
Back Close
Full Screen / Esc
Printer-friendly Version Interactive Discussion
Discussion
P
a
per
|
Dis
cussion
P
a
per
|
Discussion
P
a
per
|
Discussio
n
P
a
per
|
winds circulating round the southern Atlantic Santa Helena anticyclone which converge at the Inter-Tropical Convergence Zone (ITCZ) around 10◦N. During August 2006, the surface Inter-Tropical Front reached as far north as 12◦N. This convergence zone, and the presence of elevated terrain to the east, leads to the formation of large organized mesoscale convective systems (MCSs) which are modulated by the propagation of 5
African easterly waves tracking from east to west and the position and strength of the African easterly jet (AEJ): a mid-level thermal wind between 10–15◦N. In August 2006, convective activity and resulting precipitation were slightly enhanced compared to the 1990–2005 average (Janicot et al., 2008).
Trace gases and aerosols injected into the TTL are transported rapidly westward due 10
to the existence of the Tropical Easterly Jet (TEJ) at 200 hPa induced by upper level anticyclones related to the African and Asian monsoons. This can also lead to transport of lower stratospheric air into the TTL over the Himalayas (Gettleman and Forster, 2002). Whilst the TEJ has maximum speeds over the Indian Ocean it extends into West Africa in July and August with a core evident around 10–30◦W. The TEJ over West 15
Africa was stronger compared to the mean in August 2006 (Janicot et al., 2008). This westerly flow dominates the large-scale circulation but chemical composition over West Africa can also be influenced by more recent uplift into the TTL. As noted in Fuglistaler et al. (2009) and references therein, the propagation or breaking of waves such as planetary scale, quasi-stationary Rossby waves (to the west) or Kelvin waves (to the 20
east) can lead to transport of air from the stratosphere to the troposphere. Propagation of Kelvin waves can also modulate convection although Janicot et al. (2008) note that this activity was low in August 2006 over West Africa. Transport of air masses between the extra-tropical stratosphere and the tropics is also influenced by the phase of the Quasi-Biennial Oscillation (QBO). As discussed in Cairo et al. (2010), the QBO was in 25
ACPD
10, 15485–15536, 2010West African TTL chemical composition: air
mass origins
K. S. Law et al.
Title Page
Abstract Introduction
Conclusions References
Tables Figures
◭ ◮
◭ ◮
Back Close
Full Screen / Esc
Printer-friendly Version Interactive Discussion
Discussion
P
a
per
|
Dis
cussion
P
a
per
|
Discussion
P
a
per
|
Discussio
n
P
a
per
|
Africa estimated a contribution from in-mixing of aged extra-tropical air into the West African TTL varying between 10% at 350 K to 30% at 390 K (Homan et al., 2010).
Transport of pollutants into the upper troposphere over Asia by deep convection followed by westerly transport has been identified as a source of carbon monoxide over West Africa (Barret et al., 2008). Analysis of Microwave Limbs Sounder (MLS) data 5
and global model results showed an influence from this source above 150 hPa over West Africa with maximum concentrations around 25◦N. Convective uplift of moist air masses over the Bay of Bengal and China Sea followed by dehydration during transport towards North-west India (around the upper level anticyclone associated with the Asian monsoon) has also been used to explain the water vapour maximum observed in MLS 10
water vapour data at 100 hPa over the Himalayas (James et al., 2008). Analysis of water vapour data collected on the M55 during SCOUT-AMMA in August 2006 have been linked to this convective uplift followed by westerly transport leading to enhanced water vapour concentrations over West Africa (Schiller et al., 2009).
At lower altitudes in the upper troposphere (200 hPa), CO maxima were observed 15
further south in satellite and MOZAIC CO data during summer 2006, especially over central Africa with a maximum at the Equator. This has been explained by convective uplift of biomass burning pollutants (located south of the Equator at this time of year) and recirculation southwards by the large-scale Hadley circulation (e.g., Barret et al., 2008). Westerly transport of these emissions by the TEJ over southern West Africa 20
may also explain higher CO concentrations in the upper troposphere over this region. Mari et al. (2008) examined this cross-hemispheric transport in detail showing that it is episodic and dependant on the strength of lower and mid-tropospheric transport from central Africa into the Gulf of Guinea. During periods when this transport is less active (e.g. 3–9 August 2006), pollutants remain trapped over the continent before 25
ACPD
10, 15485–15536, 2010West African TTL chemical composition: air
mass origins
K. S. Law et al.
Title Page
Abstract Introduction
Conclusions References
Tables Figures
◭ ◮
◭ ◮
Back Close
Full Screen / Esc
Printer-friendly Version Interactive Discussion
Discussion
P
a
per
|
Dis
cussion
P
a
per
|
Discussion
P
a
per
|
Discussio
n
P
a
per
|
direct transport in the lower/mid-troposphere. Real et al. (2010) also found evidence for transport of biomass burning plumes into the lower TTL over West Africa (M55 flight on 13 August, 2006).
Deep convection over western and central Africa also plays an important role in influencing trace gas concentrations in the TTL. During the monsoon season, large 5
organized MCSs develop on a regular basis resulting in transport of air into the upper troposphere albeit with large-scale subsidence in surrounding regions at the level of convective outflow (around 200 hPa). Their impact on trace gas concentrations in the TTL is complex and will depend on where air masses were uplifted, on mixing with air in the upper troposphere, as well as on possible liquid and ice phase cloud pro-10
cessing. Convective systems are also a significant source of lightning NOxover West Africa (H ¨oller et al., 2009) which can lead to photochemical O3 production downwind (Sauvage et al., 2007a; Barret et al., 2010).
In summary, the chemical composition of the TTL over West Africa is influenced by transport of air masses into the region primarily from the east. Chemical composi-15
tion can also be influenced by additional inputs from the lower stratosphere, by cross-hemispheric transport of air masses from central Africa, or by local deep convection over Africa. The contribution of these different sources is examined in Sects. 4 and 5.
3 The M55 SCOUT-AMMA airborne campaign
The M55-Geophysica campaign, which took place from 1 to 16 August 2006, was part 20
of a larger AMMA chemistry and aerosol field intensive designed to characterize the processes influencing chemical composition over West Africa. The British BAe-146 (B146), French Falcon F-20 (FF-20) and ATR-42 were based in Niamey, Niger (13.5◦N
2.2◦E) and the M55 and DLR-Falcon (DF-20) were based in Ouagadougou, Burkina Faso (12.4◦N, −1.5 E). Details about the coordinated aircraft deployment and main
25
ACPD
10, 15485–15536, 2010West African TTL chemical composition: air
mass origins
K. S. Law et al.
Title Page
Abstract Introduction
Conclusions References
Tables Figures
◭ ◮
◭ ◮
Back Close
Full Screen / Esc
Printer-friendly Version Interactive Discussion
Discussion
P
a
per
|
Dis
cussion
P
a
per
|
Discussion
P
a
per
|
Discussio
n
P
a
per
|
local flights on 4, 7, 8, 11 and 13 August with transits to and from Ouagadougou on 1 and 16 August 2006. Measurements were made of a wide variety of trace gases includ-ing O3, CO, H2O, CO2, CH4, NO, NOy, N2O, as well as cloud and aerosol microphysics. A detailed description about the objectives of each flight, the aircraft payload, instru-ment accuracy as well as the main features observed along individual flights is given 5
in Cairo et al. (2010). A brief summary is given here of the measurements used in this study. Measurements of O3were made using FOZAN (Fast OZone ANalyser) (Yushkov et al., 1999), H2O using FISH (Fast In situ Stratospheric Hygrometer) (Schiller et al., 2009), CO2using HAGAR (High Altitude Gas AnalyzeR) (Volk et al., 2000; Homan et al., 2010), NO and NOy using SIOUX (see Voigt et al., 2008 and references therein), 10
CO using COLD (Cryogenically Operated Laser Diode) (Viciani et al., 2008), fine-mode aerosols using COPAS (COndensation PArticle counter Systems) (Borrmann et al., 2010), and back-scatter from aerosols by MAS (Multiwavelength Aerosol Scatterome-ter) (Adriani et al., 1999).
Figure 1 shows the M55 flight tracks over western Africa, colour-coded in terms of 15
potential temperature along the flights. The flights on 4 and 13 August, to the south coast of West Africa, were aimed at characterizing the large-scale chemical composi-tion. Possible transport of biomass burning emissions into the upper troposphere was also explored on 13 August (see Real et al. (2010) for detailed analysis). The flight on 7 August attempted to fly in the wake of an MSC over Mali whilst the flight on 11 20
August flew in the aged outflow of a large MCS. A CALIPSO validation flight on 8 Au-gust 2006 also encountered convective outflow. Fierli et al. (2010) discuss the impact of local deep convection in more detail (see Sect. 5). Analysis of M55 data collected over West Africa is also reported in several recent papers and includes comparisons with data collected in other recent tropical campaigns over Australia and Brazil (Schiller 25
et al., 2009; Homan et al., 2010; Borrmann et al., 2010). Results from this work are compared to results from these papers where appropriate.
ACPD
10, 15485–15536, 2010West African TTL chemical composition: air
mass origins
K. S. Law et al.
Title Page
Abstract Introduction
Conclusions References
Tables Figures
◭ ◮
◭ ◮
Back Close
Full Screen / Esc
Printer-friendly Version Interactive Discussion
Discussion
P
a
per
|
Dis
cussion
P
a
per
|
Discussion
P
a
per
|
Discussio
n
P
a
per
|
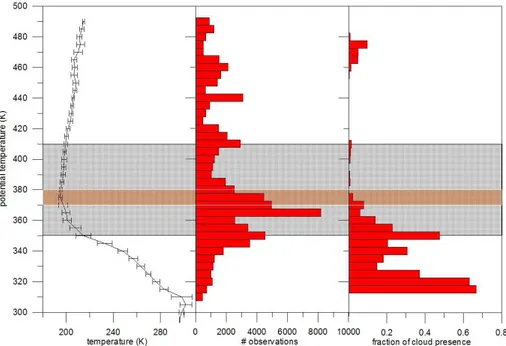
structure of the TTL over West Africa. Figure 2 (left panel) shows the average tem-perature profile as a function of potential temtem-perature acquired south of 17.5◦N. The
average cold point tropopause can clearly be seen at around 375 K although it varied by±5 K between different flights. Analysis of tropical radiosonde data showed similar
results during boreal summer (Fueglistaler et al., 2009). The total number of observa-5
tions at a given theta level (Fig. 2 central panel) shows that the lower TTL was the most heavily sampled during the campaign. The right panel shows the fraction of observa-tions in cloudy/hazy air masses derived from volume backscatter ratios greater than 1.2 measured with MAS (Adriani et al., 1999). There is a bimodal distribution with peaks at 320 K and 350 K representing main convective outflow altitudes. Above this level there 10
is a small percentage (around 0.01%) of cloud / haze observations up to about 410 K suggesting that tropospheric influence may not have extended much above this level during the campaign over West Africa although some evidence for convective over-shooting has been found (Khaykin et al., 2009). A thin aerosol layer was also observed in the LS at 475 K related to the presence of volcanic aerosols (Borrmann et al., 2010). 15
For the purposes of this analysis we use the following definitions: top of TTL at 410 K (70 hPa, 18.5 km) above which air is essentially stratospheric, the mid-TTL as the boundary between the upper and lower TTL at 370 K (100 hPa, 16.5 km) just below where the cold point tropopause is located, and the lower TTL between the mid-TTL and the lower boundary defined by the altitude of maximum of convective outflow at 20
350 K (200 hPa, 12.5 km). The layer above the altitude of maximum convective outflow (355 K, 150 hPa, 14 km) is also of interest.
4 Large-scale transport
In order to identify the impact of recent air mass origins on measured chemical com-position, 10 day reverse domain filling trajectories from a 0.5 degree grid covering 25
West Africa (10◦E to 40◦W; 5 to 25◦N) were calculated at 4 pressure levels from 1 to
ACPD
10, 15485–15536, 2010West African TTL chemical composition: air
mass origins
K. S. Law et al.
Title Page
Abstract Introduction
Conclusions References
Tables Figures
◭ ◮
◭ ◮
Back Close
Full Screen / Esc
Printer-friendly Version Interactive Discussion
Discussion
P
a
per
|
Dis
cussion
P
a
per
|
Discussion
P
a
per
|
Discussio
n
P
a
per
|
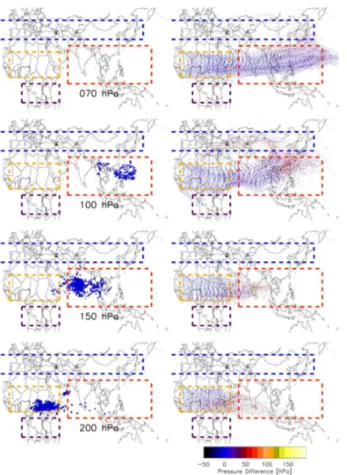
(not shown). These levels correspond to the main boundaries of interest listed in the previous section, i.e. 70, 100, 150 and 200 hPa. Trajectories were calculated using Eu-ropean centre for Medium Range Weather Forecast (ECMWF) analyses with 6-h time resolution producing an ensemble of 120 000 air parcels. As an example, Fig. 3 shows the points of back trajectories arriving at the 4 pressure levels on 7 August, 2006 at 5
12:00 UT (Universal Time) coloured by pressure difference with respect to the arrival point along each trajectory (blue isobaric, yellow ascent from the troposphere). The primary flow in the TTL is zonal and westerly but with important fractions of air coming from Asian mid-latitudes at 100 hPa and, to a lesser extent at 70 hPa. The Asian mon-soon region impacts 150 hPa while 200 hPa is sensitive to African convection. The left 10
panel shows where air masses were uplifted from below 400 hPa at the different levels. Similar results were found for the other days during the campaign.
The air parcel ensembles for each day of the campaign were used to define 4 main regions of recent (10 day) origin which might then superimpose particular chemical characteristics on the atmospheric composition in the large-scale westerly flow (see 15
dashed boxes in Fig. 3 and Table 1). The first two regions cover air masses arriving at all altitudes from Northern Hemisphere (NH) mid-latitudes (>35◦N) and Southern
Hemisphere (SH) central Africa. The third and fourth regions identify air masses ar-riving from the lower and mid troposphere (1000–400 hPa) over Asia and Africa. The results were used to estimate the fraction of air parcels having spent at least 6 h in 20
a given region over the previous 10 days before reaching the West African domain at the 4 prescribed pressure altitudes for each day of the campaign and are shown in Fig. 4. Results were also calculated for a sub-domain covering the region where the M55 flights took place (8◦E to 5◦W; 5 to 15◦N) (see Fig. 4b). The percentages expressed in Fig. 4 can be viewed as the fraction of air coming from regions other 25
than zonally isobaric flow in the TTL. It is not expected that this analysis identifies all possible origins nor are they mutually exclusive.
ACPD
10, 15485–15536, 2010West African TTL chemical composition: air
mass origins
K. S. Law et al.
Title Page
Abstract Introduction
Conclusions References
Tables Figures
◭ ◮
◭ ◮
Back Close
Full Screen / Esc
Printer-friendly Version Interactive Discussion
Discussion
P
a
per
|
Dis
cussion
P
a
per
|
Discussion
P
a
per
|
Discussio
n
P
a
per
|
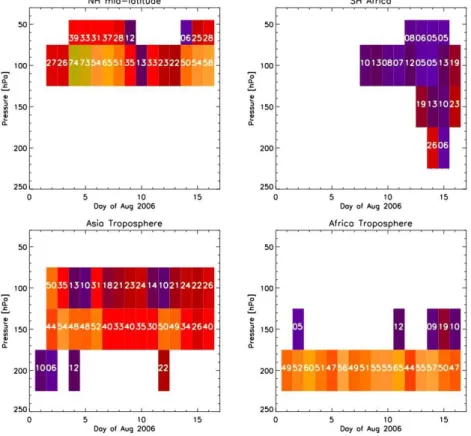
impact on altitudes in the mid and upper TTL over West Africa with a mean influence over 16 days of 41% and 15% at 100 hPa and 70 hPa, respectively. These air masses have been transported around the Tibetan High, especially at 100 hPa. However, there is significant daily variability, ranging from 13 to 73% at 100 hPa, for example. The average values at 100 hPa are in reasonable agreement with Konopka et al. (2009) 5
who estimated the fraction of air masses entering the TTL from the LS associated with the Asian summer monsoon upper level anticyclone. A significant fraction of air masses are also influenced by uplift of tropospheric air over Asia, especially at 150 hPa (39% on average) and 100 hPa (21% on average). Uplift of air masses over Africa (north of the Equator) has the most impact at 200 hPa (52% on average). In this analysis, 10
based on trajectories calculated using ECMWF analyses, uplift from below 400 hPa is considered. Further analysis (not shown) shows that most trajectories originate from the mid-troposphere. Whilst such trajectories are able to capture large-scale uplift they are likely to underestimate uplift associated local deep convection. In this case they may underestimate the number of convective events as well as vertical velocities and 15
the altitude to which convection has an impact (e.g., see Fierli et al., 2010). Therefore, the results presented in Fig. 4 may represent a lower limit. Air masses originating from SH central Africa (all altitudes) have their main influence in the latter half of the campaign period leading to a lower average influence (6%). Transport through this region is associated with southerly deviations in the position of the TEJ. Interestingly, at 20
the end of the campaign period, these air masses also influence 150 hPa and 200 hPa (up to 23%) related to the development of large MCSs over Chad/Sudan (Real et al., 2010).
We now address whether, and to what extent, the sampling of the M55 was repre-sentative of the air masses arriving over West Africa during the campaign. The fraction 25
ACPD
10, 15485–15536, 2010West African TTL chemical composition: air
mass origins
K. S. Law et al.
Title Page
Abstract Introduction
Conclusions References
Tables Figures
◭ ◮
◭ ◮
Back Close
Full Screen / Esc
Printer-friendly Version Interactive Discussion
Discussion
P
a
per
|
Dis
cussion
P
a
per
|
Discussion
P
a
per
|
Discussio
n
P
a
per
|
100 hPa, the M55 region saw less air arriving from NH mid-latitudes (21% compared to 41% at 100 hPa) and more from SH central Africa (13% compared to 6% at 200 hPa) compared to the larger West African domain. These biases need to be borne in mind when analysing M55 flight data.
We now focus on discussing the origins of air masses sampled by the M55 in more 5
detail. Figure 5 shows the starting points of 10-day back trajectories initialised along the M55 flight tracks (on average 200 points per flight with 1 min time interval). The results are colour-coded in terms of pressure variations along the back trajectory (left panel), and pressure at the ending point on the M55 flight path (right panel). As noted already, air in the upper TTL has mainly resided in the TTL before arriving over West 10
Africa and shows only small theta deviations over the last 10 days. A noteworthy fraction of upper TTL (>100 hPa) air originates from further north and west over Japan and eastern China/Korea consistent with the NH mid-latitude origin shown in Fig. 4. Figure 5 also shows that the origin of air in the mid TTL (around 150 hPa) is more widespread with larger pressure variations, and air masses uplifted from Asia, India 15
and, to a lesser extent, the Middle East.
To explore this further, Fig. 6 shows scatter plots of the difference in pressure ver-sus the difference in latitude along the back trajectories coloured with O3 (left panel) and H2O (right panel) observed along the M55 flights. Ozone concentrations in air masses originating from the mid-lower troposphere are generally below 125 ppbv and 20
sometimes lower than 50 ppbv. This variability can be due to uplift of O3poor (marine) or rich (polluted) air masses and mixing with air masses already residing in the TTL. Cross-hemispheric transport of air masses via the TEJ with high O3 and low H2O are also evident (negative latitude changes and small pressure changes). The variability in observed O3concentrations is discussed further in Sect. 6. Concerning H2O, Schiller 25
ACPD
10, 15485–15536, 2010West African TTL chemical composition: air
mass origins
K. S. Law et al.
Title Page
Abstract Introduction
Conclusions References
Tables Figures
◭ ◮
◭ ◮
Back Close
Full Screen / Esc
Printer-friendly Version Interactive Discussion
Discussion
P
a
per
|
Dis
cussion
P
a
per
|
Discussion
P
a
per
|
Discussio
n
P
a
per
|
air masses arriving over West Africa. This analysis is also in agreement with the study of James et al. (2008) who investigated the moist H2O anomaly associated with the summer Asian monsoon seen in MLS data. This is confirmed by Fig. 6 which shows that a significant number of air masses sampled by the M55 were uplifted. At the point of measurement, although mainly low H2O was observed, higher H2O concentrations 5
were also observed. Figure 7 shows where 10 day back trajectories arriving along the M55 flights left the lower troposphere, also coded in terms of O3 (left panel) and H2O (right panel). In this case a more strict criteria was used to define uplift as being from below 800 hPa. The points on the maps, although scattered, show a band extending from eastern Africa to south-east Asia. Interestingly, for H2O there appears to be an 10
east–west gradient in concentrations with air masses associated with more recent up-lift over the Arabic peninsula having higher H2O concentrations upon arrival over West Africa than those originating from further east over Asia. Recent convective influence could also explain higher H2O concentrations in the TTL over West Africa.
This analysis shows that, in general, air in the upper TTL over West Africa, and in 15
the region of the M55 flights, was influenced by a variety of more recent (10 day) air mass origins superimposed on the large-scale westerly flow. The mid and upper TTL was influenced by recent import of lower stratospheric air from NH mid-latitudes. The mid-TTL also shows a significant influence from air masses uplifted from the lower and mid troposphere over Asia, and India whereas the lower TTL was mainly impacted by 20
air recently uplifted from the troposphere over Africa.
5 Recent regional convection
The influence of local convective uplift occurring over western and central Africa is examined further in this section. Coincidences were identified between ECMWF back trajectories over the whole West African domain (as described in the previous section) 25
ACPD
10, 15485–15536, 2010West African TTL chemical composition: air
mass origins
K. S. Law et al.
Title Page
Abstract Introduction
Conclusions References
Tables Figures
◭ ◮
◭ ◮
Back Close
Full Screen / Esc
Printer-friendly Version Interactive Discussion
Discussion
P
a
per
|
Dis
cussion
P
a
per
|
Discussion
P
a
per
|
Discussio
n
P
a
per
|
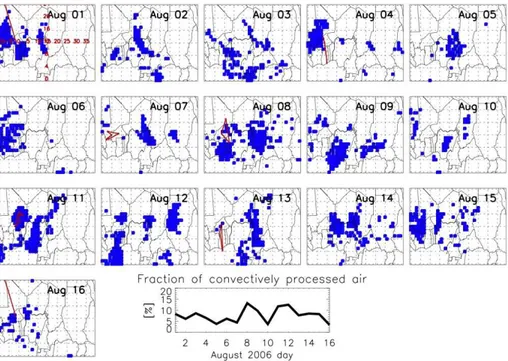
radiance temperatures were below 200 K. The time resolution of the MSG images was 30 min and horizontal resolution ranged from 5 to 10 km. Since the images covered the longitudinal band 30◦W to 40◦E, the convection was local and relatively recent, i.e. given the average westward speed of the MCS, not older that 3–4 days. Figure 8 shows daily maps of this diagnosed convective impact at 200 hPa from 1 to 16 August. 5
The results show that large regions over West Africa were constantly influenced by recent local convection during the timeframe of the M55 campaign, making it difficult to define an “unperturbed” state in the lower TTL with respect to convective influence at this altitude. The fraction of convectively processed air (%) is also shown for each day in Fig. 8. This represents the fraction of trajectories that have passed over a convective 10
system over Africa, as identified by MSG. At least 5% of trajectories need to have encountered convection in order to be included in the calculation of the average impact for each day. This provides an estimate about the regional influence of convection on different days during the campaign at the main convective outflow level (200 hPa). The flights on 8, 11 and 12 August were more influenced by convection compared to other 15
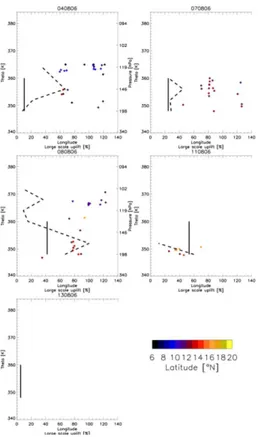
days with fractions reaching 12–15%. These results can be compared with estimates of local convective impact along the flight tracks also based on coincidences between back trajectories and MSG clouds (Fig. 9). The average percentage of trajectories arriving between 350–360 K are shown as a vertical bar since it is not possible to discriminate differences in altitude based on coincidences with MSG convective clouds. 20
The percentages are larger than those calculated for the whole domain at 200 hPa and can be explained by the location of particular flights and the fact that Fig. 9 also includes coincidences up to 360 K. In general, the along flight estimates show similar variations between the different days as seen for the whole region (Fig. 8) except for 7 August which shows more convective influence in the along flight analysis. The results in Fig. 9 25
ACPD
10, 15485–15536, 2010West African TTL chemical composition: air
mass origins
K. S. Law et al.
Title Page
Abstract Introduction
Conclusions References
Tables Figures
◭ ◮
◭ ◮
Back Close
Full Screen / Esc
Printer-friendly Version Interactive Discussion
Discussion
P
a
per
|
Dis
cussion
P
a
per
|
Discussion
P
a
per
|
Discussio
n
P
a
per
|
further east. On 7 August, the aircraft flew in the outflow of a small MCS that tracked across Niger, Burkina Faso and Mali (Cairo et al., 2010). The fact that this was a rather small system explains the lower along flight fractions in Fig. 9 and the low average regional convective impact in Fig. 8. The flights on 4 and 13 August, when the M55 flew to south to the Gulf of Guinea, show less convective influence, particularly on 4 5
August. On 13 August the southern part of the flight at 200 hPa was influenced by downwind transport of convectively uplifted air masses further east over central Africa (Real et al., 2010). In the case of the flight on the 4 August, it was possibly influenced by local sporadic convective near Ouagadougou, at the beginning and end of the flight. These results can also be compared to a more detailed study described in a com-10
panion paper, Fierli et al. (2010), where a mesoscale model was used to calculate trajectories for M55 flights on 7, 8 and 11 August 2006. The BOLAM simulations, cov-ering the latitude band 15◦W to 45◦E, were nudged with MSG brightness temperatures leading to a more realistic representation of convective systems during the campaign period (see also Orlandi et al., 2010). Their estimates of convective fraction (derived 15
using model calculated back trajectories originating below 800 hPa) varied a lot be-tween flights and with altitude. In general, Fierli et al. (2010) estimated significant convective impact over West Africa extending to higher altitudes although the results for different days are broadly consistent with the analysis presented in this paper. On 7 August up to 20% of the sampled air masses were influenced by convection up to 20
360 K. The influence was higher on 8 August (70% up to 360 K) and higher still on 11 August (over 80% up to 370 K). The flights on 7 and 8 August also had some convective influence at higher altitudes.
Figure 9 also compares local convective influence, based on coincidence with con-vective clouds, with the impact of large-scale uplift diagnosed from ECMWF trajecto-25
ACPD
10, 15485–15536, 2010West African TTL chemical composition: air
mass origins
K. S. Law et al.
Title Page
Abstract Introduction
Conclusions References
Tables Figures
◭ ◮
◭ ◮
Back Close
Full Screen / Esc
Printer-friendly Version Interactive Discussion
Discussion
P
a
per
|
Dis
cussion
P
a
per
|
Discussion
P
a
per
|
Discussio
n
P
a
per
|
upwind regions the longitude where uplift occurred is also shown. Note that about 200 trajectories were run back from each flight and, as such, 30 points in Fig. 9 represent about 30–40% of the observations. The results show that as well as local convection, the flights on 7 and 8 August were also significantly influenced by large-scale uplift sev-eral days earlier over India (around 80◦E) and Asia (100–120◦E). Impacts varied from
5
20–40% on 7 August up to 360 K and reaching 60–80% up to 360 K and 30% at 370 K on 8 August. In contrast, the August 11 flight was almost entirely influenced by local African uplift (around 40◦W) up to 360 K. Interestingly, the 4 August flight, which shows
little local convective influence, was influenced by large-scale uplift up to about 365 K, again from Indian and Asian regions. The 13 August shows no impact from large-scale 10
uplift in Fig. 9 although clear influences from the African and Asian troposphere are shown for this day in Fig. 4. This is due to the more strict criteria used to diagnose uplift (650 hPa compared to the range 1000–400 hPa in Fig. 4) and the fact that results in Fig. 9 are based on along flight trajectories whereas Fig. 4 shows uplift from upwind regions into West Africa.
15
In summary, recent local convection appears to have had a rather significant influ-ence on the West African region during the period of the M55 campaign in the lower TTL (based on matches with MSG convective clouds) up to an altitude of at least 365 K and sometimes 370 K. In addition, the air masses sampled by the M55 were also sig-nificantly influenced by uplift of tropospheric air masses from India, Asia and oceanic 20
regions.
6 Relation to observed trace gas profiles
In the following section, we examine whether distinct signatures of different air mass origins can be seen in trace gas and aerosol data that was observed by the M55 during the local flights over West Africa. The data was grouped into flights with more (7, 8, 11 25
ACPD
10, 15485–15536, 2010West African TTL chemical composition: air
mass origins
K. S. Law et al.
Title Page
Abstract Introduction
Conclusions References
Tables Figures
◭ ◮
◭ ◮
Back Close
Full Screen / Esc
Printer-friendly Version Interactive Discussion
Discussion
P
a
per
|
Dis
cussion
P
a
per
|
Discussion
P
a
per
|
Discussio
n
P
a
per
|
of theta in Fig. 10a, b. Data points are coloured by latitude and cross symbols identify measurements influenced by uplift, over Africa and upwind, from below 800 hPa over the previous 10 days. Following the analysis in the previous sections, local convection over Africa had a significant impact on air masses sampled by the M55 up to 350–365 K and in some instances at higher altitudes (370 K). Air uplifted over upwind regions was 5
shown to have an influence up to 370 K and air imported from the lower stratosphere impacted air masses between 370 and 410 K. Signatures from these different origins are diluted to a lesser or greater degree depending on the time since transport into the TTL and the rate of mixing with surrounding air masses.
Clear signatures related to recent convection can be seen in constituents that have 10
a short lifetime such as NO and aerosols. Observations of NO during the “convective” flights on 7 and 8 August show enhanced concentrations as high as 800 pptv up to 355 K (Fig. 10a) compared to a “non-convective” flight on 13 August (Fig. 10b). Such enhancements strongly suggest an influence of recent convection resulting in either NO production by lightning (H ¨oeller et al., 2009) or uplift of surface air masses im-15
pacted by soil NOx emissions. Saunois et al. (2009) and Stewart et al. (2008) report concentrations of surface NOx up to 1 ppbv north of 10◦N where emissions from bare
soils become dominant over vegetation. Both M55 flights were made north of this lati-tude. Interestingly, measured NO in the “non-convective” flights shows concentrations between 200–400 pptv up to 370 K. The impact of NOxon photochemical O3production 20
is discussed later in this section. Figure 10 also shows measured NOyconcentrations. There is a large variability in the profiles, especially for the “convective” flights below about 365 K linked to the influence of local emissions. At these altitudes, NOyis mainly expected to be in the form of HNO3 and to have a relatively long lifetime (in the ab-sence of washout). Enhanced concentrations are also found on the “non-convective” 25
flight days suggesting an influence from upwind sources (lightning or anthropogenic). NOyincreases above 370 K due to the import of LS air masses.
ACPD
10, 15485–15536, 2010West African TTL chemical composition: air
mass origins
K. S. Law et al.
Title Page
Abstract Introduction
Conclusions References
Tables Figures
◭ ◮
◭ ◮
Back Close
Full Screen / Esc
Printer-friendly Version Interactive Discussion
Discussion
P
a
per
|
Dis
cussion
P
a
per
|
Discussion
P
a
per
|
Discussio
n
P
a
per
|
and roughly 1 µm, denoted N14, it can be seen that during August 2006, more variable aerosol concentrations were observed at 350 K in the “convective” flights compared to the “non-convective” flights. There also appears to be a minimum in concentrations around 355 K and some air masses have low aerosol below 360 K possibly due to washout in convective systems. In both “convective” and “non-convective” flights, con-5
centrations decrease towards the top of the TTL (420 K). In the lower TTL, the origin of the aerosols is unknown but may be related to uplift of precursor emissions or recent nucleation. Figure 11 shows the correlation between fine-mode aerosols and CO for the 7 and 8 August with air masses influenced by recent nucleation removed. In this case, N6 (6 nm to<1 µm) is plotted and the difference between N6 and N14 was used 10
to remove nucleation events associated with recent convection (see also Borrmann et al., 2010). Figure 11 shows a clear positive correlation suggesting a common origin. This could either be from biomass burning over Asia or central Africa or from anthro-pogenic sources. However, Borrmann et al. (2010) show a minimum in the fraction of non-volatile particles between 340–370 K. This suggests the presence of aerosols, 15
like sulphate, which could have been transported from anthropogenic sources in Asia, rather than a biomass burning source (see also CO discussion). Interestingly, in the up-per TTL, where aerosol concentrations are lower, there is a maximum (up to 50%) in the fraction of non-volatile particles indicating the presence of non-sulphate aerosol. These air masses are more aged (see discussion about CO2) and may represent a residual 20
layer of older aerosols that have not been removed by washout at lower altitudes. CO was only measured during the “convective” flights on 7 and 8 August. The ob-servations show considerable variability (45 to 100 ppbv) up to 370 K and generally decreasing concentrations above (see Fig. 10a). The range of observed CO, which has a lifetime of 2–3 months, reflects a combination of recent inputs into the TTL and 25
ACPD
10, 15485–15536, 2010West African TTL chemical composition: air
mass origins
K. S. Law et al.
Title Page
Abstract Introduction
Conclusions References
Tables Figures
◭ ◮
◭ ◮
Back Close
Full Screen / Esc
Printer-friendly Version Interactive Discussion
Discussion
P
a
per
|
Dis
cussion
P
a
per
|
Discussion
P
a
per
|
Discussio
n
P
a
per
|
analysis of all aircraft vertical profile data collected during July-August 2006 showed a maximum in CO concentrations in the upper troposphere (200 hPa) (Bouarar et al., 2010) and that flights influenced by local convection had more variable CO ranging from 80 to 200 ppbv compared to “non-convective” flights (100–150 ppbv). The M55 data is at the lower end of this range (80–100 ppbv at 200 hPa). CO concentrations ranged 5
between 70–90 ppbv in air masses where aerosol nucleation, likely to be associated with recent convection, was diagnosed to have taken place.
As already mentioned in Sect. 3, analysis of MLS CO data over the Tibetan plateau shows the existence of a positive CO anomaly up to 100 hPa (Randel et al., 2007), with concentrations in the range 80–100 ppbv attributed to deep convective uplift of 10
anthropogenic and biomass burning emissions, particularly over India and South-east Asia (Park et al., 2009). Surface CO concentrations measured over Asia are highly variable and depend on whether a site is influenced by marine or polluted air masses. For example, data collected in southern Thailand shows concentrations varying from 50 ppbv to several hundreds of ppbv (Pochanart et al., 2003). However, it does ap-15
pear that uplift in the Asian summer monsoon, followed by slow ascending transport around the upper level Tibetan anticyclone leads to enhanced CO up to 370 K at this time of year. Some of this pollution is transported westward by the TEJ and contributes to enhanced CO over southern West Africa as seen in satellite, MOZAIC and aircraft data (Barret et al., 2008; Reeves et al., 2010). As well as CO, Park et al. (2008) 20
also showed enhancements up to 20 km in trace gases measured by the ACE satellite that are markers of surface pollution such as HCN (an indicator of biomass burning) and hydrocarbons over a region extending from 0–120◦E and 10–40◦N during June
to August 2004–2006. However, MODIS fire count data show that biomass burning was not very prevalent during the latter half of July, or the beginning of August in 25
ACPD
10, 15485–15536, 2010West African TTL chemical composition: air
mass origins
K. S. Law et al.
Title Page
Abstract Introduction
Conclusions References
Tables Figures
◭ ◮
◭ ◮
Back Close
Full Screen / Esc
Printer-friendly Version Interactive Discussion
Discussion
P
a
per
|
Dis
cussion
P
a
per
|
Discussion
P
a
per
|
Discussio
n
P
a
per
|
in the TTL, it is difficult to separate these two origins using CO alone. The measure-ments of aerosols, NOy and as discussed later, CO2, support the hypothesis that the lower-mid TTL was strongly influenced by uplift of lower tropospheric air masses.
One exception is an event with very low CO concentrations (<50 ppbv) observed between 350 and 360 K that was also subject to uplift from the lower troposphere. 5
These air masses had low H2O suggesting dehydration during transport. However, surface measurements of lower tropospheric CO over Asia reported by the US National Oceanic and Atmospheric Administration (NOAA) Carbon Cycle Greenhouse Gas (CCGG) monitoring network (http://www.esrl.noaa.gov/gmd/ccgg/iadv/) do not show values below 50 ppbv. This, and the fact that O3 concentrations were not particularly 10
low (50–60 ppbv), suggests that uplift from an oceanic region followed by mixing with air of lower stratospheric origin had taken place, even in the lower part of the TTL. The analysis presented in Sect. 4 suggests a lower stratospheric influence of 10–20% at 350–360 K in the M55 flights. However, this contribution may have been underesti-mated in this case.
15
CO2was measured during “convective” flights influenced by primarily by African con-vection on 11 August and uplift over India on 8 August. Below 360 K, air masses that were uplifted show variable CO2 concentrations between 374 to 377 ppmv. Flights of the DLR-Falcon (up to 200 hPa) found slightly enhanced CO2 concentrations (379 to 380 ppmv) in convectively uplifted air masses compared to more typical upper tropo-20
spheric values (374 to 376 ppmv) (Andr ´es-Hern ´andez et al., 2009). Low concentrations observed up to 368 K on 11 August have been attributed to active local convective uplift on that day (Fierli et al., 2010; Homan et al., 2010) transporting boundary layer CO2 with low CO2 concentrations into the TTL. These air masses were associated with higher H2O, some enhancement in aerosols and O3 concentrations around 60 ppbv. 25
ACPD
10, 15485–15536, 2010West African TTL chemical composition: air
mass origins
K. S. Law et al.
Title Page
Abstract Introduction
Conclusions References
Tables Figures
◭ ◮
◭ ◮
Back Close
Full Screen / Esc
Printer-friendly Version Interactive Discussion
Discussion
P
a
per
|
Dis
cussion
P
a
per
|
Discussion
P
a
per
|
Discussio
n
P
a
per
|
increasing contribution from lower stratospheric air masses: 20–30% based on Fig. 4 and N2O data analysis presented by Homan et al. (2010). The CO2profiles measured on 4 and 13 August also show CO2 increasing with altitude above 350 K except for one low CO2 event between 360–368 K. An event with higher CO2 (379–380 ppmv at 200 hPa) has been linked to convective uplift of central African biomass burning emis-5
sions on 13 August (black points in Fig. 10b) (see Real et al., 2010). This event, which is not diagnosed in the ECMWF trajectories, was accompanied by enhanced concen-trations of O3, NO, NOyand aerosols. A similar event was observed on 4 August in the aerosol data.
The constant perturbation of the CO2 profile by deep convection over Africa or by 10
convective uplift to the east resulted in concentrations as high as 382 ppmv being ob-served in the TTL over West Africa. Note that concentrations obob-served during sum-mer 2006 at NOAA CCGG surface sites in Asia varied from 373 to 382 ppmv (see http://www.esrl.noaa.gov/gmd/ccgg/iadv/). Measured TTL CO2 during the 8 August flight that was particularly influenced by uplift over India (see Fig. 9) was in this range. 15
Given the long lifetime of CO2, these recent signatures are superimposed on the large-scale picture. The M55 profiles are partly in accordance with the notion of slow as-cent of air masses injected several months earlier during Northern Hemisphere spring when surface CO2concentrations are higher (e.g., Boering et al., 1996, and supported by Homan et al., 2010). However, measured profiles of CO2, CO etc. up to 370 K 20
also reflect more recent origins including local (last 3–4 days) and upwind (last 10– 20 days) convection. This suggests that the age spectrum of air masses in the lower and mid-TTL may include a higher component of younger air masses than previously assumed, for example in studies estimating the age of air in the mid-TTL at the cold point tropopause (e.g., Park et al., 2007; Gettelman et al., 2009). Age of air depends 25
ACPD
10, 15485–15536, 2010West African TTL chemical composition: air
mass origins
K. S. Law et al.
Title Page
Abstract Introduction
Conclusions References
Tables Figures
◭ ◮
◭ ◮
Back Close
Full Screen / Esc
Printer-friendly Version Interactive Discussion
Discussion
P
a
per
|
Dis
cussion
P
a
per
|
Discussion
P
a
per
|
Discussio
n
P
a
per
|
The interpretation of the measured O3profiles over West Africa during the M55 cam-paign is complex because O3has competing sources in the stratosphere and the lower troposphere. Analysis of tropical ozonesonde data from the SHADOZ network (e.g., Folkins et al., 2002; Thompson et al., 2007) shows the presence of an O3 minimum, varying between 30 and 60 ppbv, in the region of convective outflow (200 hPa, 350 K). 5
This is often explained by the uplift of O3-poor air from clean marine regions. Con-centrations increase rapidly with altitude to the top of the TTL. This is attributed to an increasing contribution from import of LS air masses particularly above the cold point tropopause (e.g., Konopka et al., 2010). Previous studies have also shown significant longitudinal variations in upper tropospheric O3 related to the large scale circulation 10
in the troposphere and lower stratosphere, leading to, for example, a maximum over the Tibetan Plateau linked to the formation of the summer Asian monsoon (Randel et al., 2007) and, the formation of a semi-permanent maximum in the UT over the south-ern Atlantic Ocean due to the recirculation of air masses rich in O3from central African biomass burning regions by the Hadley circulation (e.g., Sauvage et al., 2006; Sauvage 15
et al., 2007b). Therefore, it is clear that O3concentrations in the TTL are variable and depend on location and time of year. In addition, O3and its precursors such as CO or NOx are highly variable in the troposphere. This makes it difficult to justify the use of seasonal or annual average vertical profiles to estimate the impact of deep convection and transport into the stratosphere, as was the case in recent studies (Konopka et al., 20
2010; Gettelman et al., 2009).
In the lower TTL, as part of AMMA, analysis of MOZAIC and MLS O3data at 200 hPa over western and central Africa during the summer 2006 monsoon, showed a maximum at 10◦S, a minimum at 5◦N, and increasing concentrations further north (Barret et al., 2010) giving rise to a pronounced latitudinal gradient varying from 45–50 ppbv over the 25
ACPD
10, 15485–15536, 2010West African TTL chemical composition: air
mass origins
K. S. Law et al.
Title Page
Abstract Introduction
Conclusions References
Tables Figures
◭ ◮
◭ ◮
Back Close
Full Screen / Esc
Printer-friendly Version Interactive Discussion
Discussion
P
a
per
|
Dis
cussion
P
a
per
|
Discussion
P
a
per
|
Discussio
n
P
a
per
|
differences in ozonesonde data collected in July and August 2006 at Cotonou, Benin (6◦N, 2◦E) and Niamey, Niger (13◦N, 2◦E), further north. Although minimum concen-trations at 200 hPa were slightly lower over Cotonou, a pronounced upper tropospheric maximum is present over Niamey between 450–250 hPa most likely due to photochem-ical production of O3from lightning NOxemissions or from uplift of a mixture of soil NOx 5
and biogenic hydrocarbons (advected northwards in the lower troposphere, Saunois et al., 2009).
The measured M55 O3profiles reflect the different combination of air mass origins as discussed already for other trace species. Whilst it is difficult to generalise, the “convec-tive profiles” (Fig. 10a), which were primarily collected north of 10◦N, generally have 10
higher O3 concentrations at 350–360 K than the “non-convective” profiles (Fig. 10b) which include descents to 350 K (200 hPa) at 5◦N and have lower concentrations. The M55 data are within the range measured by the DLR Falcon during the same period (Andr ´es-Hern ´andez et al., 2009) up to 150 hPa. They also found evidence for higher O3concentrations in regions of convective outflow coincident with elevated levels of O3 15
precursors from lightning NOxemissions and surface uplift as mentioned previously. Figure 12 shows the average O3profile as a function of potential temperature, using data from all local flights, together with the fraction of data points lying three standard deviations outside the mean. As discussed above, the lower part of the ozone profile can be understood in terms of local recent deep convection with a local maximum at 20
340 K and a weak minimum at 350 K. In the lower TTL, O3concentrations increase but at a slower rate than above 370 K (roughly 2 ppbv per K below 370 K and 6 ppbv per K above 370 K). This is due to the important contribution from uplift of tropospheric air masses as confirmed by the pressure variations along the back trajectories (rightmost panel in Fig. 12) as well as enhanced variability in the O3 data up to 370 K. Average 25
ACPD
10, 15485–15536, 2010West African TTL chemical composition: air
mass origins
K. S. Law et al.
Title Page
Abstract Introduction
Conclusions References
Tables Figures
◭ ◮
◭ ◮
Back Close
Full Screen / Esc
Printer-friendly Version Interactive Discussion
Discussion
P
a
per
|
Dis
cussion
P
a
per
|
Discussion
P
a
per
|
Discussio
n
P
a
per
|
stratospheric up-welling (Randel et al., 2007; Homan et al., 2010) and the important contribution from LS import via the Asian monsoon anticylone as shown in this study and by others (e.g., Konopka et al., 2010).
The data presented here show that the M55 observed non-negligible concentrations of NO and CO up to 370 K suggesting that the lower TTL is potentially more photo-5
chemically active than previously assumed, and that the Asian and African monsoons provide an important mechanism for transporting pollutants into this region. Real et al. (2010) used a photochemical trajectory model initialised with AMMA data (for the biomass burning plume case on 13 August 2006) to calculate rates of in-situ net O3 photochemical production, NPO3, downwind from West Africa in the upper tropo-10
sphere. They found that slow but positive NPO3(in runs with and without mixing with surrounding air masses) can be maintained even in air masses with NO concentrations of 200 pptv. Here, we performed further runs of the CiTTyCAT photochemical model taking initial conditions of O3 precursors such as VOCs and NOy species from the background conditions in the upper tropospheric case of Real et al. (2010). CO was 15
initialised at 90 ppbv based on M55 data. The model was run for 4 days at 150 hPa and average NPO3 calculated over the last 24 h. Mixing was not taken into account in the simulations. A series of sensitivity tests were carried out varying initial concen-trations of O3, H2O and O3 precursors (NO, CO and VOCs). As already discussed in Real et al. (2010), NPO3 was quite insensitive to initial CO and VOC concentrations. 20
The sensitivity of NPO3 to initial NO, O3 and H2O concentration is shown in Fig. 13. NO concentrations were varied but concentrations of other NOyspecies were kept the same totalling around 300 pptv (not including NO).
At O3concentrations below 150 ppbv NPO3is always positive and varies from about 0.5 ppbv per day to more than 2 ppbv per day with higher NPO3 at higher NO and 25
ACPD
10, 15485–15536, 2010West African TTL chemical composition: air
mass origins
K. S. Law et al.
Title Page
Abstract Introduction
Conclusions References
Tables Figures
◭ ◮
◭ ◮
Back Close
Full Screen / Esc
Printer-friendly Version Interactive Discussion
Discussion
P
a
per
|
Dis
cussion
P
a
per
|
Discussion
P
a
per
|
Discussio
n
P
a
per
|
O3production at higher NO concentrations. In the lower TTL, air masses influenced by convection have higher NO than used here (800 pptv) which will lead to higher NPO3 (up to several ppbv per day). In the upper TTL, H2O is low but NO is also around 200 to 400 pptv (see Fig. 10b) and O3 is increasing leading to small but positive NPO3 of up to 0.5 ppbv per day. Thus, it is possible that much of the TTL over West Africa, and 5
especially the lower TTL, at least in the lower TTL, is photochemically active and in a net O3production regime.
Therefore, in contrast to certain studies, such as Konopka et al. (2010), which as-sume that tropospheric photochemisty is not important in the TTL, the results presented here, and those previously reported (e.g., Folkins et al., 2002), show that photochem-10
istry does play an important role in governing the O3 budget, especially in the lower to mid TTL. The O3 gradient seen the M55 observations (Fig. 12) below 370 K can be explained by uplift of precursors into this region, and maintenance of O3 concentra-tions by in-situ photochemical O3 production. Ideally, budget calculations need to be performed with global models including both tropospheric and stratospheric chemistry. 15
Previous studies of the tropospheric O3 budget have already shown that results are very sensitive to the amount of O3 transported into the troposphere from the strato-sphere (Wu et al., 2007), and often gradients of trace species are smeared out. If global models overestimate O3 in the TTL, they are likely to underestimate NPO3 in this region, especially if H2O is also overestimated (as shown by Fig. 13). Lightning 20
NOx, on the other hand, may be underestimated in global models as shown by Barret et al. (2010) over West Africa.
In summary, trace gas and aerosol profiles measured on the M55 during August 2006 show distinct signatures of recent local convection up to 350–365 K, particularly in shorter-lived species like NO, CO and aerosols. Signatures due to uplift over upwind 25