Percolation on Networks with Conditional
Dependence Group
Hui Wang1,2,3,4, Ming Li2*, Lin Deng1,3, Bing-Hong Wang2*
1School of Computer and Information/Hefei University of Technology, Hefei, Anhui Province, 230009, P.R. China,2Department of Modern Physics/University of Science and Technology of China, Hefei, Anhui Province, 230026, P.R. China,3Information Construction and Development Center/Hefei University of Technology, Hefei, Anhui Province, 230009, P.R. China,4Center of Information Support and Assurance Technology, Anhui University, Hefei, Anhui Province, 230601, P.R. China
*[email protected](ML); [email protected](BHW)
Abstract
Recently, the dependence group has been proposed to study the robustness of networks with interdependent nodes. A dependence group means that a failed node in the group can lead to the failures of the whole group. Considering the situation of real networks that one failed node may not always break the functionality of a dependence group, we study a cas-cading failure model that a dependence group fails only when more than a fractionβof nodes of the group fail. We find that the network becomes more robust with the increasing of the parameterβ. However, the type of percolation transition is always first order unless the model reduces to the classical network percolation model, which is independent of the degree distribution of the network. Furthermore, we find that a larger dependence group size does not always make the networks more fragile. We also present exact solutions to the size of the giant component and the critical point, which are in agreement with the simulations well.
Introduction
In the last decades, complex networks have attracted increasing attention [1,2], since many
re-alistic systems can be described by networks, such as the Internet, metabolic system, food web
and traffic system [3]. One of the important topics in complex networks is the robustness of
the networked system, i.e., the ability of a network to resist change without adapting its initial stable configuration.
In theory, network percolation model is usually used to study the robustness of networks
[4–6]. In simple terms, the network percolation model describes the behavior of connected
clusters of a network after a fraction 1−pof nodes have been removed. This model usually
ex-hibits a second order phase transition, that is the size of the giant component continuously
de-creases to zero whilepdecreases to the critical pointpc. In addition, the critical pointpcis
usually used to evaluate the robustness of the networks. The smaller the critical pointpcis, the
more robust the network is. For some specific cases, such as random networks, the critical point can be solved exactly [7,8].
a11111
OPEN ACCESS
Citation:Wang H, Li M, Deng L, Wang B-H (2015) Percolation on Networks with Conditional Dependence Group. PLoS ONE 10(5): e0126674. doi:10.1371/journal.pone.0126674
Academic Editor:Daqing Li, Beihang University, CHINA
Received:November 14, 2014
Accepted:April 6, 2015
Published:May 15, 2015
Copyright:© 2015 Wang et al. This is an open access article distributed under the terms of the
Creative Commons Attribution License, which permits unrestricted use, distribution, and reproduction in any medium, provided the original author and source are credited.
Data Availability Statement:All relevant data are within the paper.
Recently, to study the effects of the dependence between nodes on the robustness of
net-work, the concept of dependence group (link) has been proposed [9,10]. The dependence
group means that if one of the nodes in a group fails, the group will fail totally, i.e., all the other nodes of the group fail. For example, in a financial network, the trading and sale connections between companies can be understood as the connectivity links of the network. Besides, the companies in the same industrial chain could form a dependence group. If one company fails, the other companies in the same industrial chain could also fail due to the rupture of the industrial chain.
Parshaniet alfind that the robustness of such networks is determined by the sizegof the
de-pendence group [10,11]. A lagergcould make such networks much more fragile than the
net-works without dependence group (g= 1), and the networks are more robust when the degrees
are distributed more broadly. Furthermore, instead of the second order percolation transition,
the networks with dependence group demonstrate a first order percolation transition forg>1.
In ref.[12], Bashanet alfind that ER(Erdos-Rényi) and RR(random-regular) networks
topolo-gies differ greatly in their stability in the case of large dependence group sizes. In addition, when such networks are embedded into a two-dimensional space, they will be extremely fragile [13].
After that, Liet alalso show that the overlapping of the connectivity and dependence links
(g= 2) and the asymmetric dependence can make such networks more robust [14,15]. In
addi-tion, the networks with dependence groups or links have also been studied in the form of inter-dependent networks and multilayer networks, which also shows the fragility of networks when
nodes depend on each other [16,17]. In these studies, some new phenomena have also been
found, such as assortativity decreases the robustness of interdependent networks [18],
percola-tion transipercola-tions are not always sharpened by making networks interdependent [19],
simulta-neous first and second order percolation transitions [20].
However, in reality, the failure of one node may not always lead to the failure of the depen-dence group. For example, in an industrial chain, two or more companies may play a similar role. Thus, if one of them fails, the other companies can also form a complete industrial chain. But if all these companies fail, the missing links will make it impossible for the other companies to form a complete industrial chain. As a result, all the other companies in this industrial chain will fail. We can find the similar phenomenon when we consider the rumor spreading on on-line social networks. Individuals on Facebook or Twitter always belong to some groups based on interest, work, or region. Someone in a group will listen to a rumor, only when a fraction of individuals in the same group listen to this rumor. Therefore, in reality, the dependence of nodes in a group could be conditional, only when a fraction of nodes fail, the whole group will fail.
In this paper, we will study the cascading dynamics of networks with this conditional
depen-dence group. Following the model proposed by Parshaniet al[10], we consider the network
with a degree distributionpkand each node belongs to a dependence group with sizeg. In our
model, only when the fraction of the failed nodes of a group is larger thanβ, the group will fail,
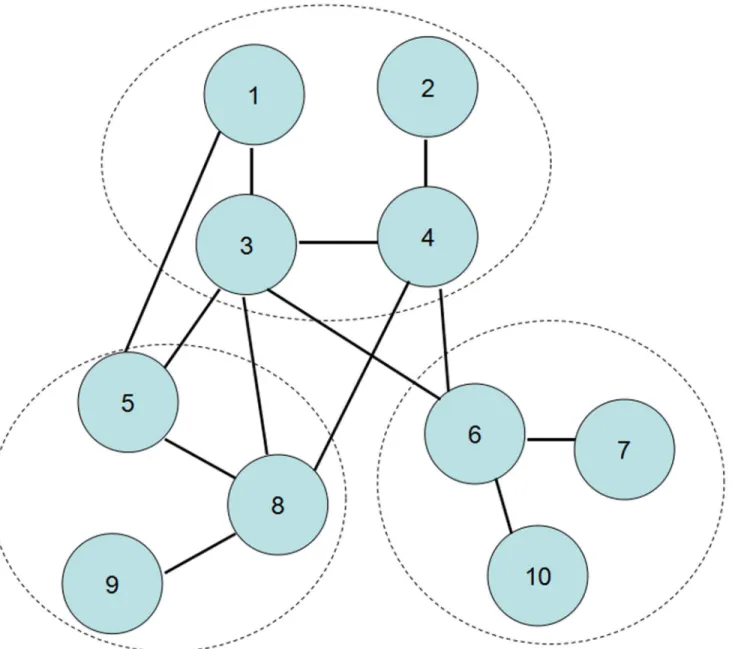
i.e., all nodes in the group fail. An illustration of this model is given inFig 1. Obviously, our
model is equivalent to the model proposed by Parshaniet alwhenβ!0 [10], and reduces to
the classical network percolation model whenβ!1. In some sense, the parameterβrepresents
the dependence intensity of the nodes in a group. A largeβmeans the dependence of nodes is
strong, one failed node could lead to the failure of the whole group. While the smallβmeans
the dependence of nodes is weak, one failed node does not affect the functionality of the group.
Note that this model is different from the one proposed in ref.[15]. In their model, the failure
of a group is determined by the total degrees of the failed nodes, and the nodes with larger de-grees are more important for a group to keep its functionality. So the nodes in their model are
unequal, the dependence is asymmetric. However, the dependence in our model is mutual, all the nodes in a group play the same role in keeping the group running.
The paper is organized as follows. In the next section, we will give the analytical results of our model using generating function techniques. And then, we perform computer simulations on ER networks to confirm the predictions of theoretical analysis. The discussion and conclu-sion are given in the last section.
Fig 1. Networks with conditional dependence groups.The network is composed of nodes and connectivity links, and each node belongs to a dependence group (surrounded by dash lines). In each group, if more than a fractionβof nodes fail, the group will fail, i.e., all the nodes of this group fail. Takeβ= 0.5 as an example. In the group formed by nodes 5, 8 and 9, when node 9 fails, nodes 5 and 8 will still work since the fraction of failed nodes is less thanβ. However, if nodes 5 and 9 fail simultaneously, node 8 must also fail. This model can also be described by the load model used in ref.[15], this article does not cover details of this model.
Analysis
The iterative process of cascading failures on the network with dependence groups begins by
randomly removing a fraction 1−pof nodes of the network as the initial failed nodes. The
failed nodes will lead to two cascading failure processes:
1. Links that belong to the failed nodes will also fail, which could result in the other nodes dis-connecting to the network. This process is called percolation step.
2. If the fraction of the failed nodes of a dependence group is larger thanβ, the group will fail,
i.e., all the other nodes in this group fail. This process is called dependence step.
Once the cascade process begins, the two steps will occur alternately until there is no further splitting of nodes.
We solve this model by the method used in ref.[14,21], which considers the final state after
the cascades. In this paper, the probability that a randomly chosen node belongs to the giant
component is denoted asS, which is the order parameter usually used in percolation theory.
Furthermore, the parameterRgives the probability that a randomly chosen link connects to
the giant component. Therefore, for the steady state,Ssatisfies
S¼p½1 G0ð1 RÞfðRÞ: ð1Þ
Here,G0(x) is the generating function of the degree distributionG0(x) =∑kpkxk. So it is easy to
know thatp[1−G0(1−R)] gives the probability that a randomly chosen node is not removed at
the initial and belongs to the giant component. The functionf(R) expresses the probability that
the dependence group which the chosen node belongs to is functioning.
Then, we check that the conditions of a dependence group is functioning after the cascades,
and give the expression off(R). As the setting of the model, a functioning group can not have
more than a fractionβof nodes that do not belong to the giant component. This yields
fðRÞ ¼X bgbc
i¼0
g 1
i
!(
1 p½1 G0ð1 RÞ
)i(
p½1 G0ð1 RÞ
)g 1 i
; ð2Þ
wheregis the size of the dependence group, andbgβcis the largest integer smaller than or
equal togβ. Note that onlyg−1 nodes are considered inEq (2), this is because the chosen node
we considered must belong to the giant component (seeEq (1)). For convenience, we rewritef
(R) in the form of the incomplete beta function,
fðRÞ ¼Ilða;bÞ: ð3Þ
Here,λ=p[1−G0(1−R)],a=g−1−bgβcandb=bgβc+ 1. Thus,Eq (1)can be written as
S¼p½1 G0ð1 RÞI
lða;bÞ ¼lIlða;bÞ: ð4Þ
Obviously, whenβ!1,Iλ(a,b) = 1,Eq (4)reduces toS=p[1−G0(1−R)], which is just the equa-tion for the classic network percolaequa-tion [7]. Whileβ!0,Iλ(a,b) =pg−1[1−G0(1−R)]g−1,Eq (4)
reduces toS=pg[1−G0(1−R)]g, which is the equation for the percolation on the network with
unconditional dependence group [10].
Similarly, we can get the equation forR,
R¼p½1 G1ð1 RÞI
lða;bÞ; ð5Þ
whereG1(x) is the generating function of the excess degree distributionG1(x) =∑kpkkxk−1/hki.
Obviously,Eq (5)has a trivial solutionR= 0, which means that the network has no giant
first time is the critical point (pc,Rc). The nontrivial solution ofRcan be presented by the non-zero crossing points of the curvesX(R) =p[1−G1(1−R)]Iλ(a,b) andY(R) =R. Thus, the critical point (pc,Rc) corresponds to the tangent of the curvesX(R) andY(R), that is
pc½1 G1ð1 RcÞ
dIlða;bÞ
dRc
pc
dG1ð1 R
cÞ
dRc
Ilða;bÞ ¼1: ð6Þ
Together withEq (5), we can obtain the critical point of this model.
As we pointed in the last section, our model will reduce to two existing percolation models, whose types of percolation transition are different. So, the crossover of the first and the second
phase transitions must can be observed in our model. In the first order transition region,Rc>
0, we can solve Eqs (5) and (6) numerically to obtain the first order transition pointpI
c.
For the second order transition,Rc= 0, thusλ= 0. Fora>0,Eq (5)is a no solution
equa-tion, sinceIλ(a,b) = 0. Therefore, in the second order transition region, the parameters must
satisfya= 0, i.e.,gβg−1. That is to say the tricritical pointβcis (g−1)/g. Whena= 0 andλ
= 0,Iλ(a,b) = 1, soEq (6)gives the critical point of the second order transition,
pII c ¼
1
G0
1ð1Þ
; b>bc: ð7Þ
This is the critical point of the classic percolation on a tree-like spare network [7]. This result is
obvious as the dependence group does not serve any function whenβ>βc= (g−1)/g. In
con-clusion, unless the model reduces to the classic percolation model, it always demonstrates a
first order phase transition, which is independent of the degree distribution of the network. In
other words, the tricritical point of the system only depends on the size of the dependence group.
ER network
As an example, we consider the cascade process on ER networks, for which the generating function can be written as
G0ðxÞ ¼G1ðxÞ ¼e hkið1 xÞ
: ð8Þ
Substituting these generating functions into Eqs (4) and (5), we get a self-consistent equation
for the order parameterS,
S¼pð1 e hkiSÞI
pð1 ehkiSÞða;bÞ: ð9Þ
Here, the relationS=Rfor ER networks is used. Solving this equation, we will obtain the
rela-tion of the order parameterSand the control parameterp.
To validate the theoretical results, we carried out simulations on an ER network with 20000 nodes, and plot the size of the giant component in the end of cascade process as a function of
the fractionpof nodes that have been left after random removal in Figs2and3. One can see
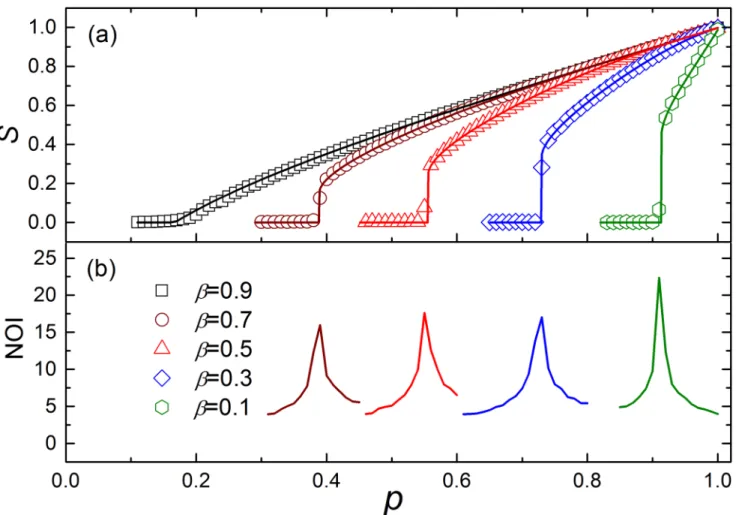
that the simulation results are in agreement with the theoretical results well. FromFig 2, we
can find that the network becomes more fragile withβdecreasing, and whenβ!1, the system
demonstrates a second order phase transition. This is because a smallβallows the nodes in the
same group to have a limited amount of independence.
It is easy to know that a larger dependence group will cause greater damage when it fails.
However, for a givenβ, a larger group also has a larger thresholdbgβc, which means the large
dependence groups are robust. These two opposing effects will lead to that the networks with
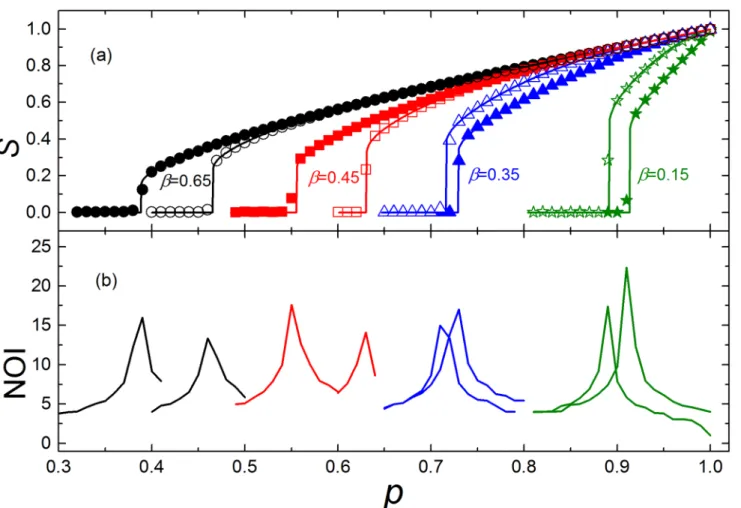
large group sizes are not always more fragile than those with small group sizes (seeFig 3),
For givenβ,gandg0withg<g0, the inequalitybgβc/bg0βc g/g0must always hold. We find that whenbgβc/bg0βc=g/g0, the network with the larger group sizeg0is more fragile than the one with group sizeg. Whilebgβc/bg0βc<g/g0, the network with the smaller group size is
more fragile (seeFig 4).
Next, we will find the first order transition pointpI
cand the second order transition point
pII
c. For ER networks, we have
G0
0ðxÞ ¼G
0
1ðxÞ ¼ hkie
hkið1 xÞ: ð10Þ
In addition, the incomplete beta function satisfies
dIlða;bÞ
dl ¼l
a 1
ð1 lÞb 1: ð11Þ
Fig 2. The simulation results of ER networks with 20000 nodes for differentβ.In the simulation, the parameters are set as:hki= 6,g= 5. (a) The size of the giant componentSversusp, the fraction of nodes that have been left after random removal. The symbols represent simulation results, and the solid lines show the corresponding analytical predictions ofEq (9). Forβ>(g−1)/g, the dependence group has no effect on the cascading process, then the percolation process leads to a second order phase transition. Whenβ<(g−1)/g, a first order phase transition can be found. Both the first and the second order phase transition processes obeyEq (9). (b) As pointed in ref.[10], the number of iterative failures (NOI) sharply increases whenpapproaches the critical point, so the sharp peaks can identify the corresponding critical pointspI
Substituting these functions intoEq (6), we get a self-consistent equation for the critical pointpc,
lacð1 l
cÞ b 1
þSc
lc
dlc
dSc
¼1; ð12Þ
wherelc¼pcð1 e
hkiScÞ. Here, we have usedEq (9)and the relationS=Rfor ER networks.
For the second order phase transition,Sc!0, thuslacð1 lcÞ
b 1
!0,Sc/λc!1 and
e hkiSc !1. And then, we will have the critical point for the second order region,
dlc
dSc
¼pII
chki ¼1: ð13Þ
This is just the critical point for the classic percolation on ER networks, which is consistent with the previous discussion.
For the first order phase transition,Sc>0, we can not get an analytical expression of the
critical pointpI
c. However, we can solve Eqs (9) and (12) numerically in the condition ofSc>0
Fig 3. The results of ER networks with 20000 nodes for differentg.In the simulation, the parameters are set as:hki= 6,g= 5 (solid symbols) andg= 10 (empty symbols). (a) The size of the giant componentSversusp, the fraction of nodes that have been left after random removal. The symbols represent simulation results, and the solid lines show the corresponding analytical predictions ofEq (9). Whenβ= 0.15, 0.35, networks become more robust withg
increaseing. However, forβ= 0.45, 0.65, networks become more fragile withgincreaseing. (b) NOI sharply increases whenpapproaches the critical point, so the sharp peaks can identify the corresponding critical pointspI
to obtain the critical pointpI
c. Because the incomplete beta function is a discontinuous function
whenaandbare positive integers, the curve of the critical pointpI
cversusβis discontinuous at
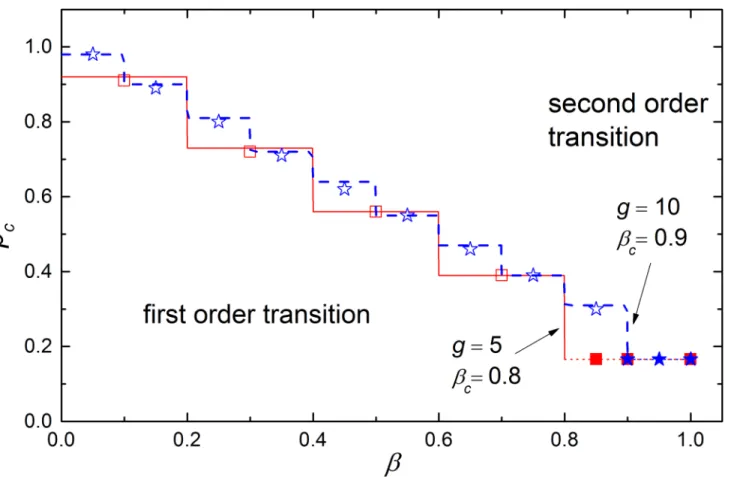
β=n/g,n= 1, 2, 3,. . .,g−1 as shown inFig 4.
InFig 4, we plot the values ofpcas a function ofβfor differentgandhki. As the theoretical analysis, one can find the crossover between the two types of phase transitions, and the
tricriti-cal pointβcis only dependent on the sizegof the dependence group and independent of the
av-erage degreehkiof the network.
Discussion and conclusions
Considering the conditional dependence in real networks, we have proposed a cascading failure model on the networks with conditional dependence group. In our model, a dependence group
fails only when it has more than a fractionβof failed nodes, which covers the model that the
failure of only one node can lead to the failure of a dependence group. We think that this will reflect the actual dependence of real networked system in some sense.
Both simulation and analytical results reveal the existence of the crossover between the first
and the second order phase transition in our model. Whenβis small, only one or two nodes
Fig 4. The critical pointpcversusβ.In the simulation, the network size is set as 20000 and the average degree ishki= 6. The dependence group sizes are
set asg= 5 (square) andg= 10 (star). The solid and dash lines are the corresponding theoretical prediction ofEq (12)for the first order transition region, and the dot lines for the second order transition region. As discussed in the text, the curve of the critical pointpI
cis discontinuous atβ=n/g,n= 1, 2, 3,. . .,g−1. Forβ>(g−1)/g, the system demonstrates a continuous phase transition. In addition, the critical points of the networks with large dependence group sizes are not always larger than those with small group sizes. This means dependence group size is not the sole factor determining the robustness of
such networks.
fail, the dependence group will fail. So the networks can be easily destroyed in the form of the first order phase transition. That is to say, the dependence between nodes is strong. For a larger β, the nodes in a dependence group can keep more independence, so the network is more ro-bust. However, the type of percolation is always first order, unless the model reduces to the classic network percolation model. In other words, the tricritical point of our model only de-pends on the size of the dependence group. Furthermore, we find that larger dependence group size does not always make such networks more fragile, which is meaningful for understanding the robustness of the real networked system with dependence.
Author Contributions
Conceived and designed the experiments: ML BHW. Performed the experiments: HW LD. An-alyzed the data: HW ML. Wrote the paper: HW ML LD BHW.
References
1. Albert R, Barabasi AL. Statistical mechanics of complex networks. Reviews of Modern Physics. 2002; 74: 1–54. doi:10.1103/RevModPhys.74.47
2. Dorogovtsev S, Goltsev A, Mendes J. Critical phenomena in complex networks. Reviews of Modern Physics. 2008; 80: 1275–1335. doi:10.1103/RevModPhys.80.1275
3. Newman MEJ. Networks: An Introduction. Oxford University Press; 2010.
4. Albert R, Jeong H, Barabasi AL. Error and attack tolerance of complex networks. Nature. 2000; 406: 378. doi:10.1038/35019019PMID:10935628
5. Cohen R, Erez K, ben-Avraham D, Havlin S. Resilience of the Internet to random breakdowns. Physical Review Letters. 2000; 85: 4626. doi:10.1103/PhysRevLett.85.4626PMID:11082612
6. Callaway DS, Newman MEJ, Strogatz SH, Watts DJ. Network robustness and fragility: Percolation on random graphs. Physical Review Letters. 2000; 85: 5468. doi:10.1103/PhysRevLett.85.5468PMID: 11136023
7. Newman MEJ, Strogatz SH, Watts DJ. Random graphs with arbitrary degree distributions and their ap-plications. Physical Review E. 2001; 64: 026118. doi:10.1103/PhysRevE.64.026118
8. Bollobás B. Random Graphs. London: Academic; 1985.
9. Buldyrev SV, Parshani R, Paul G, Stanley HE, Havlin S. Catastrophic cascade of failures in interdepen-dent networks. Nature. 2010; 464: 1025–1028. doi:10.1038/nature08932PMID:20393559
10. Parshani R, Buldyrev SV, Havlin S. Critical effect of dependency groups on the function of networks. Proceedings of the National Academy of Sciences of the United States of America. 2011; 108: 1007–
1010. doi:10.1073/pnas.1008404108PMID:21191103
11. Bashan A, Parshani R, Havlin S. Percolation in networks composed of connectivity and dependency links. Physical Review E. 2011; 83: 051127. doi:10.1103/PhysRevE.83.051127
12. Bashan A, Havlin S. The combined effect of connectivity and dependency links on percolation of net-works. Journal of Statistical Physics. 2011; 145: 686–695. doi:10.1007/s10955-011-0333-5
13. Bashan A, Berezin Y, Buldyrev SV, Havlin S. The extreme vulnerability of interdependent spatially em-bedded networks. Nature Physics. 2013; 9: 667–672. doi:10.1038/nphys2727
14. Li M, Liu R-R, Jia C-X, Wang B-H. Critical effects of overlapping of connectivity and dependence links on percolation of networks. New Journal of Physics. 2013; 15: 093013. doi:10.1088/1367-2630/15/9/ 093013
15. Li M, Liu R-R, Jia C-X, Wang B-H. Cascading failures on networks with asymmetric dependence. EPL (Europhysics Letters). 2014; 108:56002. doi:10.1209/0295-5075/108/56002
16. Boccaletti S, Bianconi G, Criado R, del Genio CI, Gómez-Gardeñes J, Romance M, et al. The structure and dynamics of multilayer networks. Physics Reports. 2014; 544: 1–122. doi:10.1016/j.physrep. 2014.07.001
17. D’Agostino G, Scala A. Networks of networks: The last frontier of complexity. Berlin: Springer Interna-tional Publishing; 2014.
19. Son S-W, Grassberger P, Paczuski M. Percolation transitions are not slways sharpened by making net-works interdependent. Physical Review Letters. 2011; 107: 195702. doi:10.1103/PhysRevLett.107. 195702PMID:22181628
20. Zhou D, Bashan A, Cohen R, Berezin Y, Shnerb N, Havlin S. Simultaneous first- and second-order per-colation transitions in interdependent networks. Physical Review E. 2014; 90:012803. doi:10.1103/ PhysRevE.90.012803