A. Satoh et alii, Frattura ed Integrità Strutturale, 34 (2015) 397-405; DOI: 10.3221/IGF-ESIS.34.44
397 Focussed on Crack Paths
Improvement of adhesion performance of mortar-repair
interface with inducing crack path into repair
A. Satoh
Kumamoto University, Japan [email protected]
M. Satoh, K. Yamada
Akita Prefectural University, Japan
[email protected], [email protected]
ABSTRACT. The most important performance for repair materials is adhesion to the substrate. The authors
experimentally find out that high modulus fine aggregates in repair material enhance strength of it as well as the strength of the interface repaired with it, compared to the ordinary repair without fine aggregates. This paper elaborates the mechanisms for that with fractographic observation and FEM analysis based on the results of experiment. Also the authors discuss the ways for enhancing the strength and ductility of the repaired mortar.
KEYWORDS. Interface; Concrete; Repair; Strength; Ductility.
INTRODUCTION
he adhesive performance is one of the most important issues for applying repair materials to existing reinforced concrete structures. There should be many analytical studies for getting the fruitful results from experiments to achieve high performance of surface adhesion. Though there are so many experimental studies [1-3] which discuss enhancement of the strength of interface, there have been very few analytical studies on mortar (or concrete)-to-repair interface [4-6].
There are two ways already known for enhancing the interfacial performance: one is the surface roughness to be repaired and the other is the performance of the repair material. For the former point, it is a generally accepted idea that the roughness should be very large. The authors analytically revealed the roughness of the interface before repairing has the dominating effects to the adhesive performance [6]. Zhang experimentally revealed that the treated roughness of the surface to be repaired is best when the average height of the treated surface is half size of coarse aggregates [7].
But for the latter point, there is no accepted idea whether the strength of the repair material should be high or low. The authors investigated the composition and the performance of the repair material (polymer cement mortar) commercially available, and find out that it does not include fine aggregates and the strength of it is not so high [3]. It is a matter of course that the adhesion performance is limited to the weakest strength among the substrate, interface and the repair. Also the strength of the interface is below the strength of repair. But if the repair is too strong and the crack path extends along the interface, the fracture is very brittle, which should be avoided. Then the most favorable crack path extends in the repair with sufficient adhesive strength in the interface.
A. Satoh et alii, Frattura ed Integrità Strutturale, 34 (2015) 397-405; DOI: 10.3221/IGF-ESIS.34.44
398
This paper aims at obtaining such crack path with revealing the mechanisms for it with the help of fractographic observation and FEM analysis, which leads to enhancing the strength of the repair-substrate mortar (concrete). It also contributes to the improvement of ductility as well, because repair material can contain many types of fiber which can enhance ductility when the crack path extends in repair material. The concrete-repair interface is made of two interfaces: mortar-repair and coarse aggregate-repair interface. To simplify the problem, mortar-repair interface is addressed in this study, which is an outset of enhancement of mechanical performance of concrete-repair interface.
MECHANICAL PROPERTIES OF REPAIR AND REPAIRED MORTAR
he authors investigated the mechanical properties of repairs and the mortar specimens repaired with them. The dimension of the specimen is 40 x 40 x 160 mm. In the case of repaired specimens, half depth notch is incised in the center of the specimen, which is the interface between substrate and repair. The attributes of specimens are listed in Tab. 1, where 4 types of repair and 2 types of repaired ones are listed. The used aggregate is iron sand which is commercially available for steel shot grit (diameter is 0.1 mm) with low cost. The substrate is ordinary mortar whose Fb is 5.05 MPa and GF is 77.8 N/m. The roughening treatment for the surface to be repaired was conducted with 3 minutes of wire brushing after one day after the casting of the substrate. The mechanical properties are listed in Tab. 2 and 3 measured under the setup depicted in Fig.1.
From Tab. 2, one can see the clear tendency that Fb is dependent to Young’s modulus (E) but GF is not. E depends on the content of steel fiber and iron sand. FRRs in Tab. 3 are almost above 0.9 meaning the crack path extends in the repair. Though GF is almost the same in the two cases, Fb in the case with iron sand is about 8% higher than the case without it. Then it is suggested that Fb is improved with high modulus aggregate (iron sand) in both cases of the repair and the repaired mortar.
Name of Volume fraction (-)
Type specimen W/C Steel fiber Aggregate
Repair C4S-1,2,3 0.4 0.00 0.00
material C4S10-1,2,3 0.4 0.01 0.00
CS-1,2,3 0.5 0.00 0.00
CS10-1,2,3 0.5 0.01 0.00
CS10Fa10-1,2,3 0.5 0.01 0.10
Repaired H2dC4S10Fa10-1,2,3 0.4 0.01 0.10
mortar H2dC4S10-1,2,3 0.4 0.01 0.00
Figure 1: Specimen and test setup. Table 1: Attributes of repairs used for specimens.
Name of GF (N/mm) Fb (MPa) Young's Bulk
Type specimen Data Average Data Average modulus (GPa) density
Neat repair C4S-1 0.006 1.621
(W/C=0.4) C4S-2 0.006 0.006 1.494 1.528 14.00 2.13
C4S-3 0.006 1.468
Repair C4S10-1 2.571 6.757
with fiber C4S10-2 2.755 2.426 7.630 7.136 15.86 2.19
C4S10-3 1.953 7.021
Neat repair CS-1 0.005 0.910
(W/C=0.5) CS-2 0.005 0.005 0.949 0.930 13.96 2.08
CS-3 (-) (-)
Repair CS10-1 2.739 4.890
with fiber CS10-2 2.064 2.247 4.303 4.347 15.82 2.14
CS10-3 1.938 3.848
Repair CS10Fa10-1 2.308 5.488
with fiber CS10Fa10-2 2.430 2.353 5.180 5.723 32.56 2.66
and aggregate CS10Fa10-3 2.321 6.500
Table 2: Mechanical properties of repair materials.
A. Satoh et alii, Frattura ed Integrità Strutturale, 34 (2015) 397-405; DOI: 10.3221/IGF-ESIS.34.44
399
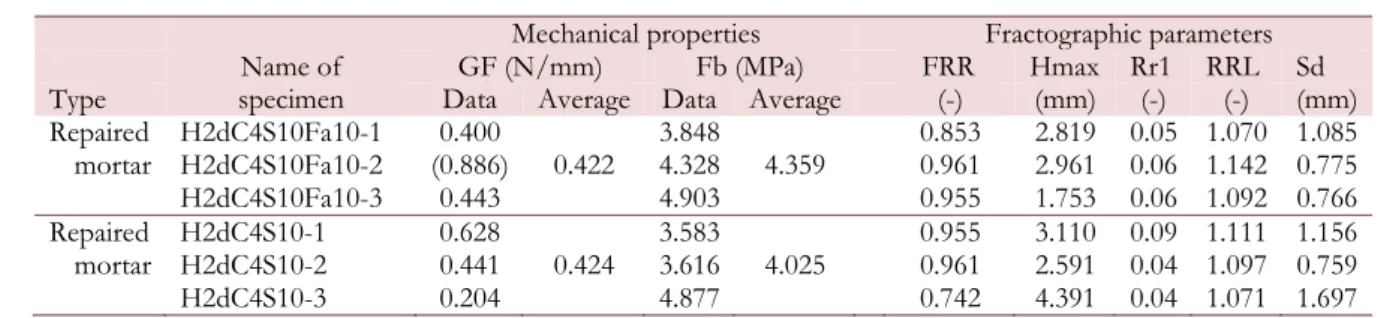
Mechanical properties Fractographic parameters
Name of GF (N/mm) Fb (MPa) FRR Hmax Rr1 RRL Sd
Type specimen Data Average Data Average (-) (mm) (-) (-) (mm)
Repaired H2dC4S10Fa10-1 0.400 3.848 0.853 2.819 0.05 1.070 1.085
mortar H2dC4S10Fa10-2 (0.886) 0.422 4.328 4.359 0.961 2.961 0.06 1.142 0.775
H2dC4S10Fa10-3 0.443 4.903 0.955 1.753 0.06 1.092 0.766
Repaired H2dC4S10-1 0.628 3.583 0.955 3.110 0.09 1.111 1.156
mortar H2dC4S10-2 0.441 0.424 3.616 4.025 0.961 2.591 0.04 1.097 0.759
H2dC4S10-3 0.204 4.877 0.742 4.391 0.04 1.071 1.697
Table3: Mechanical properties of repaired mortar specimens.
MODELING FROM OBSERVATION OF CONCRETE-REPAIR INTERFACE
he authors observed mortar-repair interface with employing SEM (Scanning Electron Microscope) from the sample cut from H2dC4S10Fa10-3 after fracture toughness test. It is the adhered part made of 2 regions: the left side in Fig. 2 is substrate and the right is repair (C4S10Fa10). From Fig. 2(a), black line is recognized along the interface, and white small dots (iron sand) and a large oval (steel fiber) is observed. Fig. 2(b) is a color map of Ca, measured with EPMA, where concentration of Ca is recognized along the interface caused by the bleeding in repair. Fig. 2(c) is a close-up BSI near interface, where the upper right is substrate and lower left is repair. There is a thick layer of CH with the thickness of 50 m. It is judged that the black line in Fig. 2(a) is the layer of CH judged from Fig. 2(b) and (c).
(a) BSI near interface. (b) Color map of Ca. (c) Close-up BSI near interface.
Figure 2: SEM observation of Specimen (H2dC4S10Fa10-3) near interface.
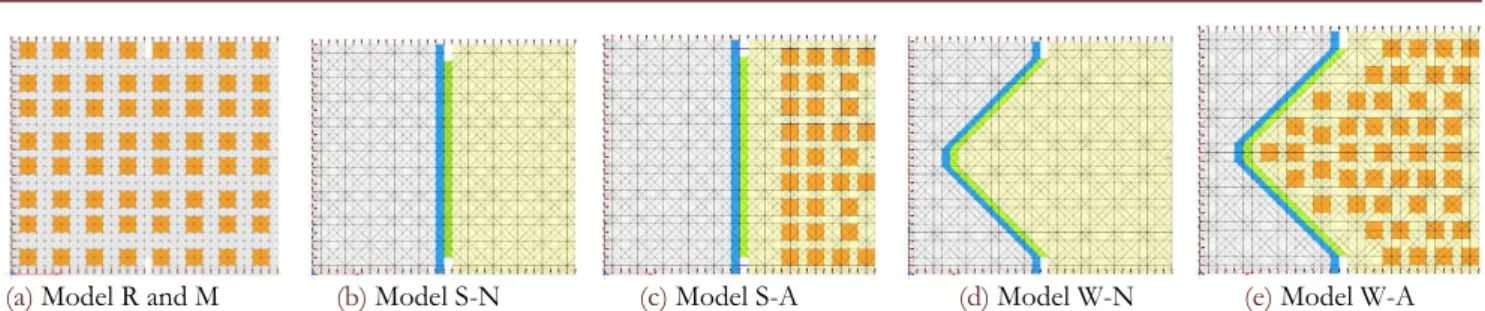
It is also known that there is a wall effect near an interface where smaller particles gather and large ones are scarce. Then the authors made FEM models according to the above-mentioned observations depicted in Fig. 3. LB and LWE in Fig. 3 are a layer of bleeding and a layer of wall effect respectively.
Model M and R are monolithic repair with different material properties: M has the properties for ordinary mortar and R for repair with lower strength and higher ductility from the inclusion of fiber. Model S-N and S-A have two layers of straight interface (LB and LWE), and only S-A has 31 particles of aggregates. Model W-N and W-A have two layers of crooked interface, and only W-A has 46 particles of aggregates. Left side of the interface models is substrate mortar.
Figure 3: Three models for FEM analysis.
T
Substrate
Substrate
Repair
Repair Interface
CH along interface Iron sand
Substrate
Repair Interface
A. Satoh et alii, Frattura ed Integrità Strutturale, 34 (2015) 397-405; DOI: 10.3221/IGF-ESIS.34.44
400
(a) Model R and M (b) Model S-N (c) Model S-A (d) Model W-N (e) Model W-A
Figure 4: FEM models with a dimension of 5.6 x 6.4 mm which consists of triangle elements sized 0.2 mm (bottom) and 0.1 mm (height). At the top and bottom they have notches of 0.4 mm depth. The aggregate is sized in 0.4 x 0.4 mm.
ANALYSIS OF MODEL R AND M
he authors analyzed Model R and M. Tab. 4 and Fig. 5 exhibit the material properties of the elements, which were obtained from the reference [8]. Aggregate in Tab. 4 has three different material properties from void to iron. The authors assumed that void is made with resin bead, then the material property for it is rather large not zero. Tab. 5 shows the features of the models, where one can see each model has a different modulus from 10 GPa to 70.4 GPa. The analyzed stress-deformation response is depicted in Fig. 6. Reflecting the brittle nature of the mortar matrix, the response for Model M is brittle compared to the response for Model R. The important point is that strength for Model M is dependent to the Young’s modulus in the case of Model M (Fig. 6(a)). But in the case of ductile matrix (Model R), Model R-I and R-S have almost the same strength.
Though tensile strength of mortar is 7.21 MPa, the response even for M-I is far below it (5.32 MPa). In the case of Model R, the response for R-I and R-S is almost the same for the tensile strength of matrix. These facts derives from the ductility of the matrix. It means that the brittle matrix fractures when small part of the ligament reaches its tensile strength, whereas the ductile one fractures when almost all part of the ligament reaches its tensile strength with the help of ductility. Then the high modulus aggregates are effective in the case of brittle matrix, and not effective for the ductile matrix. It is worthy to note that 28.6% of void decreases the strength about 50% ( 42% for M-V and 53% for R-V). The reason for it derives from the fact that length of the matrix part is 2.4 mm in the total length of crack path (4.8 mm).
Young's modulus Poisson ratio
Name (GPa) ( - )
Matrix: Mortar 14.0 0.2
Repair material 18.7 0.2
Aggregate: Iron 200.0 0.3
Sand 39.0 0.2
Void 0.08 0.35
Table 4: Material properties of the elements. Figure 5: Tension softening diagram of mortar and repair.
Model Matrix Aggregate Volume fraction (%) Averaged Young's modulus
Matrix Aggregate Notch (GPa)
M-I
Mortar
Iron
71.0 28.6 0.4
67.1
M-S Sand 21.1
M-V Void 10.0
M None 14.0
R-I
Repair material
Iron 70.4
R-S Sand 24.4
R-V Void 13.3
R None 18.7
Table 5: Features of the monolithic models for FEM analysis.
T
0.0 1.0 2.0 3.0 4.0 5.0 6.0 7.0 8.0
0 0.01 0.02 0.03 0.04 0.05
σ
t (MP
a)
ε
Repair material
A. Satoh et alii, Frattura ed Integrità Strutturale, 34 (2015) 397-405; DOI: 10.3221/IGF-ESIS.34.44
401
0 1 2 3 4 5 6
0 0.001 0.002 0.003 0.004 0.005
St
res
s
(N
/m
m
2)
Deformation (mm) M M-I M-S M-V
0 1 2 3 4 5 6
0 0.001 0.002 0.003 0.004 0.005
Str
ess
(N/
m
m
2)
Deformation (mm) R R-I R-S R-V
(a) Response of Model M with the properties for mortar. (b) Response of Model R with the properties for repair.
Figure 6: Analyzed stress-deformation response for monolithic models.
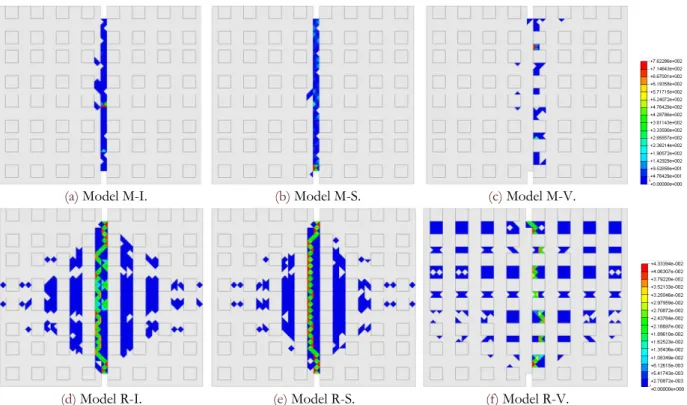
Fig. 7 represents the crack distribution at the final stage of fracture. Though the final crack path is the straight one in all the cases in Fig. 7, the distribution of cracked element is very wide spread in the case of ductile matrix. Crack distribution of Model R-V is wider than Model R-I and R-S helped with voids, making the response weak and ductile.
(a) Model M-I. (b) Model M-S. (c) Model M-V.
(d) Model R-I. (e) Model R-S. (f) Model R-V.
Figure 7: Crack distribution in models at the final stage of fracture.
ANALYSIS OF MODEL S AND W
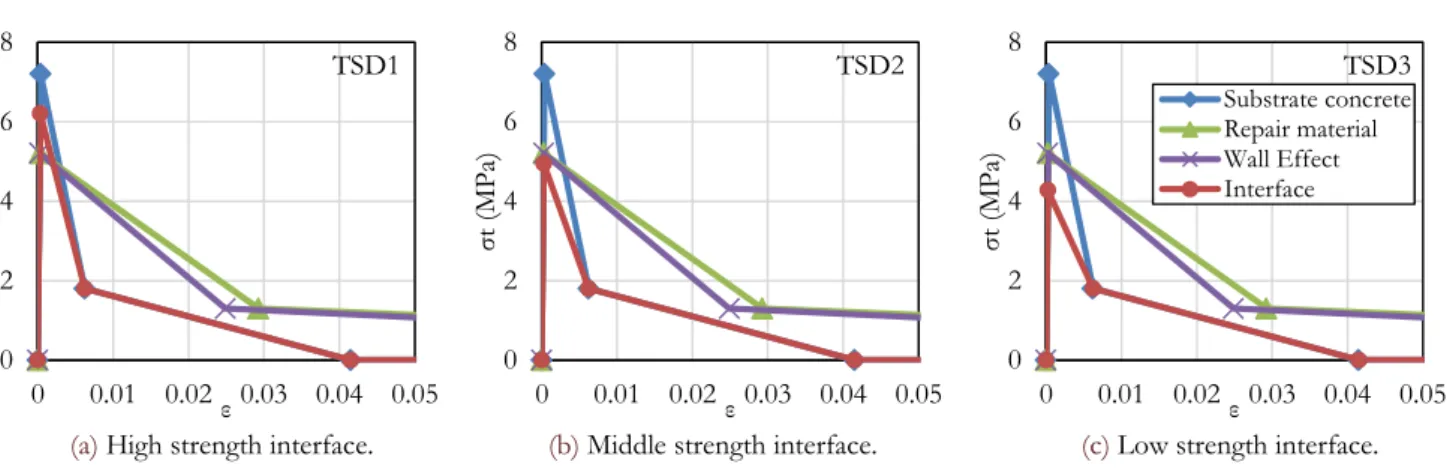
he authors analyzed Model S and W. The material property of the interface is different with 3 types: TSD1, TSD2 and TSD3, which are depicted in Fig. 8. The tensile strength of interface (LB) in TSD is varied from 6.21 MPa (average of the strength of substrate and repair) through 4.95 MPa (95% of the strength of repair) to 4.278 MPa (82% of the strength of repair). Strength of layer of wall effect (LWE) is the same as repair (5.21 MPa), but more brittle than repair. Type N model has no iron aggregate whereas Type A has iron aggregate as shown in Fig. 4.
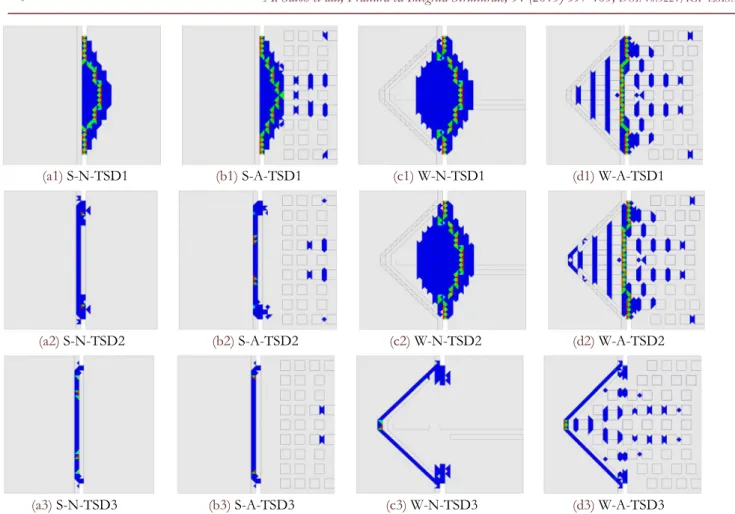
The response is depicted in Fig. 9. The responses of TSD1 in Fig. 9(a) are almost the same each other, because repair is ductile and the crack path mainly extends in repair (See Fig. 10(a1) to Fig. 10(d1)). Then the effects of high modulus aggregates do not appear in the same way as discussed in the former chapter regarding the strength of Model R.
A. Satoh et alii, Frattura ed Integrità Strutturale, 34 (2015) 397-405; DOI: 10.3221/IGF-ESIS.34.44 402 0 2 4 6 8
0 0.01 0.02 0.03 0.04 0.05
σ t ( M P a) ε TSD1 0 2 4 6 8
0 0.01 0.02 0.03 0.04 0.05
σ t ( M P a) ε TSD2 0 2 4 6 8
0 0.01 0.02 0.03 0.04 0.05
σ t ( M P a) ε TSD3 Substrate concrete Repair material Wall Effect Interface
(a) High strength interface. (b) Middle strength interface. (c) Low strength interface.
Figure 8: TSDs for matrix element used for FEM analysis.
But in the case of TSD2, the responses of Model S and Model W are very different. It means that Model S has a brittle behavior reflecting the straight crack path along the interface shown in Fig. 10(a2) and (b2), whereas the crack paths for Model W-N and W-A (Fig. 10 (c2) and (d2)) are the same as depicted in Fig. 10(c1) and (d1).
In the case of TSD3, the crack paths for Model W-N and W-A extends along the crooked interface as shown in Fig. 10(c3) and (d3). Then the response is determined by the brittle behavior of interface. Reflecting the total length of crack path of Model W, which is 1.379 times of Model S, strength of Model W is about 1.15 (1.13 for W-N and 1.16 for W\A) times of Model S.
In all the cases which include aggregates (S-A and W-A), some cracks appear along the aggregates located far from the center. But the response is not so different from that of the blank cases. The reason for that may be the orderly location of the aggregates.
0 1 2 3 4 5 6
0 0.0025 0.005 0.0075 0.01
Stres s (N/mm 2) Deformation (mm) 0 1 2 3 4 5 6
0 0.0025 0.005 0.0075 0.01
Stres s (N/mm 2) Deformation (mm) 0 1 2 3 4 5 6
0 0.0025 0.005 0.0075 0.01
St res s (N /m m 2) Deformation (mm) S-N-TSD3 S-A-TSD3 W-N-TSD3 W-A-TSD3
(a) Response for TSD1. (b) Response for TSD2. (c) Response for TSD3.
Figure 9: Analyzed stress-deformation response for models with interface layers.
ENHANCEMENT OF MECHANICAL PROPERTIES
For repair material
ig. 11 represents the relationship between mechanical properties or between some features and Ft of monolithic repair. In Fig. 11(a), it is shown that the effect of void (inclusion of 28.6%) is more detrimental to GF in the case of ductile matrix which decreases 44% than in the case of brittle matrix which decreases 36%. In Fig. 11(b), it is shown that high modulus aggregates have a positive effect to strength in the analyzed case of brittle matrix as mentioned before. Also this agree with the experimental results depicted in Fig. 12. Ft is also dependent to RL, which is shown in Fig. 11(c). This is the same results as discussed in a reference [8]. Though the effect of RL to repair is eminent, the effect to the repaired mortar with interface is not so clear because of the many material properties involved in the crack path.
A. Satoh et alii, Frattura ed Integrità Strutturale, 34 (2015) 397-405; DOI: 10.3221/IGF-ESIS.34.44
403
(a1) S-N-TSD1 (b1) S-A-TSD1 (c1) W-N-TSD1 (d1) W-A-TSD1
(a2) S-N-TSD2 (b2) S-A-TSD2 (c2) W-N-TSD2 (d2) W-A-TSD2
(a3) S-N-TSD3 (b3) S-A-TSD3 (c3) W-N-TSD3 (d3) W-A-TSD3
Figure 10: Crack distribution in models at the final stage of fracture.
0.0 5.0 10.0 15.0 20.0
0.0 1.0 2.0 3.0 4.0 5.0 6.0
GF
(N
/
m
)
Ft(N/mm2)
M-I M-S
M-V R-I
R-S R-V
0.0 1.0 2.0 3.0 4.0 5.0 6.0
0 25000 50000 75000 100000
Ft(N/
m
m
2)
Averaged Young's modulus (MPa)
M-I M-S
M-V R-I
R-S R-V
0.0 1.0 2.0 3.0 4.0 5.0 6.0
4.5 5.0 5.5 6.0
Ft(N/
m
m
2)
RL (mm)
M-I M-S
M-V R-I
R-S R-V
(a) Relationship between Ft and GF. (b) Relationship between E and Ft. (c) Relationship between RL and Ft.
Figure 11: Relationship between mechanical properties or between features of repair and Ft.
A. Satoh et alii, Frattura ed Integrità Strutturale, 34 (2015) 397-405; DOI: 10.3221/IGF-ESIS.34.44
404
For repaired mortar with interface
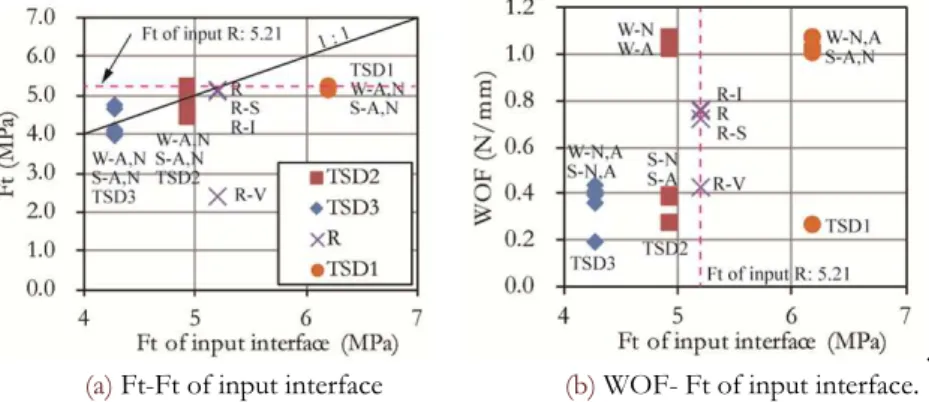
Fig. 13 represents the relationship between respondent Ft (or GF) and Ft of interface which is the input used for FEM analysis. X-axis in Fig. 13 represents the input and Y-axis represents the response including the plots of monolithic ones (R, R-S, R-I, R-V, TSD1, TSD2 and TSD3). It is natural that the responses of the repaired mortar (W-N, A and S-N, A) cannot exceed the response of R even though the input Ft for interface is stronger than that of R (See Fig. 13(a)). It agree with the weakest chain model for strength: the weakest part among substrate, interfaces and repair fractures.
But for WOF, the responses of the repaired mortar (W-N, A and S-N, A) can exceed the response of R. It derives from the energy dissipation by the existence of the interface. But if the interface is too weak, the respondent WOF is far below that of R. It is clear that the roughness of the interface is very effective when property of interface is TSD2 shown in Fig. 13(a) and (b). But the roughness of interface has little effect in the cases that have higher or far-lower strength than that of R (See Fig. 13(b)). If we compare the experimental results in Tab. 2 and 3, the strength of repaired mortar (4.025 for average) is far-lower than that of repair (7.136 MPa for average). This correspond to the relationship between the case R and the case depicted in the leftmost (W-N, S-N) in Fig. 13(a).
Then it is suggested that the strength of the interface should be close to that of the repair to achieve high strength and high ductility. The roughness of the interface is especially effective for the ductility in that case. Even in the case that the interface is stronger than the repair, strength is limited to the repair. But the ductility is high even in the case of flat interface (S-A, N), if the interface is stronger than repair.
.
(a) Ft-Ft of input interface (b) WOF- Ft of input interface.
Figure 13: Relationship between Ft (or WOF) and Ft of interface for repaired mortar.
CONCLUSIONS
he experimental results of repair material and mortar-repair interface are verified with FEM analysis. Also FEM analysis suggests the clues for further enhancing the performance of the repaired interface. The findings are as follows.
- High modulus fine aggregates in repair material enhance strength of it especially in the case of brittle matrix. Also they enhance the strength of the interface repaired with it due to the induced crack path into repair.
- The strength of the interface should be close to that of the repair or higher than repair to achieve high strength and high ductility. Even in the case that the interface is stronger than the repair, strength is limited to the repair.
- The roughness of the interface is effective for the mechanical performance in the case where the strength of interface is close to that of repair. But the ductility is high even in the case of flat interface, if the interface is stronger than repair.
REFERENCES
[1] Kamiya, Y. et. al., Performances of a new repair material, Ahma Series. Report of Mitsubishi Material Research Center., 14 (2013) 81–90.
[2] Kunieda, M. et. al., Effects of repairing with surface protection liner employing ultrahigh strength strain-hardening mortar, Transactions of repair, reinforcing & upgrade for concrete structures.,12 (2012) 31–38.
A. Satoh et alii, Frattura ed Integrità Strutturale, 34 (2015) 397-405; DOI: 10.3221/IGF-ESIS.34.44
405 [3] Yamada, K., Ishiyama, S., Satoh, A., A discussion on enhancement of mechanical properties of concrete- polymer
cement mortar interface, Transactions of Architectural Institute of Japan, Tohoku Branch., 76 (2013) 159–162.
[4] Satoh, A., Yamada, K., Ishiyama, S., Simplified two-dimensional mesoscopic model for evaluating mechanical properties and crack paths near interfaces in concrete, Engineering Fracture Mechanics., 108 (2013) 222–237.
[5] Satoh, A., Yamada, K., Ishiyama, S., A discussion on major factors affecting crack path of concrete-to-concrete interfacial surfaces, Engineering Fracture Mechanics., 77 (2010) 2168–2181.
[6] Satoh, A., Yamada, K., Shinohara, Y., Simulation of Adhesion Performance of Mortar-Mortar Interface with Varied Fractographic Features, Key Engineering Materials, Advances in Fracture and Damage Mechanics XII., 577–578 (2014) 357–360.
[7] Zhang, D. W., Furuichi, H., Ueda, T., Optimum treatment of PCM-concrete interfaces, Proceedings of FraMCoS-7., (2012) 1227–1232.
[8] Satoh, A., A new concept for heterogeneity-based fractography of concrete, Doctoral dissertation, Akita prefectural university, Japan (2012).
NOMENCLATURE
BSI: Back scattered electron image CH: Calcium hydroxide
E: Young’s modulus of elasticity (GPa or MPa) EPMA: Electron probe micro analyzer
FEM: Finite element method for analysis
FRR: Fraction of the area fractured in repair divided by the total area ( - ) Fb: Flexural strength (MPa)
Ft: Tensile strength (MPa)
GF: Fracture energy (N/mm or N/m)
Hmax: Maximum height in the surface from the average height (mm) LB: Layer of bleeding in interface
LWE: Layer of wall effect
RL: Total path length along the crack path (mm)
RRL: Ratio of the length measured along the crack path divided by the projected length (- )
Rr1: Fraction of the area where the local radius of the curvature is under 1 mm divided by the total area ( - ) SEM: Scanning electron microscope
Sd: Standard deviation of the height on the fractured surface (mm) TSD: Tension softening diagram
W/C: Water to cement ratio (-)