Introduction
Benzoic acid and some of its derivatives are used as conservant, catalyst precursors of polymers, in pharmaceutical industries, beyond other applications. A survey of literature shows that the complexes of rare earth and d-block ele-ments with benzoic acids and some of its deriva-tives have been investigated in aqueous solutions and in the solid state.
In aqueous solutions, the papers reported the thermodynamics of complexation of lan-thanides by some benzoic acid derivatives [1], the spectroscopic study of trivalent lanthanides with several carboxylic acids including benzoic acid [2], the influence of pH, surfactant and synergic agent on the luminescent properties of terbium chelates with benzoic acid derivatives [3], the thermody-namic of complexation of lanthanides by benzoic and isophthalic acids [4] and the synthesis, crystal structure and photophysical and magnetic proper-ties of dimeric and polymeric lanthanide complex-es with benzoic acid and its derivativcomplex-es [5].
In the solid state the papers reported the thermal stability and thermal decomposition of thorium salts with several organic acids, including 4-methoxybenzoic acid [6], as well as benzoic and m-hydroxybenzoic acids [7]; the thermal decom-position of nickel benzoate and of the nickel salt of ciclohexane carboxylic acid [8]; the thermal and spectral behaviour on solid compounds of ben-zoates and its methoxy derivates with rare earth elements [9-16]; the vibrational and electronic spectroscopic study of lanthanides and effect of sodium on the aromatic system of benzoic acid [17, 18]; the reaction of bivalent cooper, cobalt and nickel with 3-hidroxy-4-methoxy and 3-methoxy-4-hidroxybenzoic acids and a structure for these compounds has been proposed on the basis of spectroscopic and thermogravimetric data [19]; the thermal decomposition of thorium salts of benzoic and 4-methoxybenzoic acids in air atmosphere [20]; the thermal and spectral behaviour on solid compounds of 5-chloro-2-methoxybenzoate with rare earth and d-block elements [21-24]; the syn-thesis and characterization of
2,3-dimethoxyben-www.scielo.br/eq
Volume 31, número 1, 2006
Synthesis, characterization and thermal behaviour of
solid-state compounds of 4-methoxybenzoate with lanthanum
(III) and trivalent lighter lanthanides
E. C. Rodrigues1, A. B. Siqueira1, E. Y. Ionashiro1, G. Bannach1and M. Ionashiro1
1Instituto de Química, UNESP, C. P. 355, CEP 14801 – 970 Araraquara, SP, Brazil
Abstract:Solid-state M-4-MeO-Bz compounds, where M stands for trivalent La, Ce, Pr, Nd and Sm and 4-MeO-Bz is 4-methoxybenzoate, have been synthesized. Simultaneous thermogravimetry and differential thermal analysis (TG-DTA), differential scanning calorimetry (DSC), X-ray powder diffractometry, infrared spectroscopy and complexometry were used to characterize and to study the thermal behaviour of these compounds. The results led to information about the composition, dehydration, polymorphic trans-formation, ligand’s denticity, thermal behaviour and thermal decomposition of the isolated compounds.
zoates of heavy lanthanides and yttrium [25]; the thermal studies on solid compounds of phenyl sub-stituted derivates of benzyllidenepyruvates with several metal ions [26, 27]; the spectral and mag-netic studies of 2-chloro-5-nitrobenzoates of rare earth elements [28] and thermal behaviour of solid state 4-methoxybenzoates of some bivalent transi-tion metal ions [29].
In this work 4-methoxybenzoates of La(III), Ce(III), Pr(III), Nd(III) and Sm(III) were synthetized. The compounds were investigated by means of infrared spectroscopy, X-ray powder diffractometry, simultaneous thermogravimetry and differential thermal analysis (TG-DTA), dif-ferential scanning calorimetry (DSC) and other methods of analysis.
Experimental
The 4-methoxybenzoic acid (4-MeO-HBz) 98% was obtained from Acros Organics and puri-fied by recrystallization. Aqueous solution of Na-4-MeO-Bz 0.1 mol L-1was prepared from aqueous
4-MeO-HBz suspension by treatment with sodium hydroxide solution 0.1 mol L-1. Lanthanum and
lanthanide chlorides were prepared from the corre-sponding metal oxides (except for cerium) by treatment with concentrated hydrochloric acid. The resulting solutions were evaporated to near dryness, the residues were again dissolved in dis-tilled water, transferred to a volumetric flask and diluted in order to obtain ca. 0.1 mol L-1 solutions,
whose pH were adjusted to 5.5 by adding diluted sodium hydroxide or hydrochloric acid solutions. Cerium (III) was used as its nitrate and ca. 0.1 mol L-1 aqueous solutions of this ion were prepared by
direct weighing of the salt. The solid state com-pounds were prepared by adding slowly, with con-tinuous stirring, the solution of the ligand to the respective metal chloride or nitrate solutions, until total precipitation of the metal ions. The precipi-tates were washed with distilled water until elimi-nation of the chloride (or nitrate) ions, filtered through and dried on Whatman no42 filter paper,
and kept in a desiccator over anhydrous calcium chloride, under reduced pressure to constant mass. In the solid state compounds, hydration water, ligand and metal ion contents were
deter-mined from TG curves. The metal ions were also determined by complexometric titrations with standard EDTA solution, using xylenol orange as indicator [30, 31].
X-ray powder patterns were obtained by using a Siemens D-5000 X-ray diffractometer, employing Cu Kα radiation (λ = 1.541 ) and settings of 40 kV and 20 mA.
Infrared spectra for Na-4-MeO-Bz as well as for its metal-ion compounds were run on a Nicolet model Impact 400 FT-IR instrument, within the 4000-400 cm-1 range. The solid
sam-ples were pressed into KBr pellets.
Simultaneous TG-DTA curves were obtained with thermal analysis system model SDT 2960 from TA Instruments. The purge gas was an air flow of 100 mL min-1. A heating rate
of 20 ºC min-1was adopted with samples
weigh-ing about 7 mg. Platinum crucibles were used for recording the TG-DTA curves.
DSC curves were obtained with thermal analysis systems model DSC 25 from Mettler Toledo. The purge gas was an air flow of 100 mL min-1. A heating rate of 20ºC min-1 was adopted
with samples weighing about 5 mg. Aluminium crucibles, with perforated cover, were used for recording the DSC curves.
Computational strategy. Calculation of the theoretical infrared spectrum of lanthanum 4-methoxybenzoate is necessary to evaluate the structure and wave function computed by the ab initio SCF Hartree-Fock-Roothan method [32] using a split valence (lanL2DZ) basis set [33-36]. The performed molecular calculations in this work were done by using the Gaussian 98 routine [37] and the hardware used was IBM power 3. The geometry optimization was carried out with-out any constraints. The molecule of 4-methoxy-benzoate contain rings with conformational flex-ibility, all variables were optimized. The opti-mization proceeded make uniformly when all variables were optimized.
Results and discussion
in agreement with the general formula ML3.nH2O, where M represents trivalent La, Ce,
Pr, Nd or Sm, Lis 4-methoxybenzoate and n=2;
1.5; 2; 2.5 and 0, respectively.
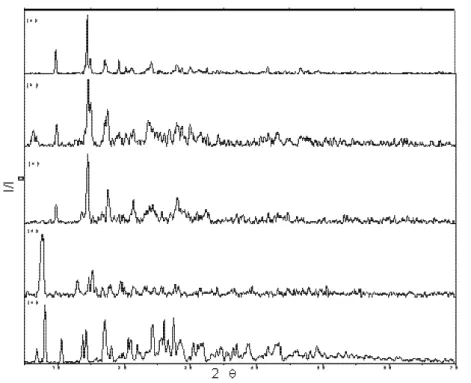
The X-ray diffraction powder patterns (Fig. 1) show that all the compounds have a crys-talline structure and only the La and Pr show evi-dence for formation of isomorphous compounds.
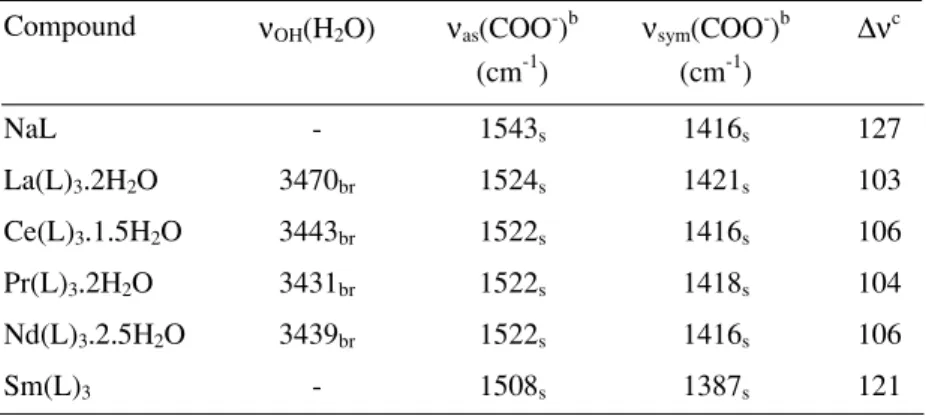
Infrared spectroscopic data on 4-methoxy-benzoate and its compounds with trivalent metal ions considered in this work are shown in Table 2. The investigation was focused mainly within the 1700–1400 cm-1 range because this region is
potentially most informative to assign coordina-tion sites. In the sodium 4-methoxybenzoate,
strong bands located at 1543 cm–1 and 1416 cm–1
are attributed to the anti-symmetrical and sym-metrical frequencies of the carboxylate groups, respectively [38,39]. In the compounds consid-ered in this work analysis of the frequencies of the νasand νsym (COO-) bands shows that the
lan-thanides are linked to the carboxylic group by a bidentate bond with an incomplete equalization of bond lengths in the carboxylate anion; this is in agreement with the literature [40].
The theoretical infrared spectrum of anhy-drous lanthanum compound was calculated by using a harmonic field [41] and the obtained frequencies were not scaled. The geometry optimization was computed by the optimized algorithm of Berny [42]. Table 1. Analytical and thermoanalytical (TG) data of the compounds.
Metal/% Loss/% Water%
Compounds Calcd. EDTA TG Calcd. TG Calcd. TG
Residuea
La(L)3.2H2O 22.11 22.28 22.04 68.34 68.30 5.74 5.85 La2O3
Ce(L)3.1.5H2O 22.58 22.23 22.26 67.91 68.26 4.36 4.40 CeO2
Pr(L)3.2H2O 22.35 22.44 22.37 67.28 67.32 5.72 5.66 Pr6O11
Nd(L)3.2.5H2O 22.44 22.25 22.65 66.82 66.98 7.04 6.60 Nd2O3
Sm(L)3 24.90 25.01 25.34 71.12 70.62 - - Sm2O3
L means 4-methoxybenzoate
a all residues were confirmed by X-ray powder diffractometry
Table 2. Spectroscopic data for sodium 4-methoxybenzoate and compounds with some trivalent íons.a
Compound νOH(H2O) νas(COO-)b (cm-1)
νsym(COO-)b (cm-1)
∆νc
NaL La(L)3.2H2O
Ce(L)3.1.5H2O
Pr(L)3.2H2O
Nd(L)3.2.5H2O
Sm(L)3
-3470br
3443br
3431br
3439br
-1543s
1524s
1522s
1522s
1522s
1508s
1416s
1421s
1416s
1418s
1416s
1387s
Figure 1. X-ray powder diffraction patterns of the compounds (a) La(L)3.2H2O; (b) Ce(L)3.1.5H2O; (c) Pr(L)3.2H2O (d) Nd(L)3.2.5H2O (e) Sm(L)3; (L=4-methoxybenzoate).
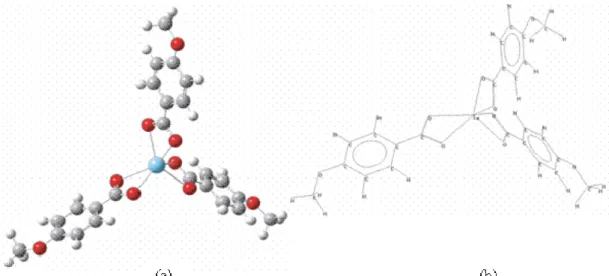
The obtained geometry from calculations is present-ed in Figure 2 and Table 3. The theoretical infrarpresent-ed spectrum (electronic state 1A) was obtained with
frequency values (cm-1), relative intensities,
assign-ments and description of vibrational modes. A com-parative analysis between the experimental and the-oretical spectrum shows the following conclusions: (a) the first assignment shows a strong contribution at 1524 cm-1suggesting a ν
asym(COO-) assignment, while the theoretical results show the corresponding peak at 1550 cm-1with discrepancies of 1.7 % (b) the
second assignment shows a strong contribution at 1421 cm-1 suggesting a ν
sym(COO-) assignment, while the theoretical results show the corresponding peak at 1410 cm-1with discrepancies of 0.8% (c) the
third assignment shows both experimental and theo-retical ?νvalues (νasym(COO-)-ν
sym(COO-)) are near of the sodium methoxybenzoate ?νvalue (?νNa = 127; ?νexp= 103; ?νTheor= 140) , reinforcing the sug-gestion that the compounds considered in this work the metal ions are linked to the carboxylic group by a bidentate bond.
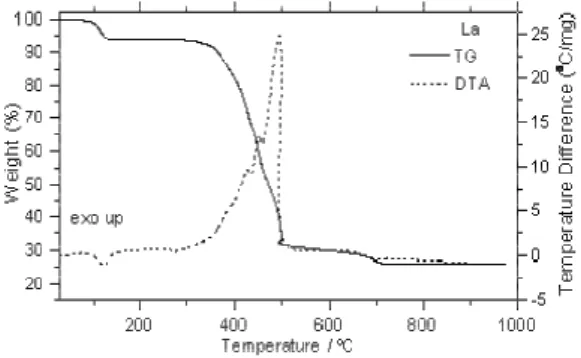
Simultaneous TG-DTA curves of the com-pounds are shown in Figs 3, 6-9. These curves show mass losses in steps, corresponding to endothermic peaks due to dehydration and crys-talline transition or exothermic peaks attributed to oxidation of the organic matter. In all the TG-DTA curves, the mass loss profile shows that the sample temperature is greater than the oven temperature, indicating that the oxidation of the organic matter is accompanied by the combustion. The thermal sta-bility of the anhydrous compounds as well as the thermal behaviour of the compounds is heavily dependent on the nature of the metal ion as shown by the TG-DTA curves, and so the features of each compound are discussed individually.
hydration water; it reflects the loss of 2H2O (Calcd. = 5.74%; TG = 5.85%). The anhydrous compound is stable up to 285oC, and above this
temperature the mass loss occurs in two steps. The
first mass loss observed between 285 and 490oC,
corresponding to an exotherm with three peaks at 430, 455 and 490owith loss of 62.89% is attributed
to the oxidation of the organic matter. In this step
Figure 2. Proposed structure 3D (a) and 2D (b) of solid-state anhydrous compound lanthanum (III)
with 4-methoxybenzoate (Gaussian 98).
Table 3.Theoretical geometries parameters of La(L)3anhydrous compound.
d La – OCOO- 2.54 Å
d CCOO-− OCOO- 1.29 Å
d CCOO-– Cring 1.46 Å
d Cr – Cring 1.39 Å
d Cring – Hring 1.07 Å
d Cring – OMeO 1.37 Å
d CMeO – OMeO 1.44 Å
d CMeO – HMeO 1.08 Å
d CMeO – CMeO 16.32 Å
< OCOO- – CCOO- – OCOO- 116.63º
< OCOO- – La – OCOO- 64.34o
< CMeO – La – CMeO 30.56º
< Cring – OMeO – CMeO 121.88o
< Cring – Cring – Cring 120.55º
< OCOO- – CCOO- – Cring 121.69o
Key: La = lanthanum; L=4-methoxybenzoate; d = atoms distance; < = atoms angle; COO- =
the TG-DTA profiles show that the oxidation is accompanied by combustion with the formation of carbonaceous residue and intermediate compound derivative of carbonate. Tests with hydrochloric acid solution on samples heated up to 500oC,
con-firmed the elimination of CO2and presence of car-bonaceous residue. The last step that occurs between 490 and 720oC, corresponding to the both
small exotherm followed by an endotherm with loss of 5.41% are attributed to oxidation of the car-bonaceous residue and thermal decomposition of the intermediate, leading to the lanthanum oxide, La2O3. The small endothermic peak at 272oC,
without mass loss in the TG curves, is due to the enantiotropic polymorphic transformation, which was confirmed by X-ray powder diffraction pat-terns (Fig.4) and TG-DTA curves (Fig.5).
Figure 3. TG-DTA curves of La(L)3.2H2O (L=4-methoxybenzoate); m = 6.8678 mg.
Figure 4. X-ray powder diffraction patterns of the: a) La(L)3.2H2O; b) La(L)3.2H2O heated up to 280oC.
Figure 5. TG-DTA curve of heating and cooling
of the compound La(L)3.2H2O.
Cerium compound. The simultaneous TG-DTA curves are shown in Fig. 6. These curves show mass losses in three steps, between 58 and 417oC. The first mass that occurs up to 122oC,
cor-responding to an endothermic peak at 110oC is due
to the dehydration with loss of 1.5H2O (Calcd. = 4.36%, TG = 4.40%). The anhydrous compound is stable up to 260oC, and above this temperature the
thermal decomposition occurs in two overlapping steps between 260-350oC and 350-417oC with
loss-es of 10.88% and 57.38%, rloss-espectively corrloss-espon- correspon-ding to an exothermic peak at 417oC attributed to
the oxidation reaction of Ce(III) to Ce(IV), togeth-er with the oxidation of the organic matttogeth-er. The TG-DTA profiles, also show that the oxidation of the organic matter is accompanied by combustion, and the final residue is the cerium (IV) oxide, CeO2. The small endothermic peaks at 255oC and
268oC without mass loss in the TG curve are due to
the monotropic and enantiotropic polymorphic transformations, respectively.
Praseodymium compound. The simultane-ous TG-DTA curves are shown in Fig. 7. These curves show mass losses in three steps, between 54 and 580oC. The first mass loss observed up to
122oC, corresponding to an endothermic peak at
106oC is due to the dehydration with loss of 2H
2O (Calcd. = 5.72%, TG = 5.66%). The anhydrous compound is stable up to 290ºC and above this temperature the thermal decomposition also occurs in two overlapping steps, between 290-440oC and 440-580oC with losses of 35.26% and
the oxidation reaction of Pr(III) to Pr6O11, togeth-er with the oxidation of the organic matttogeth-er. The TG and DTA profiles in the last step also show that the oxidation of the organic matter is accompanied by combustion, with the formation of praseodymium oxide, Pr6O11. The small endothermic peak at 270oC without mass loss in the TG curve is due to
the enantiotropic polymorphic transformation. Neodymium compound. The simultaneous TG-DTA curves are shown in Fig. 8. These curves show mass losses in steps and thermal events cor-responding to these losses or due to crystalline phase transition. The first mass loss that occurs between 45 and 120oC, corresponding to an
endothermic peak at 110oC is due to hydration
water, with loss of 2.5 H2O) (Calcd. = 7.04%, TG = 6.60%). The anhydrous compound is stable up to 305oC, and above this temperature the thermal
Figure 6. TG-DTA curves of Ce(L)3.1.5H2O (L=4-methoxybenzoate); m = 6.9344 mg.
’ Figure 7. TG-DTA curves of Pr(L)3.2H2O (L=4-methoxybenzoate); m = 7,0770 mg.
Figure 8. TG-DTA curves of Nd(L)3.2.5H2O (L=4-methoxybenzoate); m = 7.5070 mg.
decomposition occurs in four steps. The three first steps that occur through overlapping ones, between 305-429oC, 429-500oC and 500-590oC
with losses of 40.50%, 13.50% and 12.98%, respectively, corresponding to the exothermic peaks at 429oC, 473oC and 548oC, are attributed to
oxidation of the organic matter with the formation of an intermediate. Test with hydrochloric acid solution on sample heated up to 590oC, confirmed
the elimination of CO2and calculations based on the mass loss observed in the TG curve is in agree-ment with the formation of a mixture of neodymi-um dioxycarbonate and oxide in no simple stoi-chiometric relation. The last step observed between 590 and 740oC, the mass loss occurs
through a slow process, attributed to the thermal decomposition of the intermediate to the respec-tive oxide, Nd2O3. In correspondence with the mass loss, no peak is observed in the DTA curves and this is probably due to the heat involved in this step is insufficient to produce a thermal event. The small endothermic peak at 270oC without mass
loss in the TG curve is due to the enantiotropic polymorphic transformation.
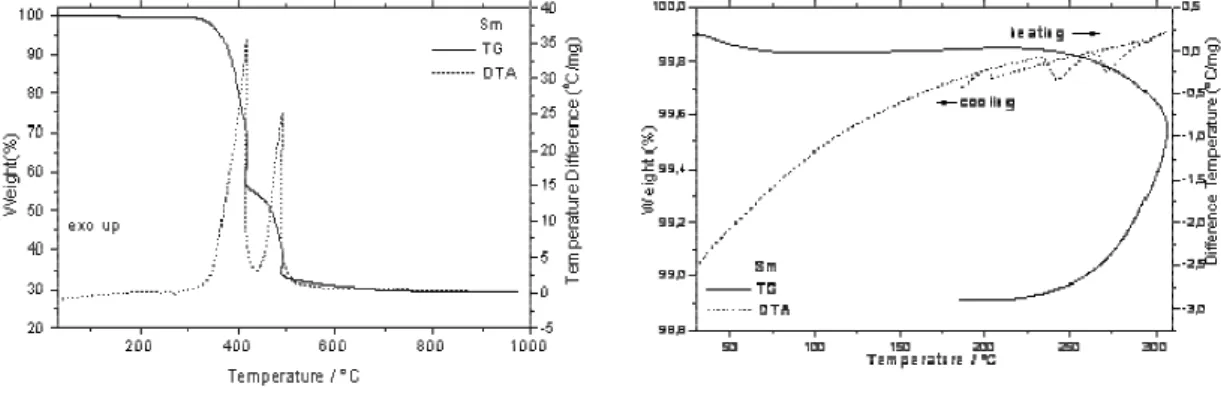
Samarium compound. The simultaneous TG-DTA curves are shown in Fig. 9. These curves show mass losses in three steps between 299 and 740oC and exothermic peaks in correspondence
with the two first steps. The two first mass losses that occur through a fast process between 299-415oC and 415-490oC, corresponding to the
exothermic peaks at 415oC and 490oC are
and DTA profiles in both steps show that the oxi-dation of the organic matter is accompanied by combustion, with the formation of a mixture of samarium dioxycarbonate and oxide in no simple stoichiometric relation, as already observed in the neodymium compound. The last mass loss observed between 490 and 740oC, that occurs
through a slow process without thermal event, is ascribed to the thermal decomposition of samari-um dioxycarbonate to the respective oxide, Sm2O3. The small endothermic peaks at 240oC and
270oC without mass loss in the TG curve are due
to the monotropic and enantiotropic polymorphic
Figure 10. X-ray powder diffraction patterns of the: a) Sm(L)3; b) Sm(L)3 heated up to 260oC; c) Sm(L)3heated up to 280oC.
Figure 9. TG-DTA curves of Sm(L)3 (L=4-methoxybenzoate); m = 7.3414 mg.
transformations respectively, which was con-firmed by X-ray powder diffraction patterns (Fig.10), and TG-DTA curves (Fig.11).
For all the compounds the enantiotropic polymorphic transformation is in agreement with the literature data [13, 15, 16], except the tempera-tures where all the thermal events occurs; and these differences are undoubtedly because the TG and DTA curves were obtained in conditions enough dif-ferent. The monotropic polymorphic transforma-tions observed for the cerium and samarium com-pounds, were not observed in the refs. 13, 15 and 16. The DSC curves of the compounds are
Figure 11. TG-DTA curve of heating and cooling
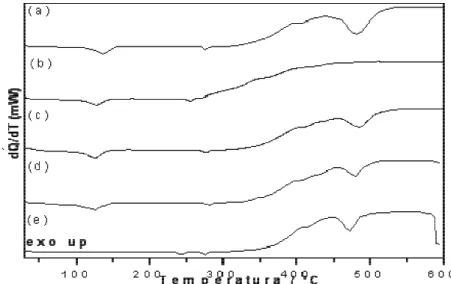
shown in Fig.12. These curves show endothermic and exothermic events that all accord with the mass losses observed in the TG curves and endothermic peaks due to crystalline phase transition. The endothermic peak at 130oC (La) and 125oC (Ce, Pr,
Nd) is due to dehydration. The dehydration enthalpies found for La, Ce, Pr and Nd compounds were: 139.6, 57.2, 69.1 and 79.0 kJ mol-1,
respec-tively. The broad exotherms observed for all com-pounds between 350oC and ≥ 600oC, without the
appearance of definitive peaks, are attributed to the thermal decomposition of the anhydrous com-pounds, where the oxidation of the organic matter takes place in consecutive steps except for the ceri-um compound. The small endothermic peaks at 255ºC (Ce) and 245 ºC (Sm) are due to monotropic polymorphic transformation, and the small endothermic peaks at 268oC (Ce), 275oC (La, Pr,
Sm) and 282oC (Nd) are attributed to the
enan-tiotropic polymorphic transformation. The DSC curves also show that the oxidation of the organic matter are still being observed up to 600oC, (580oC
for the samarium compound), while the TG and DTG curves display temperatures that do not exceed 550oC. This difference is undoubtedly provoked by
the crucible with perforated cover used to obtain the DSC curves, while a crucible without perforated cover is used for recording the TG and DTG curves.
Figure 12. DSC curves of the compounds: a) La(L)3.2H2O (4.8 mg); b) Ce(L)3.1.5H2O (5.7 mg); c) Pr(L)3.2H2O (4.8 mg); d) Nd(L)3.2.5H2O (5.0 mg) and e) Sm(L)3 (5.2 mg).
Conclusions
From analytical and thermoanalytical (TG) results a general formula could be estab-lished for these compounds in the solid state.
The X-ray powder patterns pointed out that the synthesized compounds have a crys-talline structure and only the La and Pr show evi-dence concerning to the formation of isomor-phous compounds.
The infrared spectroscopic data suggest that the 4-MeO-Bz acts as a bidentate ligand towards the metal ions considered in this work.
The TG-DTA and DSC curves provided previously unreported information about the thermal behaviour and thermal decomposition of these compounds.
Acknowledgements
The authors thank FAPESP (Proc. 97/12646-8), CNPq and CAPES Foundations (Brazil) for financial support and computational facilities of IQ-UNESP and CENAPAD-UNICAMP.
References
[1] S. J. Yun, S. K. Kang, S. S. Yun, Thermochim. Acta 331(1) (1999) 13.
[2] Z. M. Wang, L. J. Van de Burgt, G. R. Choppin, Inorg. Chim. Acta 167 (1999) 293.
[3] N. Arnaud, J. Georges Analyst, 125 (8) (2000) 1487. [4] G. R. Choppin, P. A. Bertrand, Y. Hasegawa, N. Rizalla, Inorg. Chem. 21 (10) (1982) 3722.
[5] A. W. H. Lam, W. T. Wang, S. Gao, G. Wen, X. X. Zhang, Eu. J. Inorg. Chem. (1) (2003) 149.
[6] W. W. Wendlandt. Anal. Chim. Acta. 17(3) (1957) 295. [7] W. W. Wendlandt. Anal. Chem. 29(5) (1957) 800. [8] A. K. J. Galwey, J. Chem. Society 1152 (1965) 6188. [9] S. B. Pirkes, G. N. Makushova, A. V. Lapitskaya, Russian J. Inorg. Chem. 21 (1976) 661.
[10] S. B. Pirkes, A. V. Lapitskaya, G. N. Makushova, Russian J. Inorg. Chem. 21 (1976) 816.
[11] G. N. Makushova, A. V. Lapitskaya, S. O. Goppe, S. B. Pirkes, Russian J. Inorg. Chem. 24 (1979) 1574.
[12] S. B. Pirkes, G. N. Makushova, A. V. Lapitskaya, N. P. Tsilina, Russian J. Inorg. Chem. 28 (1983) 1684.
[13] G. N. Makushova, S. B. Pirkes, Russian J. Inorg. Chem. 29 (1984) 531.
[14] G. N. Makushova, S. B. Pirkes, E. Yu. Levina, Russian J. Inorg. Chem. 30 (1985) 652.
[15] G. N. Makushova, S. B. Pirkes, E. Yu. Levina, Zhurnal Neorganicheskoi Khimii 30 (9) (1985) 2273.
[16] G. N. Makushova, S. B. Pirkes, J. Inorg. Chem. 32 (1987) 489.
[17] W. Lewandowski, J. Molec. Strut. 101 (1-2) (1983) 93. [18] W. Lewandowski, H. Baranska, J. Raman Spectroscopy 17 (1) (1986) 17.
[19] T. Glowiak, H. Kozlowski, L. Strinna Erre, B. Gulinati, G. Micera, A. Pozzi, S. Brunni, J. Coord. Chem. 25 (1992) 75. [20] W. Brzyska, S. Karasinski, J. Thermal Anal. 39 (1993) 429. [21] W. Ferenc, B. Bocian, J. Thermal Anal. Cal. 62 (3) (2000) 831.
[22] B. Bocian, B. Czajka, W. Ferenc, J. Thermal Anal. Cal. 66 (3) (2001) 729.
[23] B. Czajka, B. Bocian, W. Ferenc, J. Thermal Anal. Cal. 67 (3) (2002) 631.
[24] W. Ferenc, B. Bocian, J. Thermal Anal. Cal. 74 (2) (2003) 521.
[25] W. Ferenc, A. Walkow-Dziewulska, J. Thermal Anal. Cal. 71 (2) (2003) 375.
[26] N. S. Fernandes, M. A. S. Carvalho Filho, C. B. Melios, M. Ionashiro, J. Thermal Anal. Cal. 73 (1) (2003) 307. [27] N. S. Fernandes, M. A. S. Carvalho Filho, R. A. Mendes, C. B. Melios, M. Ionashiro, J. Thermal Anal. Cal. 76 (1) (2004) 193.
[28] W. Ferenc, B. Bocian, A. Walków-Dziewulska, J. Thermal Anal. Cal. 76 (1) (2004) 179.
[29] E. C. Rodrigues, A. B. Siqueira, E. Y. Ionashiro, G. Bannach, M. Ionashiro, J Thermal Anal. Cal. 79 (2005) 323. [30] H. A. Flaschka, EDTA Titrations; Pergamon Press; Oxford, 1964.
[31] M. Ionashiro, C. A. F. Graner, J. Zuanon Netto, Ecl. Quim. 8 (1983) 29.
[32] T. H. Dunning Jr, P. J. Hay, Modern Theoretical Chemistry, Ed. H. F. Schaefer; New York; 1976, pp. 1-28. [33] P. J. Hay, W. R. Wadt, J. Chem. Phys. 82 (1) (1985) 270. [34] W. R. Wadt, P. J. Hay, J. Chem. Phys. 82 (1) (1985) 284. [35] P. J. Hay, W. R. Wadt, J. Chem. Phys. 82 (1) (1985) 299. [36] C. C. J. Roothan, Rev. Mod. Phys. 23 (1951) 69. [37] M. J. Frisch, G. W. Trucks, H. B. Schlegel, G. E. Scuseria, M. A. Robb, J. R. Cheeseman, V. G. Zakrzewski, J. A. Montgomery, Jr., R. E. Stratmann, J. C. Burant, S. Dapprich, J. M. Millam, A. D. Daniels, K. N. Kudin, M. C. Strain, O. Farkas, J. Tomasi, V. Barone, M. Cossi, R. Cammi, B. Mennucci, C. Pomelli, C. Adamo, S. Clifford, J. Ochterski, G. A. Petersson, P. Y. Ayala, Q. Cui, K. Morokuma, N. Rega, P. Salvador, J. J. Dannenberg, D. K. Malick, A. D. Rabuck, K. Raghavachari, J. B. Foresman, J. Cioslowski, J. V. Ortiz, A. G. Baboul, B. B. Stefanov, G. Liu, A. Liashenko, P. Piskorz, I. Komaromi, R. Gomperts, R. L. Martin, D. J. Fox, T. Keith, M. A. Al-Laham, C. Y. Peng, A. Nanayakkara, M. Challacombe, P. M. W. Gill, B. Johnson, W. Chen, M. W. Wong, J. L. Andres, C. Gonzalez, M. Head-Gordon, E. S. Replogle, J. A. Pople, Gaussian 98, Revision A.11.2. Gaussian, Inc., Pittsburgh PA, 2001. [38] G. Socrates, Infrared Characteristic Group Frequencies, Wiley; New York, 2nd ed. 1994, pp.91 and 236-237. [39] R. M. Silverstein, F. X. Webster, Spectrometric Identification of Organic Compounds, Wiley, New York, 6th ed., 1998, pp. 92, 93, 96 and 97.
[40] W. Lewandowsky, H. Baranska, J. Raman Spect. 17 (1) (1986) 17.
[41] D. Z. Goodson, S. K. Sarpal, Phlilppe Bopp, M. Wolfsberg, J. Phys. Chem., 86 (1982) 659.
[42] H. B. Schelegel. In new theoretical concepts for under-standing organic reaction. J. Berdron Ed., Academic: The Netherlands; 1989, pp 33-53.
E. C. Rodrigues, A. B. Siqueira, E. Y. Ionashiro, G. Bannach e M. Ionashiro. Síntese, caracteriza-ção e comportamento térmico dos 4-metoxibenzoatos de lantânio (III) e lantanídeos leves trivalentes.
Resumo:Compostos M – L foram sintetizados no estado sólido, onde M representa os íons trivalentes
La, Ce, Pr, Nd e Sm, e L é o ânion 4 – metoxibenzoato. Esses compostos foram caracterizados e estu-dados, utilizando-se as técnicas de difração de raios x pelo método do pó, espectroscopia na região do infravermelho, complexometria, termogravimetria–análise térmica diferencial simultânea (TG–DTA) e DSC. Os resultados permitiram obter informações com respeito à estequiometria, desidratação, trans-formação polimórfica, ligação metal- ligante, comportamento térmico e decomposição térmica.