Introduction
Various procedures concerning the prepa-ration of α-keto acids have been reported in the literature.1 The α-keto acids are of continuing interest as model substrates of enzymes, interme-diates in chemical syntheses, in the development of enzyme inhibitors and drugs and in other ways.1The aldol condensation products between cinnamaldehyde and pyruvic acid as, 4-dimethy-lamino and cinnamylidenepyruvic acids has also been described in the literature2, 3.
Extensive experimental and theoretical investigations have focused on elucidating the structure and normal vibrations of organic com-pounds4. Thus, calculations of optimal molecular geometry and vibrational of 2-MeO-HCP were made. The calculated harmonic frequencies are usually higher than the corresponding exper-imental quantities, due to a combination of elec-tron correlation effects and basis set deficiencies. It is well known that Hartree-Fock (HF) method tends to overestimate vibrational frequencies.
www.scielo.br/eq www.ecletica.iq.unesp.br
Volume 33, número 4, 2008
Synthesis and characterization of
solid 2-methoxycinnamylidenepyruvic acid
C. T. de Carvalho1, A. B. Siqueira1, E. Y. Ionashiro2, M. Pivatto1, M. Ionashiro1*. 1Instituto de Química, UNESP, CP 355, CEP 14801-970, Araraquara, SP, Brazil.
2Instituto de Química, UFG, Campus II, CEP74001-979, Goiânia, GO, Brazil. *[email protected]
Abstract: The 2-methoxycinnamylidenepyruvic acid (2-MeO-HCP) was synthesized and character-ized for nuclear magnetic resonance (1H and 13C NMR), mass spectrometry (MS), Infrared spec-troscopy (FTIR) and differential scanning calorimetry (DSC). The application of DSC for purity deter-mination is well documented in literature and is used in the analysis of pure organic compounds. The molecular geometry and vibrational frequencies of 2-MeO-HCP have been calculated.
Keywords:2-methoxycinnamylidenepyruvic acid; synthesis; MS; NMR; IR.
However, density functional theory (DFT) calcu-lations are reported to provide excellent vibra-tional frequencies of organic compounds if the calculated frequencies are scaled to compensate for the approximate treatment of electron correla-tion for basis set deficiencies and the anhar-monicity.5
In this paper, the 2-MeO-HCP was investi-gated by means of infrared spectroscopy (IR), mass spectrometry (MS), nuclear magnetic reso-nance (NMR) spectroscopy and differential scan-ning calorimetry (DSC). The results allowed us to acquire information about these compounds in the solid state. The DSC purity determination method was established using melting point (122 ºC) observations revealing a relation between a sub-stance’s melting point and its purity6.
The optimisation of the DSC purity deter-mination method was done by Blaine et al.7using a Nacional Institute of Standards and Technology (NIST) purity standard – phenacetin doped with
influencing purity results were assessed: speci-men size, heating rate, level of impurity. An opti-mal specimen size (1.7 mg) and heating rate (0.5–2 °C min–1) were deduced.
The 2-methoxycinnamaldehyde, (CH3 O-C6H4-(CH)2-CHO, 96%) predominantly trans, was obtained from Aldrich and sodium pyruvate (H3C-CO-COONa, 99%) was obtained from Sigma. 2-methoxycinnamylidenepyruvic acid (2-MeO-HCP) was synthesized following the same procedure as described in literature,8 with some modifications, as follows: an aqueous solution of sodium pyruvate (1.5 g per 10 mL) was added dropwise with continuos stirring to a methanolic solution of 2-methoxycinnamaldehyde (2.0 g per 50mL). Five millilitres of an aqueous sodium hydroxide solution 1.25 mol L-1was added slow-ly while the reacting system was stirred and cooled in an ice bath. The rate of addition of alka-li was regulated so that the temperature remained between 5 and 9 °C. The system was stirred at ambient temperature (~28 °C) for about 5 h. To the pale yellow solution was added dropwise with continuous stirring with a glass rod, twenty milli-litres of chilled concentrated (12 mol L-1) hydrochloric acid. The system was left to stand for ca. 16 h in a freezer (-6 °C) and the yellow orange precipitate (impure 2-MeO-HCP) was filtered, washed with distilled water to remove most of the unreacted aldehyde and secondary products and dried on Whatman nº 44 filter paper. The aqueous suspension of the impure acid was dissolved with 5 mL of aqueous sodium hydroxide solution 2 mol L-1and filtered on Whatman nº 44 filter paper. The yellow solution was stirred with a glass rod and added slowly 20 mL of chilled concentrated (12 mol L-1) hydrochloric acid and left to stand for ca. 16 h in freezer (-6 °C). The orange precipitate of 2-MeO-CP was filtered and washed with distilled water until elimination of chloride ions and dried on Whatman nº 44 filter paper and kept in a des-iccator over anhydrous calcium chloride. (yield = 28,6%).
General methods
Infrared spectra for 2-MeO-HCP were run on a Nicolet Model Impact 400 FTIR instrument within the 4000-400 cm-1range. The solid sam-ples were pressed into KBr pellets.
DSC curve were obtained with DSC Q10 from TA Instruments. The purge gas was an air flow of 50 mL min-1. A heating rate 0.5 K min-1 for the DSC was adopted, with samples weighing about 1,5 mg. Aluminium crucibles with perfo-rated covers were used for the DSC.
The 1D – (1H, 13C and DEPT) and 2D – (1H – 1H gCOSY, gHMQC and gHMBC) NMR experiments were recorded on a Varian INOVA 500 spectrometer (11.7 T) at 500 MHz (1H) and 125 MHz (13C) at 30 °C and referenced using TMS as internal standard or residual solvent res-onances of CDCl3at δ7.20 and 77.0, respective-ly, for 1H and 13C NMR.
High resolution mass spectra with ESI ionization was measured on UltrO-TOF instru-ment (Bruker Daltonics) operating in positive mode. MeOH/H2O (4:1) was applied as solvent system.
Purity determination
The determination of purity is based on the assumption that an impurity will depress the melt-ing point of a pure material whose meltmelt-ing is char-acterized by a melting point (T0) and an enthalpy of fusion (∆Hfus.). The effect of an impurity on To of the 2MeO-HCP was determined by DSC method basing on the Van’t Hoff equation (1).
(1)
Where Tsis the sample temperature at equilibri-um (K), Tois the melting point of the pure com-ponent (K), R is the gas constant, x is the con-centration of impurity (mole fraction) and F is the fraction molten at Ts.
The obtained DSC curve exhibits the endothermic event corresponding to 2-MeO-HCP melting point (∆Hfus= +23.36 kJ mol–1). The value of purity found was confirming low impurity content.
Structure elucidation
observed cationized adduct ion peaks at m/z
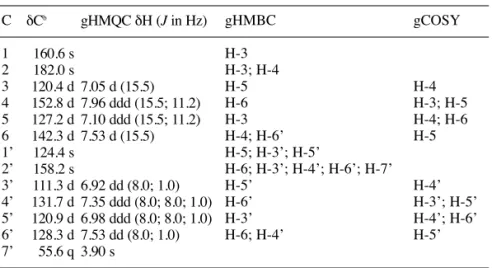
233,0815 [M + H]+and m/z255,0630 [M + Na]+ were calculated for C13H13O4, 233,0814 and C13H12O4Na, 255,0633, respectively. The 1H NMR analysis of 2-MeO-HCP showed signals for a methoxy group at δ3.90 (3H, s, H-7’), four aromatic hydrogen signals at δ6.92 (1H, dd, J = 8.0; 1.0 Hz, H-3’), 7.35 (1H, ddd, J= 8.0; 8.0; 1.0 Hz, H-4’), 6.98 (1H, ddd, J= 8.0; 8.0; 1.0 Hz, H-5’), and 7.53 (1H, dd, J = 8.0; 1.0 Hz, H-6’), respectively, were indicative of a 1,2-disubstitut-ed aromatic system, in addition to four other olefinic hydrogen signals at δ 7.05 (1H, d, J = 15.5 Hz), 7.96 (1H, ddd, J = 15.5; 11.2 Hz), 7.10 (1H, ddd, J= 15.5; 11.2 Hz), and 7.53 (1H, d, J= 15.5 Hz), which were assigned to 3, H-4, H-5 and H-6, respectively, see Figure 1. Analysis of the 1H-1H COSY NMR spectrum allowed to confirm the assignment of the signals, see Table 1. The 13C NMR and DEPT spectra displayed 13 signals, including a methoxy group, eight methines, and four quaternary carbons (Table 1). The aromatic carbons signals were identified at δ 124.4 (C-1’), 158.2 (C-2’), 111.3 3’), 131.7 4’), 120.9 5’) and 128.3 (C-6’). The presence of a conjugated carbonyl and a vicinal carboxylic carbonyl group were indicated by the chemical shifts at 182.0 (C-2) and 160.6 (C-1), respectively, in the 13C NMR spectrum of
this compound, in addition to four other olefinic carbons at δ 120.4 3), 152.8 4), 127.2 (C-5), and 142.3 (C-6) (Table 1). The aromatic ring was attached to the olefinic end-carbon (C-6), and this was evidenced by the observed gHMBC correlations between the signal at δ 7.53 (H-6) and that at δ 158.2 (C-2’), as well as between the signal at δ 7.53 (H-6’) and C-6 (δ 142.3). Further more the 1,2-dissubstituted aromatic ring was confirmed by the correlations between the signal at δ 3.90 (OCH3-7’) with C-2’ (δ158.2) (Table 1). The E-configuration of the conjugated double bonds C-3–C-4 and C-5–C-6 in the olefin moiety were determined by the large coupling constant (15.5 Hz) between 3–4 and H-5–H-6. The structure of H-2-MeO-CP was there-fore assigned as (3E,5E )-6-(2-methoxyphenyl)-2-oxohexa-3,5-dienoic acid.
Table 1.MR Spectroscopic Data of H-2MeO-CPin CDCl3a.
C
1 2 3 4 5 6 1’ 2’ 3’ 4’ 5’ 6’ 7’
δCb
160.6 s 182.0 s 120.4 d 152.8 d 127.2 d 142.3 d 124.4 s 158.2 s 111.3 d 131.7 d 120.9 d 128.3 d 55.6 q
gHMQC δH (Jin Hz)
7.05 d (15.5) 7.96 ddd (15.5; 11.2) 7.10 ddd (15.5; 11.2) 7.53 d (15.5)
6.92 dd (8.0; 1.0) 7.35 ddd (8.0; 8.0; 1.0) 6.98 ddd (8.0; 8.0; 1.0) 7.53 dd (8.0; 1.0) 3.90 s
gHMBC
H-3 H-3; H-4 H-5 H-6 H-3 H-4; H-6’ H-5; H-3’; H-5’
H-6; H-3’; H-4’; H-6’; H-7’ H-5’
H-6’ H-3’ H-6; H-4’
gCOSY
H-4 H-3; H-5 H-4; H-6 H-5
H-4’ H-3’; H-5’ H-4’; H-6’ H-5’
a Recorded at 500 and 125 MHz for 1H and 13C NMR, respectively. b
Internal standard TMS, δTMS= 0.00.
Computational Strategy
In the present investigation, the employed quantum chemical approach to determining the molecular structures was Becke three-parameter hybrid method9 using the Lee-Yang-Par (LYP) correlation functional10 and the basis sets used for calculations were the 6-311G.11,12 The per-formed molecular calculations in this work were done using the Gaussian 03 routine.13
Molecular structure of the compound could not be determined by the single crystal X-ray diffraction technique, a geometry optimiza-tion was computed using the optimized algorithm of Berny.14
Theoretical infrared spectrum was calcu-lated using a harmonic field15based on C
1 sym-metry (electronic state 1A). Frequency values (not scaled), relative intensities, assignments and description of vibrational modes are presented. The calculations of vibrational frequencies were also implemented to determine an optimized geometry constitutes minimum or saddle points. The principal infrared-active fundamental modes assignments and descriptions were done by the GaussView 3.0 graphics routine.16
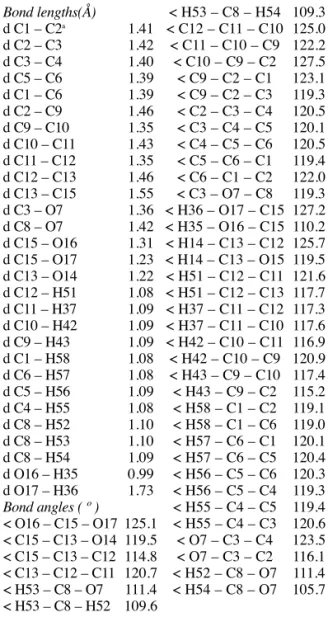
The optimized structure parameters of 2-MeO-HCP dimer calculated by ab initio DFT-B3LYP levels with the 6-311G basis set are list-ed in Table 2 in accordance with the atom num-bering scheme given in Figure 2.
Optimized geometries and vibrational modes for studied molecular structures were compared with the experimental frequencies. The optimized geometric parameters (bond lengths and bond angles) obtained, see Table 2, did not can be compared with experimental parameters because the crystal structure of the title com-pound is not available until now. The Mulliken atomic charges, dipole moment and theoretically computed energies are gather in Table 3. Taking into account that the molecular geometry of the dimer alone in vapor phase may be different from that dimer in the solid phase, owing to extended hydrogen bonding and stacking interactions there is reasonable agreement between the calculated and experimental geometric parameters. As dis-cussed by Johnson et al.17, DFT method predicts bond lengths which are systematically too long, particularly the CH bond lengths.
Table 2. Theoretical geometries parameters of 2-MeO- HCP compound.
Bond lengths(Å)
d C1 – C2a d C2 – C3 d C3 – C4 d C5 – C6 d C1 – C6 d C2 – C9 d C9 – C10 d C10 – C11 d C11 – C12 d C12 – C13 d C13 – C15 d C3 – O7 d C8 – O7 d C15 – O16 d C15 – O17 d C13 – O14 d C12 – H51 d C11 – H37 d C10 – H42 d C9 – H43 d C1 – H58 d C6 – H57 d C5 – H56 d C4 – H55 d C8 – H52 d C8 – H53 d C8 – H54 d O16 – H35 d O17 – H36
Bond angles ( º )
< O16 – C15 – O17 < C15 – C13 – O14 < C15 – C13 – C12 < C13 – C12 – C11 < H53 – C8 – O7 < H53 – C8 – H52
1.41 1.42 1.40 1.39 1.39 1.46 1.35 1.43 1.35 1.46 1.55 1.36 1.42 1.31 1.23 1.22 1.08 1.09 1.09 1.09 1.08 1.08 1.09 1.08 1.10 1.10 1.09 0.99 1.73 125.1 119.5 114.8 120.7 111.4 109.6 109.3 125.0 122.2 127.5 123.1 119.3 120.5 120.1 120.5 119.4 122.0 119.3 127.2 110.2 125.7 119.5 121.6 117.7 117.3 117.6 116.9 120.9 117.4 115.2 119.1 119.0 120.1 120.4 120.3 119.3 119.4 120.6 123.5 116.1 111.4 105.7 < H53 – C8 – H54 < C12 – C11 – C10 < C11 – C10 – C9
< C10 – C9 – C2 < C9 – C2 – C1 < C9 – C2 – C3 < C2 – C3 – C4 < C3 – C4 – C5 < C4 – C5 – C6 < C5 – C6 – C1 < C6 – C1 – C2 < C3 – O7 – C8 < H36 – O17 – C15 < H35 – O16 – C15 < H14 – C13 – C12 < H14 – C13 – O15 < H51 – C12 – C11 < H51 – C12 – C13 < H37 – C11 – C12 < H37 – C11 – C10 < H42 – C10 – C11
< H42 – C10 – C9 < H43 – C9 – C10
< H43 – C9 – C2 < H58 – C1 – C2 < H58 – C1 – C6 < H57 – C6 – C1 < H57 – C6 – C5 < H56 – C5 – C6 < H56 – C5 – C4 < H55 – C4 – C5 < H55 – C4 – C3 < O7 – C3 – C4 < O7 – C3 – C2 < H52 – C8 – O7 < H54 – C8 – O7
Key: H-2-MeO-CP = 2-methoxycinnamylidenepyru-vic acid; d = bond lengths; < = bond angles;
aAtom numbering accord Figure 2.
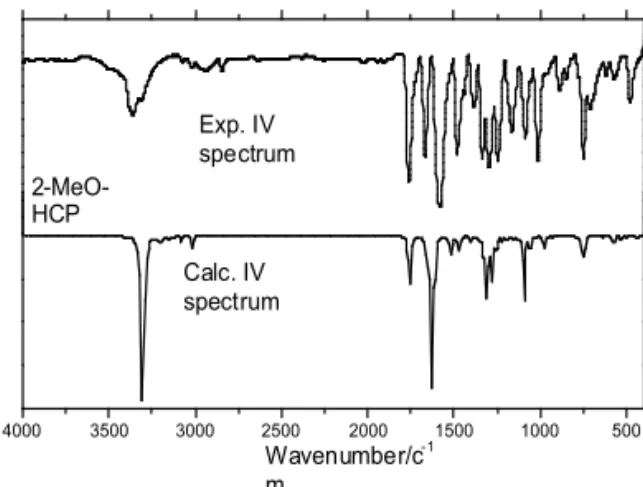
The experimental and theoretical IR spec-tra of 2-MeO-HCP are given in Figure 3. The resulting vibrational frequencies for the opti-mized geometries and the proposed vibrational assignments are given in Table 4. Comparisons between theoretical and experimental IR spectra indicated that vibrations were more intense in experimental than theoretical spectrum.
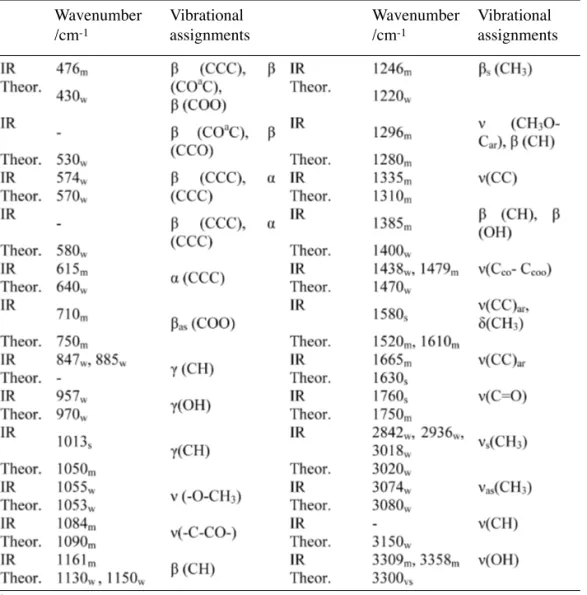
For 2-MeO-HCP group the vibrational modes are C–H stretch, C=O stretch, O–H stretch, O–CH3stretch, CH3O-Carstretch, C-C stretch, Cco -Ccoo stretch, C–C–C bending, CH3 bending, C-H bending, COO bending and ring bending.
O–H stretching band is characterized by very broad band appearing near about 2500–3600 cm-1. This may be due combined effect of intermol-ecular hydrogen bonding. The O–H in plane bend-ing vibration occurs in general at 1440–1395 cm-1. The O–H out of plane bending vibration occurs in 960–875 cm-1.18 In 2-MeO-HCP, O–H stretching were assigned at 3309 and 3358 cm-1, and in plane and out of plane bending vibrations were assigned at 1385 and 957 cm-1, respectively. Theoretically computed values (3300, 1400 and 970 cm-1) were in agreement with experimental results.
The main feature of carboxylic group is a single band observed usually in the 1700–1800 cm-1 region.18 This band is due to the C=O stretching vibration. Theoretically computed value of C=O (1750 cm-1) band show is agree-ment with experiagree-mental data (1760 cm-1). Table 3. Mulliken atomic charges and additional parameters calculated in B3LYP/6-311g level.
atom
C1a C2 C3 C4 C5 C6 C8 C9 C10 C11
E (a.u.) -0.20 -0.03 0.23 -0.27 -0.18 -0.19 -0.47 -0.19 -0.17 -0.11
atom
C12 C13 C15 O7 O14 O16 O17 H35 H36 H37
-0.30 0.17 0.43 -0.35 -0.29 -0.47 -0.41 0.42 0.42 0.22
-1607.36
2.86
atom
H42 H43 H51 H52 H53 H54 H55 H56 H57 H58
0.20 0.22 0.22 0.22 0.22 0.24 0.22 0.20 0.20 0.20
Dipole moment (Debye)
aAtom numbering accord Figure 2
4000 3500 3000 2500 2000 1500 1000 500
Exp. IV spectrum
2-MeO-HCP
Wavenumber/c m
-1
Calc. IV spectrum
Figure 3. Experimental and calculated IR spectra of 2-MeO-HCP.
Experimental vibration frequencies were in agreement with that theoretically calculated, see Table 4.
Conclusion
In conclusion, 2-MeO-HCP purity was determined for DSC and structural elucidation was made by MS, NMR and IR. Theoretical infrared spectra was calculated and compared with experi-mental data. The difference between the observed and scaled wavenumbers values of most of the fun-damentals is very small. Any discrepancy noted between the observed and the calculated frequen-cies may be due to the fact that the calculations have been actually done on a single molecule con-trary to the experimental values recorded in the presence of intermolecular interactions. Therefore, the assignments made at higher levels of theory with only reasonable deviations from the experi-mental values, seem to be correct.
Acknowledgements
The authors thanks Dr. Éder Tadeu Gomes Cavalheiro - IQ-USP São Carlos – SP for the computational facilities.
Table 4.Wavenumbers (cm-1), intensities and assignments of bands occurring in the IR
spec-tra of 2-MeO-HCP. The theoretical wavenumbers were calculated in B3LYP/6-311g level.
Wavenumber /cm-1
Vibrational assignments
Wavenumber /cm-1
Vibrational assignments
C. T. de Carvalho, A. B. Siqueira, E. Y. Ionashiro, M. Pivatto, M. Ionashiro. Síntese e caracter-ização do ácido 2-metoxicinamalpirúvico.
Resumo: O ácido 2-metoxicinamalpirúvico (2-MeO-HCP) foi sintetizado e caracterizado por ressonância magnética nuclear (1H and 13C NMR), espectrometria de massas (MS), espectroscopia na região do infravermelho (FTIR) e calorimetria exploratória diferencial (DSC). A técnica DSC foi usada para determinação da pureza do composto e as principais bandas de absorção na região do infravermelho foram atribuídas utilizando-se o programa GaussView 3.0.
References
[1] Cooper,A. J. L.; Ginos, J. Z.; Meister, A. Chem. Rev. 1983, 83, 321.
[2] Lubrzynska, E.; Smedley, I. Biochem. J.1913, 7, 375. [3] Melios, C. B.; Torres, V. R.; Mota, M. H. A.; Tognolli, J. O.; Molina, M. Analyst 1984, 109, 385.
[4] Kalinowska, M.; Swislocka, R.; Lewandowski , W. J. Mol. Struct.2006, 792–793, 130.
[5] Karabacak, M.; Çınar, M.; Kurt, M. J. Mol. Struct 2008, 885, 28.
[6] Marti, E. Thermochim, Acta1972, 5, 173.
[7] Hunter, J. E.; Blaine, R. L. ASTM STP 838, American Society of Testing and Materials1983, 29.
[8] Bannach, G.; Schnitzler, E.; Treu Filho, O.; Utuni, V. H. S.; Ionashiro,M. J. Therm. Anal. Cal., 2006, 83, 233. [9] Becke, A.D. J. Chem. Phys 1993, 98, 5648.
[10] Lee, C.; Yang, W.; Parr, R.G. Phys. Rev. 1988, B 37, 785. [11] McLean, A. D.; Chandler, G. S. J. Chem. Phys 1980, 72, 5639.
[12] Krishnan, R.; Binkley, J. S.; Seeger, R.; Pople, J. A . J. Chem. Phys.1980, 72, 650.
[13] Frisch, M. J.; Trucks, G. W.; Schlegel, H. B.; Scuseria, G. E.; Robb, M. A.; Cheeseman, J. R.; Montgomery Jr., J. A.; Vreven, T.; Kudin, K. N.; Burant, J. C.; Millam, J. M.; Iyengar, S. S.; Tomasi, J.; Barone, V.; Mennucci, B.; Cossi, M.; Scalmani, G.; Rega, N.; Petersson, G. A.; Nakatsuji, H.;
Hada, M.; Ehara, M.; Toyota, K.; Fukuda, R.; Hasegawa, J.; Ishida, M.; Nakajima, T.; Honda, Y.; Kitao, O.; Nakai, H.; Klene, M.; Li, X.; Knox, J. E.; Hratchian, H. P.; Cross, J. B.; Adamo, C.; Jaramillo, J.; Gomperts, R.; Stratmann, R. E.; Yazyev, O.; Austin, A. J.; Cammi, R.; Pomelli, C.; Ochterski, J. W.; Ayala, P. Y.; Morokuma, K.; Voth, G. A.; Salvador, P.; Dannenberg, J. J.; Zakrzewski, V. G.; Dapprich, S.; Daniels, A. D.; Strain, M. C.; Farkas, O.; Malick, D. K.; Rabuck, A. D.; Raghavachari, K.; Foresman, J. B.; Ortiz, J. V.; Cui, Q.; Baboul, A. G.; Clifford, S.; Cioslowski, J.; Stefanov, B. B.; Liu, G.; Liashenko, A.; Piskorz, P.; Komaromi, I.; Martin, R. L.; Fox, D. J.; Keith, T.; Al-Laham, M. A.; Peng, C. Y.; Nanayakkara, A.; Challacombe, M.; Gill, P. M. W.; Johnson, B.; Chen, W.; Wong, M. W.; Gonzalez, C.; Pople, J. A. Gaussian 03, Revision B.04, Gaussian, Inc., Pittsburgh PA, 2003.
[14] Schelegel, H.B. In New Theoretical Concepts for Understanding Organic Reactions; Bertran, J., Ed,; Academic: The Netherlands, 1989, pp. 33-53.
[15] Goodson, D.Z. J. Phys. Chem 1988, 86, 659.
[16] Dennington II, R.; Keith, T. J. M.; Eppinnett, K.; Hovell, W. L.; Gilliland, R. Semichem, Inc., Shawnee Mission, KS, 2003.
[17] Johnson, B.G.; Gill, P.M.; Pople, J.A.; J. Chem. Phys. 1993, 98, 5612.