Introduction
Several investigations on pyruvic acid (HPy), as well as compounds derivatives of HPy, have been carried out in biological science reseaches. However little works on salts of pyru-vic acid (H3C-CO-COOH) have been described in the literature. In aqueous solutions the forma-tion of some metal ions complexes with pyruvic acid in the ratio of metal: ligand 1:1 and 1:2 have been established by the spectroscopic method [1-3]; the stability constants and thermodynamic functions of complexes formation of lanthanides with pyruvic acid: ∆G, ∆H, ∆S, have also been determined [4]. In the solid state the preparation of europium pyruvate [5], as well as the prepara-tion and properties of lanthanides and yttrium pyruvates have also been described [6,7].
The aim of this work has been to obtain light trivalent lanthanide pyruvates in solid state and to investigate by means of complexometry, ele-mental analysis, X-Ray powder diffractometry, infrared spectroscopy, thermogravimetry (TG) and differential scanning calorimetry (DSC).
Experimental details
The sodium pyruvate with 99% purity was obtained from Sigma. Aqueous solution of sodi-um pyruvate 0.30M was made by direct weighing of the solid salt.
Light lanthanides (III) chlorides were preparared from the corresponding metal oxides (except for cerium) by treatment with concentrat-ed hydrochloric acid. The resulting solutions were evaporated to near dryness, the residues were redissolved in distilled water and the solu-tions have been again evaporated to near dryness to eliminate the excess of hydrochloric acid. The residues were again dissolved in distilled water, transferred to a volumetric flask and diluted in order to obtain 0,30M solutions, whose pH were adjusted to 5,0 by adding diluted sodium hydrox-ide or hydrochloric acid solutions. Aqueous solu-tion of cerium (III) nitrate 0,30M was made by direct weighing of the solid salt.
The solid-state compounds were prepared by adding equivalent quantities of hot solution of sodium pyruvate to hot solution of the respective www.scielo.br/eq
www.ecletica.iq.unesp.br Volume 32, número 4, 2007
Synthesis, characterization and thermal behaviour
on solid pyruvates of light trivalent lanthanides
A. B. Siqueira1, C. T. de Carvalho1, E. C. Rodrigues2, E. Y. Ionashiro3, G. Bannach3, M. Ionashiro1*
1Instituto de Química, UNESP, CP 355, CEP 14801-970, Araraquara, SP, Brazil. 2Fundação Educacional de Barretos, CEP 14780-000, Barretos, SP, Brazil. 3Departamento de Química, UEPG, CEP 84030-000, Ponta Grossa, PR, Brazil.
Abstract: Solid State Ln-L compounds, where Ln stands for light trivalent lanthanides (La – Gd) and L is pyruvate, have been synthesized. Thermogravimetry and derivative thermo-gravimetry (TG/DTG), differential scanning calorimetry (DSC), X-Ray powder diffractometry, infrared spectroscopy, elemental analysis, and complexometry were used to characterize and to study the thermal behaviour of these compounds. The results led to information about the composition, dehy-dration, ligand denticity, thermal behaviour and thermal decomposition of the isolated compounds.
metal chloride or nitrate. The solutions were maintained in water bath until total precipitation of the metal pyruvates and the precipitates washed with hot distilled water to eliminate the chloride (or nitrate ions), then filtered through and dried on Whatman nº 42 filter paper, and kept in a desiccator over anhydrous calcium chloride.
After igniting the compounds to the respec-tive oxides (CeO2, Pr6O11and Ln2O3, Ln =La, Nd
– Gd) the residues were dissolved in a hot solution of concentrated hydrochloric acid or a hot solution comprising a mixture of concentrated hydrochloric acid and hydrogen peroxide for cerium and praseodymium oxides, and their lanthanides con-tents were determined by complexometric tritra-tion with standard EDTA solutritra-tion, using xylenol orange as indicator [8]. The lanthanides contents were also estimated from their corresponding TG curves. The dehydration of the compounds was firstly pointed out by their DTG curves and subse-quently confirmed by the broad endothermic peaks centered at 75 – 175ºC in the respective DSC curves. The water contents were then determined from the corresponding mass losses observed in the TG curves. Next, the ligand content was also assessed from the TG curves.
X-Ray powder patterns were obtained by using a Siemens D-5000 X-Ray diffractometer with CuKαradiation (λ= 1,541 Å) and under 40 kV and 20 mA settings. Infrared spectra for sodi-um pyruvate as well as for its metal-ion com-pounds were recorded on a Nicolet model Impact 400 FTIR Instrument in 4000-400cm-1range. The
solid samples were pressed into KBr pellets.
The TG and DTG curves were obtained using a Mettler TA 4000 thermal analysis system with an air flow of 100 mL min-1, a heating rate of 5
ºC min-1and with sample weighing about 7 mg. An
alumina crucible was used for the TG/DTG curves. The DSC curves were obtained with ther-mal analysis system model Q10 from TA Instruments. The purge gas was an air flow of 50 mL min-1. A heating rate of 10 ºC min-1 was
adopted with samples weighing about 5 mg. Aluminium crucibles, with perforated cover, were used for recording the DSC curves.
Results and discussion
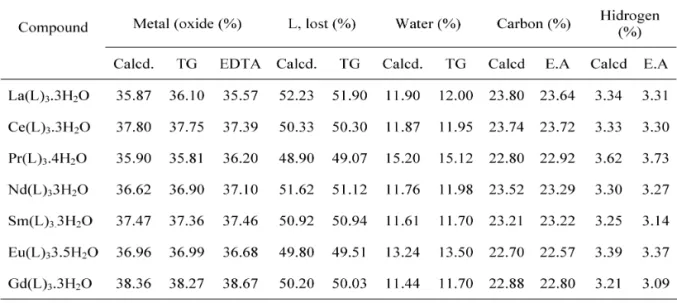
Table 1 presents the analytical, thermoana-lytical (TG) and elemental analysis (E.A) data for the prepared compounds from which the general formula Ln(L)3.nH2O can be established, where Ln represents trivalent lanthanides, L is pyruvate and n = 3 (La, Ce, Nd, Sm, Gd), 3.5 (Eu), 4(Pr).
X-Ray powder patterns showed that all the compounds are amorphous. The amorphous state is undoubtedly due to the decreasing solubility with increasing temperature, where the precipita-tion of these compounds occurs fastly near to ebullition temperature.
The infrared spectroscopic data on sodium pyruvate and its compounds with the metal ions considered in this work are shown in Table 2. The investigation was focused mainly within 1700 – 1400 cm-1range because this region is pontentially
most informative in attempting to assign
tion sites. In sodium pyruvate, strong band at 1640 cm-1and a medium intensity band located at 1406
cm-1are attributed to the anti-symmetrical and
sym-metrical frequencies of carboxylate group, respec-tively [9,10]. The band centered at 1709 cm-1 is
attributed to the stretching frequency of the ketonic carbonyl group. For the prepared compounds the infrared spectra show a broad band in the range of 3367-3395 cm-1attributed to hydration water. The
anti-symmetrical and symmetrical stretching fre-quencies of the carboxilate group are observed between 1591-1605 and1398-1410 cm-1,
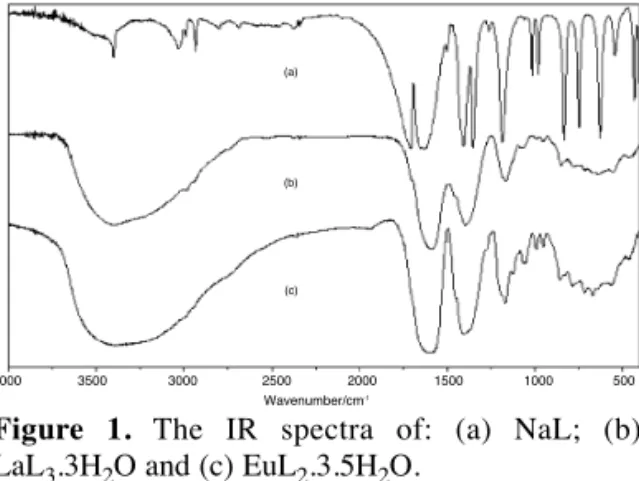
respective-ly. No band due to the stretching frequency of the ketonic carbonyl group is observed in the spectrum of these compounds, and its absence undoubtedly is due to the overlapping bands of anti-symmetrical stretching frequency of the carboxylate and stretch-ing frequency of the ketonic carbonyl group, as can be seen in the Fig. 1. These data show that the bands due to the anti-symmetrical stretching frequency of the carboxilate and the stretching frequency of the ketonic carbonyl group are moved to the lower fre-quencies in comparison with the ligand frefre-quencies, suggesting that the metal-ions are coordinate by α -ketonic carbonyl and carboxylate groups [11,12]. This behaviour is in agreement with the observed in compounds of lanthanides with phenyl substituted derivatives of benzylidenepyruvate [13 -15].
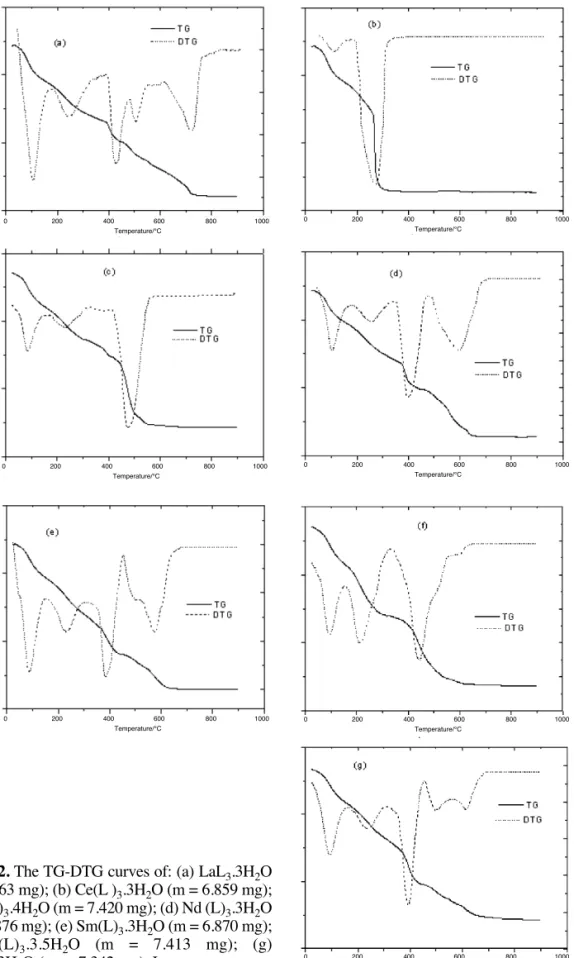
The TG and DTG curves of the compounds are shown in Fig. 2. These curves show mass loss-es in two (Ce), three (Pr, Eu), four (Nd, Sm) and five (La, Gd) consecutive and/or overlapping steps, without a plateau between the steps and without
evidence concerning the formation of stable anhy-drous compounds as can be seen in Fig. 3, as repre-sentative of all the compounds. As previously stressed, the temperatures corresponding to the mass losses due to dehydration were depicted from the DTG curves. The mass losses beginning at 30 ºC, observed in all the TG and DTG curves, were undoubtedly provoked by the purge gas (air) flow-ing at a rate of 100 mL min-1, as already observed
for other amorphous compounds [16].
For all the compounds, the first mass loss up to 125 ºC (La, Ce), 135 ºC (Pr, Sm), 140 ºC (Nd,Gd) and 150 ºC (Eu) is ascribed to dehydration, which occurs in a single step and through a slow process. This behaviour was also observed during the dehy-dration of lanthanides and yttrium compounds with phenyl-substituted derivatives of benzylidenepyru-vate, and it seems to be characteristic of compounds obtained in amorphous state [13-16,18].
Figure 1. The IR spectra of: (a) NaL; (b)
LaL3.3H2O and (c) EuL2.3.5H2O.
(a)
4000 3500 3000 2500 2000 1500 1000 500 Wavenumber/cm-1
(b)
52 Ecl. Quím., São Paulo, 32(4): 49-54, 2007
Figure 2. The TG-DTG curves of: (a) LaL3.3H2O
(m=.6.863 mg); (b) Ce(L )3.3H2O (m = 6.859 mg); (c) Pr(L)3.4H2O (m = 7.420 mg); (d) Nd (L)3.3H2O
(m = 6.876 mg); (e) Sm(L)3.3H2O (m = 6.870 mg); (f) Eu(L)3.3.5H2O (m = 7.413 mg); (g)
Gd(L)3.3H2O ( m = 7.342 mg). L=pyruvate.
0 200 400 600 800 1000 Temperature/°C
0 200 400 600 800 1000 Temperature/°C
0 200 400 600 800 1000 Temperature/°C
0 200 400 600 800 1000 Temperature/°C
0 200 400 600 800 1000 Temperature/°C
0 200 400 600 800 1000 Temperature/°C
by the TG curves, and in disagreement with the thermal decomposition of lighter trivalent lan-thanides compounds with phenyl substituted deriv-atives of benzylidenepyruvate [13,17,18]. Howe-ver, tests with hydrochloric acid solution on sam-ples heated up to near the minimum oxide level temperature, i. e. 500 ºC (Pr), 550 ºC (Sm, Eu, Gd), 600 ºC (Nd) and 650 ºC (La), confirmed the elimi-nation of CO2 and the presence of carbonaceous residue. The formation of carbonate as intermedi-ate had already been confirmed by the IR spectra [6]. For the cerium compound the thermal decom-position occurs directly to CeO2and in agreement with other cerium compounds [6, 13, 17, 18]
For all the compounds, the final thermal decomposition residues were the respective oxides: CeO2,Pr6O11, Ln2O3 (Ln = La, Nd – Gd). The tem-perature ranges (θ/ ºC) and mass losses (%) observed for each step of the TG curve are shown in Table 3.
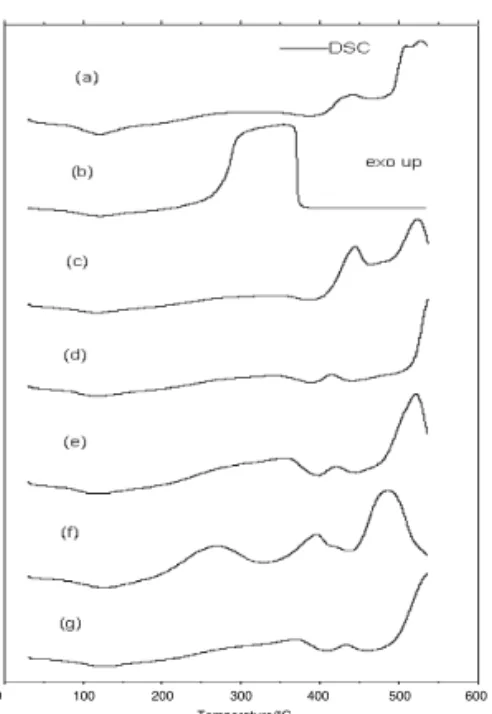
The DSC curves of the compounds are shown in Fig. 4. These curves show endothermic and exothermic peaks that all accord with the mass losses observed in the TG curves. The broad endothermic peak in the range 75- 175 ºC, for all the compounds is attributed to the dehydration. The dehydration enthalpies found for lanthanum to gadolinium compounds were: 82.1; 93.3; 70.8; 74.7; 58.8; 125.0 and 94.8 KJ mol-1, respectively.
The exotherms observed for all the com-pounds with evidence of one (Ce); three (Pr – Gd) or four (La) peaks between 175 – 550 ºC, are attributed
Figure 3. The TG curve of LaL3.3H2O (m =
6,276 mg) in static air atmosphere. L=pyruvate.
After the dehydration the thermal decom-position of these compounds occurs in a single (Ce), two (Pr, Eu), three (Nd, Sm) and four (La, Gd) steps, with the mass losses in each step char-acteristic of each compound. After the last step of thermal decomposition the minimum oxide level temperatures for the respective oxides were: 330 ºC (Ce), 570 ºC (Pr), 620 ºC (Eu), 660 ºC (Nd, Sm), 720 ºC (Gd) and 770 ºC (La). The less final thermal decomposition temperature observed for the ceri-um and praseodymiceri-um compounds must be due to the oxidation reaction (exothermic) of Ce(III) to Ce (IV) and Pr (III) to Pr6O11, respectively.
For all the compounds, except cerium, no intermediate derivative of carbonate is suggested
54 Ecl. Quím., São Paulo, 32(4): 49-54, 2007 to the thermal decomposition of the anhydrous com-pounds, where the oxidation of the organic matter takes place in consecutive and/or overlapping steps.
Conclusions
From TG curves, elemental analysis and complexometry results a general formula could be established for these compounds in the solid state. The X-Ray powder patterns verified that the light trivalent lanthanide pyruvates were obtained in the amorphous state.
The TG/DTG and DSC curves provided information concerning the thermal stability and thermal decomposition of these compounds.
Ackonowledgements
The authors thank FAPESP (Procs. 90/2932-4 and 2005/00926-4), CNPq and CAPES Foundations (Brazil) for financial support.
Received 18 October 2007 Accepted 03 December 2007
[11] F.A. Cotton, in: J. Lewis, R.G. Wilkin (Eds.), the Infrared Spectra of Transition Metal Complexes in Modern Coordination Chemistry, Interscience, New York, 1960, pp. 379-386. [12] K. Nakamoto, Infrared and Raman Spectra of Inorganic and Coordination Compounds, Part B, 5th ed.,Wiley, New York, 1997, pp. 58 – 61.
[13]R. N. Marques, C.B. Melios, M. Ionashiro, J. Alloys Compd.,344 (2002) 88.
[14] N. S. Fernandes, M. A. S. Carvalho Filho, C. B. Melios, M. Ionashiro, J. Therm. Anal. Cal., 59 (2000) 663.
[15] N. S. Fernandes, M. A. S. Carvalho Filho, C. B. Melios, M. Ionashiro, J. Therm. Anal. Cal., 73 (2003) 307.
[16] E. Schnitzler, C. B. Melios, M. Ionashiro, J. Therm. Anal. Cal., 70 (2002) 581.
[17] L. C. S de Oliveira, C. B. Melios, M. Spirandeli Crespi, C. A. Ribeiro, M. Ionashiro, Thermochim. Acta. 219 (1993) 215. [18] M. H. Miyano, C. B. Melios, C.A. Ribeiro, H. Redigolo, M. Ionashiro, Thermochim. Acta, 221 (1993) 53.
A. B. Siqueira, C. T. de Carvalho, E. C. Rodrigues, E. Y. Ionashiro, G. Bannach, M. Ionashiro. Sintese, Caracterização e comportamento térmico dos piruvatos de lantanídeos leves no estado sólido.
Resumo: Foram sintetizados compostos Ln-L no estado sólido, onde Ln significa os lantanídeos leves trivalentes e L é o piruvato. Estes compostos foram caracterizados e estudados utilizando-se a Termogravimetria e Termogravimetria derivada (TG/DTG), calorimetria exploratória diferencial (DSC) difratometria de raios X pelo método do pó, espectroscopia na região do infravermelho, análise elemen-tar e complexometria. Os resultados permitiram obter informações com respeito a composição, desidratação, sitio de coordenação, comportamento térmico e a decomposição térmica destes compotos.
Palavras-chaves:lantanídeos leves; piruvato; caracterização; comportamento térmico.
References
[1] S. Ramamothy, A. Raghavan, V.R. Vijayaraghavan, M. Schutappa, J. Inorg. Chem., 31(1969) 1851.
[2] J. J. Kim, T.E Cummings, J. A. Cok, Anal. Letters, 5 (1972) 703. [3] V. Veervalur. Raaghavan, D. L. Leussing, J.Indian Chem. Soc., 54(1977) 68.
[4] K.N. Mc. Coy, J. Am. Chem. Soc., 61(1939) 2455. [5] G. B. Choppin, R. Cannon, Inorg. Chem., 19 (1980) 1889. [6] W.Brzyska, W. , Polish J. Chem., 58 (1984) 385. [7] W.Brzyska, W. , Polish J. Chem., 59 (1985) 233.
[8] M. Ionashiro, C. A. F. Graner, J. Zuanon Netto, Ecl. Quim., 7 (1985) 10.
[9] G. Socrates, Infrared Characteristic Group Frequencies, 2nd ed., Wiley, New York, 1994, pp. 91 and 236 – 237.
[10] R. M. Silverstein, F. X. Webster, Spectrometric
Identification of Organic Compounds, 6thed., Wiley, New York,
1998, pp 92,93,96 and 97.
Figure 4. The DSC curves of: (a) LaL3.3H2O (m =. 4.912 mg); (b) Ce(L )3.3H2O (m = 4.826 mg); (c) Pr(L)3.4H2O (m = 5.061 mg); (d) Nd (L)3.3H2O (m = 4.934 mg); (e) Sm(L)3.3H2O (m = 4.983 mg); (f) Eu(L)3.3.5H2O (m = 5.020 mg); (g) Gd(L)3.3H2O ( m = 5.276 mg). L=pyruvate.