THIS REPORT WAS PREPARED BY JOÃO CARLOS FERVENÇA, A MASTERS IN FINANCE STUDENT OF THE NOVA SCHOOL OF BUSINESS AND ECONOMICS, EXCLUSIVELY FOR ACADEMIC PURPOSES.THIS REPORT WAS SUPERVISED BY ROSÁRIO ANDRÉ WHO REVIEWED
M
ASTERS IN
F
INANCE
E
QUITY
R
ESEARCH
EDP Renováveis is in the top 5 companies worldwide in terms of wind-installed capacity (7,987 MW in 2012) and has been able to maintain its position thanks to an incredible adaptability to market changes and new trends. The ability to anticipate trends in the sector is key for the success of the company. Perceiving that the Iberian market is already mature, the
company is betting on the addition of capacity in emerging economies – Romania and Poland account for 41% and are the greatest drivers of forecasted growth, and in the U.S (28%), where new opportunities for the energy renewable sector are arising.
The company aims to reduce its long-term leverage by enhancing in an asset rotation strategy, which is based on the selling of minority stakes of consolidated on-going projects, in order to raise funds for other promising prospects.
Albeit the relative importance of subsidies and government support in the sustainability of the sector is decreasing, due to technological improvements, those incentives are still essential for companies like EDPR. The inclusion of a General Tax in Spain (7% over revenues) will impact the target price in € 0.32.
Company description
EDP Renovaveis SA is a renewable energy firm headquarted in Spain. Its core business is based on the development, process and preservation of mainly wind, solar and hydroelectric power stations. Energias de Portugal S.A. is its major shareholder accounting 77.5% of interest, whereas the remaining 22.5% are free float and mainly held by institutional investors.
EDP
R
ENOVÁVEIS
C
OMPANY
R
EPORT
U
TILITIES 6JANUARY 2014STUDENT: JOÃO CARLOS FERVENÇA
[email protected]
Increasing presence on trendy
markets
Leading position in a promising and evolving sector
Recommendation: BUY
Vs Previous Recommendation BUY
Price Target FY14: 5.29 €
Vs Previous Price Target 4.71 €
Price (as of 5-Jan-14) 3.90 €
Reuters: EDPR institutional site, Bloomberg
52-week range (€) 3.58-4.36
Market Cap (€m) 3.492 Outstanding Shares (m) 872
Source: Reuters
Graph evolution prices PSI20 vs EDPR (under construction)
Source: Bloomberg
(Values in € millions) 2012 2013E 2014F Revenues 1.285 1.387 1.501 EBITDA 937 1.031 1.120 Net Profit 136 180 211 Non-Controlling Interests 10 45 53 Total Assets 13,301 13,760 14,269 Total Liabilities 7,553 7,830 8,128 EBITDA Margin 73% 74% 75% Interest Coverage Ratio 2.08 2.36 2.53 EV/EBITDA 7.81 11.26 9,68 EV/MW 0.92 1.31 1.21 Source: Company’s Reports; NOVA Equity Research
-20% -15% -10% -5% 0% 5% 10% 15% 20% 25% 1 -1 -0 9 5 -1 -0 9 9 -1 -0 9 1 -1 -1 0 5 -1 -1 0 9 -1 -1 0 1 -1 -1 1 5 -1 -1 1 9 -1 -1 1 1 -1 -1 2 5 -1 -1 2 9 -1 -1 2 1 -1 -1 3 5 -1 -1 3 9 -1 -1 3
PSI 20 vs. EDPR returns
Table of Contents
Company Overview ……….3
Company Description ………...………3
Asset Rotation Strategy ………5
Comparable Companies. ………...5
Shareholder Structure and Dividend Policy …………...………….……..7
Valuation ……….………8
General Assumptions ………...…………8
Remuneration ………...………...10
Income Statement ………...………10
Balance Sheet ………...………..14
Weighted Average Cost of Capital ………...………15
Equity value Analysis ………...………..17
Markets Multiples Analysis ………...……….18 Markets and Regulations ………....….………..20
Spain ………...………,…….22
Portugal ………...…………...………,…….23
Rest of Europe ………..……,…….24
U.S. ………...……….….,…….25
Brazil ………...………,…….26
Business risks ………..……..27
Opportunities ………..29
Company overview
Company description
EDP Renováveis (Euronext: EDPR) is a leading global renewable energy company devoted to value creation, innovation and sustainability. It operates in two main strategic regions: Europe (Spain, Portugal, Romania and Poland are its main revenue yielders) and America (U.S., Brazil, and prospects on Canada). Consequently, these assets are managed by two regional platforms: EDPR1 Europe – headquarted in Madrid – “oversees the development, construction and operation of assets in the European Union and other Regions renewable energy assets of the EDP Group”2; and EDPR
North America, which is headquarted in Houston, manages assets from the U.S. and Canada.
EDPR is traded at PSI 20 and has an extraordinary ability to adapt itself to market changes and shifts, having now the strategy to enter and consolidate its presence on emerging markets. It has been developing wind farms for more than 15 years and is publicly traded since 2008.
According to the information given by the company, we predict that in the end of 2013, EDPR will have an installed capacity of more than 8,000 megawatts, which corresponds to a growth of over 2,500 megawatts when compared to 2010 and a CAGR of 7.5% in the same period (chart 1). It is interesting to analyse the shifts in weights that each region has suffered, demonstrating the adaptability of EDPR to the economic climate and trends. EDPR is not afraid of readapting its strategy when necessary (charts 2 and 3).
During the period, EDPR clearly bet on the Rest of Europe region, namely on Romania and Poland, as will be explained later on.
EDPR is a company that highly values sustainable practices and corporate social responsibility, having been included in the FTSE4Good index in 2011 and attained the leading position on March 2013. Being the number one is a great accomplishment for EDPR causes, as the company presents corporate social responsibility as one of its flags.
In addition to these, EDP Renováveis is also included in the WilderHill New Energy Global Innovation Index (NEX), which is composed of companies whose innovative technologies and services centre on the manufacture and usage of cleaner energy, its conservation and proficiency (chart 4).
1 Refers to EDP Renováveis
2“Source: Who are we” section in EDP Renovaveis institutional website Chart 1: EDPR Installed Capacity
(MW)
Source: EDPR’s Reports; NOVA Equity Research
Chart 2: Installed Capacity per region 2010 MW
Source: EDPR’s Reports; NOVA Equity Research
Chart 3: Installed Capacity per region 2013E MW
Source: EDPR’s Reports; NOVA Equity Research
Chart 4 – NEX vs. EDPR return
Source: Bloomberg, NOVA Equity Research 12% 7% 4% 0% 5% 10% 15% 0 2.000 4.000 6.000 8.000 10.000
2010 2011 2012 2013
Total Installed Capacity Growth YoY
31% 13% 8% 48% 0% Spain Portugal RoE US Brazil 28% 13% 12% 44% 1% Spain Portugal RoE US Brazil -40% -20% 0% 20% 40% 1 -1 -1 1 4 -1 -1 1 7 -1 -1 1 1 0 -1 -1 1 1 -1 -1 2 4 -1 -1 2 7 -1 -1 2 1 0 -1 -1 2 1 -1 -1 3 4 -1 -1 3 7 -1 -1 3 1 0 -1 -1 3
EDPR’s revenues have been growing consistently over the last 3 years, surpassing the barrier of €1 billion (chart 5). This comes as a consequence of the increasing importance and deeper relevance of renewable energy in the overall energy industry, the solid electricity output (+7% YoY), the quality assets provided by the company (proficient load factors of 29% and high availability of 97.6%) and the selling price increase (1% YoY, from €63.9 p/MW to €64.5 p/MW). Very few companies have more wind-installed capacity than EDPR, which makes EDPR a key player in this sprouting industry.
This revenue comes from the operations the company has on its more than 10 regions, mainly from Spain (38%), U.S (31%) and Rest of Europe (16%) - chart 6. It is important to refer that the greatest share of its Rest of Europe’s revenue comes from France, Romania and Poland 3.
As of September 20134, EDPR had 7.8 gigawatts of EBITDA consolidated
capacity with low market risk as 93% have predefined remuneration schemes with a long-term profile and the little remaining 7% are exposed to US spot wholesale electricity markets. The previously stated risk refers to the fact that we are talking about long-term contracts with defined remuneration schemes, meaning that there is low uncertainty. From the 14.2 terawatts produced in the period (9M12-9M13), 90% were sold under PPAs5 or regulated framework arrangements with long-term maturity until at least 2020 (vs. 88% in 9M12). This means that the company is very little exposed and properly shielded against the short-term volatility of energy prices. The other side of the coin is that if the PPAs are made under extremely low price conditions, and if there is an increase of prices, the company will be negatively impacted when renegotiating the contract.
The average selling price increased 1% YoY6to €64.5, as a result of the higher influence from the production in Europe and the superior prices in the US (+5% YoY) and Brazil (+9% YoY). However, the average realized price in Europe diminished 2%, mainly resultant from the lower selling prices in Spain, outcome of the cessation of the Transitory Regime.
It would not have been possible to attain this boost in revenues without the necessary capital expenditure (CapEx, chart 7). It is understandable that the CapEx is higher in an initial phase, as more investments are necessary to kick off production. We forecasted that the expenditure will remain at high
3 Rest of Europe stands for France, Belgium, Poland, Romania and Italy in our valuation 4 Source: 9M2013 Results from EDP Renováveis
5 Power purchase agreements 6 Evolution in the last year
Chart 5 –EDPR Revenue (M€)
Source: EDPR’s Reports; NOVA Equity Research
Chart 6 – Revenue Breakdown 2012
Source: NOVA Equity Research
Chart 7 –CapEx (M€)
Source: EDPR’s Reports; NOVA Equity Research
14%
21%
0% 5% 10% 15% 20% 25%
0 200 400 600 800 1000 1200 1400
2010 2011 2012
Revenue (€M) Growth
38%
13% 16% 31%
2%
Spain Portugal Rest of Europe US and Canada Brazil
1394
835
611
0 500 1000 1500
levels until 20157. Historically, the WACC has been higher than the ROIC for projects of EDPR (chart 8), although the ROIC has been steadily increasing and is expected to continue its path in our valuation.
One important assumption made was that all the under construction capacity will be incorporated in the first year of the projections – 2013 (table 1).
In order to forecast the additions in installed capacity per region, we observed data given by the company on its Roadshow presentation in the end of 2012, in which it stated the capacity that EDPR forecasted to add between 2012-2015 and the percentage referent to each region. Between 2014-2015, EDPR expects to add to its installed capacity 1,300 megawatts (chart 9). From that year until the end of our analysis, we assumed that the yearly addition would be half of the addition forecasted for 2015.
Asset Rotation strategy
EDPR has been successfully exploring an asset rotation strategy for the past 2 years, having risen approximately €620 million with the sale of minority stakes of Eolic operating parks to investment funds. The last sale was of a park in France for a value of €126 million to 2 subsidiaries of AXO Group. Its goal is to escalate the value of upcoming cash flow of on-going projects, in order to ensue with a reinvestment on projects that are perceived as adding-value opportunities. Due to its extreme importance, we have decided to include this rubric in our valuation, and assumed that each year there would be an asset rotation worth 310M8, until 2015.
The value of the signed agreements averaged an EV/MW value of 1.4m/MW, above our estimate of 1.36m/MW9, meaning the EDPR did a
good business with these transactions, especially when analysing that part of the operations sold are placed in the U.S (where institutional investors are needed). We believe that the asset rotation performed by EDPR was successful as the company is heavily betting on projects with higher expected returns (e.g. Rest of Europe) and needs liquidity for proceeding with them. In fact, there are on-going negotiation for further asset rotations with both Institutional Investors and China Three Gorges.
Comparable companies
For better analysing EDP Renováveis, 5 comparable companies were selected: Acciona, Longyuan, Enel Green Power (all included in the NEX
7 According to the roadshow made in December 2012, the company forecasted CapEx of 3.2 billion between 2012-2015 8 Average annual amount of the 4 transactions in the last 2 years
9 Case-base Scenario
Chart 8 – ROIC vs. WACC
Source: EDPR’s Reports; Bloomberg; NOVA Equity Research
Table 1
Under construction
capacity MW 9M13 2013E
Spain 0 0
Portugal 5 34
RoE 169 256
US 0 30
Brazil 0 0
Source: EDPR’s Reports; NOVA Equity Research
Chart 9 – Additions MW 2014-2015
Source: EDPR’s Reports
2,27% 2,81% 3,45% 8,50%
14,50%
11,80%
0,00% 2,00% 4,00% 6,00% 8,00% 10,00% 12,00% 14,00% 16,00%
2010 2011 2012
ROIC WACC
4% 2%
11% 2%
23% 18% 2%
28% 9%
index), Iberdrola and NextEra10. These companies were chosen mainly because 4 of them, along with EDPR, represent the Top5 players regarding wind-installed capacity. The “outlier” Enel Green Power was also taken into account as it is present in the same regions as EDPR and has also an important presence in the wind production business.
Source: Company’s reports; NOVA Equity Research
Firstly, in terms of operations, EDPR is the company among its peers12 with
the highest EBITDA margin13, however is only slightly surpassed by ENEL
Green Power in terms of operating margin14 (charts 10 e 11). It is important to point out the considerable difference between both margins, explained by the high values of depreciation and amortization of the installed capacity. EDPR operates in a capital intensive industry, meaning that it requires a great quantity of expensive property, plants and equipments to operate, which logically have to be depreciated and affect the income statement. We understand depreciation to be linearly dependent of the installed capacity (% of installed capacity) in our forecasts. In terms of load factor (chart 12), this is, the ratio between the actual generation of power and the theoretical output, EDPR has attained in the 3rd Quarter of 2013 an average value compared to its peers15, as Enel Green Power16 and Iberdrola were able to reach higher percentages. Since its inception and throughout the company’s operating years, EDPR has not been able to surpass the 30% barrier and has always had a load factor above 28%.
EDPR has a small market capitalization when compared to its peers (€3,484M, being only Acciona smaller17). A very important measure in this
10 Description of the companies on annex 1
11 Some of the values correspond to data from 2012 year end and other from 9M13
12 Our analysis considers the comparable companies as a whole, and not only the Eolic operations 13 EBITDA/Revenues
14 EBIT/Revenues
15 No information encountered for NextEra 16 Includes water load factor
17 Market-cap: Iberdrola (€25,393M), Acciona (€3,212M), Enel Green Power (€7,025M), Longyuan (€34,897M), NextEra
(€29,337M)– data from 2012 year end
Table 2 – Installed
Capacity MW11
Top 5 Companies Iberdrola Longyuan NextEra EDPR Acciona
Installed Capacity 14101 10660 10000 8165 6291
Total (9M13) 49217
Chart 10 – EBITDA Margin 2012
Source: Company’s Reports; NOVA Equity Research
Chart 11 – Operating Margin 2012
Source: Company’s Reports; NOVA Equity Research
Chart 12 – Load factor (%)
Source: Company’s Reports; NOVA Equity Research
0,00% 20,00% 40,00% 60,00% 80,00% Iberdrola
Acciona Longyuan ENEL GP NextEra EDPR
0,00% 10,00% 20,00% 30,00% 40,00% Iberdrola
Acciona Longyuan ENEL GP NextEra EDPR
0,00% 10,00% 20,00% 30,00% 40,00% 50,00% Iberdrola
sector is the capital expenditure per megawatt that is added to the installed capacity. As the ratio explains by itself, the lower its value, the more efficient will a company be in adding operating capacity. As we do not have the information of the CapEx for the 4th quarter of 2013, we opted to analyse this ratio relative to the additions in megawatts registred between 2011 and 2012.
EDPR, comparing to its peers, is being extremely efficent in the capital it allocates per megawatt (€1.21). The company expects to mantain this ratio between 1.2 and 1.3 over the next 3 years. It is interesting to notice that only Iberdrola has spent less capital p/MW it has installed in the period, and Acciona spent 55% more p/MW.
In order to better understand EDPR’s position in relation to its peers in terms of rentabiity of investments, we also opted to analyse the ratio between net tangible assets and installed capacity (chart 13). EDPR has a ratio of 1.29, being only above NextEra in terms of operational relation between its net tangible assets and the installed capacity it has. Also, if we look at the relation between the ROIC and WACC in 2012, we can understand that margins are all negative (except for NextEra), which is a recurrent fact in the renewable energy sector (chart 14), although EDPR’s ROIC increases in our valuation, reaching 5.4% in 201818 (increase of nearly 2% since 2012). Regarding the ability to pay its short-term obligations, EDPR is again on an average position, with a current ratio of 0.82 (chart 15). Only Iberdrola and Acciona have enough liquidity in their current assets that would cover its current liabilities. In an opposite position, Nextera has a very low ratio and presents itself in an illiquid position.
Another aspect that is relevant to analyse regarding EDPR’s peers is their capital structure (or leverage), as it will directly influence the weighted average capital cost19. EDPR finances itself 53% through debt20, which
when compared to the company’s we analysed, is a fairly reseonable share. Only Longyuan and NextEra have lower values (48%), whereas Acciona is extremely levereged and could face problems later on due to this (chart 16).
Shareholder Structure and Dividend Policy
EDP Renováveis is 77.5% owned by Energias de Portugal S.A, while the other 22.5% are flee float. This second share is mainly held by institutional investors, rather than private ones. The company has 3 subsidiaries: EDPR
18 Annex 8
19 Calculated at market values
20One of the asset rotation strategy’s goals is to reduce this percentage, giving EDPR the ability to finance itself
Chart 13– Net Tangible Assets /
Installed Capacity in 2012
Source: Bloomberg; Company’s reports; NOVA Equity Research
Chart 14– ROIC vs. WACC
Source: Bloomberg; Company’s reports; NOVA Equity Research
Chart 15– Current Ratio 2012
Source: Bloomberg; NOVA Equity Research
Chart 16– Leverage (D/(D+E)) 2012
Source: Bloomberg; NOVA Equity Research
0 2 4 6
Iberdrola Acciona Longyuan NextEra EDPR
5,2% 3,6%
6,2%
5,0% 4,5% 3,5%
-10,0% -8,0% -6,0% -4,0% -2,0% 0,0% 2,0% 4,0% 6,0% 8,0%
ROIC Margin
0,0 0,2 0,4 0,6 0,8 1,0 1,2 Iberdrola
Acciona Longyuan ENEL GP NextEra EDPR
0% 50% 100%
Europe (owned 100% by EDPR Group), EDPR North America (owned 100% by EDPR Group), and EPR Brazil (owned 55% by EDPR Group and 45% by Energias do Brasil, which is by its turn owned 65% by EDP).
China Three Gorges recently entered in the capital structure of the company (21.35% of voting rights) and it will an extremely important help for EDPR to attain its goals. CTG is looking for high quality projects with transparent and stable cash flows, through partnerships for the sale of minority stakes in wind farms and for co-CapEx programs until 2015. CTG will provide for liquidity and financial support in the development of some projects. In fact, a 2nd asset rotation transaction is in progress.
The company has been announcing constantly its intention of distributing dividends (payout ratio of 25%-35%), however it has never been able to fullfill its investors’ expectations until this year, when it distributed 28% of the net profit of the period (€129M). It was the first year that the company attained such a wealthy result, possibily meaning that it has chosen to retain net profits and not distribute dividends until this point, in order to use those funds to finance its operations. We understand that the opportunity cost of retaining those net profits was perceived as being higher than the opoortunity cost of distributing them, once there were projects being develop that could yield higher returns to patient investors. For this reason, we believe that the company did well in retaining the net profits it was yielding, however it was necessary to give the market a signaling of wealth, which was accomplished with the recent distribution of dividends. We assumed, in our forecasts, the payout ratio to be equal to 25% in the period of analysis.
Valuation
General Assumptions
In order to proceed with the valuation of the company, a series of assumptions had to be made. As one can easily understand, a global company that operates in several regions, especially in the energy sector, has different remuneration schemes, benefits, obligations, demands, etc, in each region. Due to this, it is way more reasonable and accurate to value each region seperatly and then, proceed with a sum of the parts (SoP) approach to reach the total value. The main criteria for the execution of the projects is its rentabiity (creation of value for the company through ROIC) and the interest of eventual investors in future asset rotation transactions. Thus, we set 2 scenarios: a base-case scenario (75%) and a pessimistic
scenario (25%). We valued 9 different regions, using the discounted cash
accurate for early stage regions (such as Italy), we also understand that they already have installed capacity, load factors and a price that is being charged, meaning that we can reach for values of revenues and proceed with the valuation accurately21.
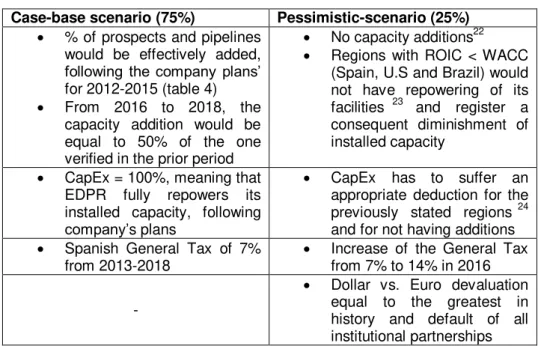
Table 3 – Case-base vs. Pessimistic scenarios
Case-base scenario (75%) Pessimistic-scenario (25%)
% of prospects and pipelines would be effectively added, following the company plans’ for 2012-2015 (table 4)
From 2016 to 2018, the capacity addition would be equal to 50% of the one verified in the prior period
No capacity additions22
Regions with ROIC < WACC (Spain, U.S and Brazil) would not have repowering of its facilities 23 and register a
consequent diminishment of installed capacity
CapEx = 100%, meaning that EDPR fully repowers its installed capacity, following company’s plans
CapEx has to suffer an appropriate deduction for the previously stated regions24
and for not having additions
Spanish General Tax of 7%
from 2013-2018 Increase of the General Tax from 7% to 14% in 2016 -
Dollar vs. Euro devaluation equal to the greatest in history and default of all institutional partnerships Both scenarios present different revenues, due to the evident difference in installed capacity, having this difference an impact in the price per share attained. For the pessimistic-scenario the CapEx is lower in the regions where there will be no repowering of existent facilities that attain their maturity.
As stated in the first page of our valuation, the introduction of the Spanish General Tax will reduce the company value in Spain (one of the most important business units of EDPR), and even more with the increase of 7% that we decided to include in the pessimistic-scenario (goal of eliminating the tariff defficit). The EV p/MW decreases from €1.75 to €1.28.
The Dollar-Euro exchange rate in the pessimistic-scenario is of 1.59, and along with the default of instituional partners and the other assumptions made, makes the EV/MW value of EDPR NA go from €0.87 to €0.42.
The goal of this valuation is to find the Enterprise Value per region, add them up, and then subtract the value of the market value of debt and non controlling interests, in order to reach the company’s Equity Value and the
21 An alternative way to reach for a valuation for Italy would be through multiples
22 Except for Rest of Europe and U.S., as they are the regions that EDPR expects to invest more in terms of capacity additions,
until 2015
23 In the case-base scenario even the regions with ROIC < WACC will repower its facilities, as EDPR has been following that policy
in the previous years and there is no information available that would suggest a change of its policies –Spain is EDPR’s core region, a huge investment is being made in the U.S. and Brazil is on its early stage – see annex 8
24 With no repowering The CapEx for these regions is equal to 62.5% of the case-base scenario Table 4 - Breakdown installed
capacity (MW)
2010 2013E 2015F 2018F
Portugal 838 1039 1062 1079
Spain 2050 2310 2361 2400
RoE 551 1207 1945 2499
US 3224 3667 4036 4313
Brazil 14 84 202 291 Total
Installed
Capacity 6676 8307 9607 10582
price per share. We opted to calculate the price per share both for the case-base scenario and for the pessimistic one and then allocate the e percentage each scenario has. The main reason for chosing this road is the fact that an investor can apply its own percentage for each scenario and easily reach the price he thinks would be fair, with our assumptions.
In addition, the company does not provide a breakdown of all accounts of its balance sheet per region, nevertheless we did not need all of them. For valuation purposes, it would be sufficient to have/reach values for the accounts that would give us the capital expenditure, the networking capital and the other assets and liabilities, as these are the ones that influence the operating cash flow calculated from the income stament.
Remuneration
The electricity traded prices vary according to the remuneration scheme and to the country in which the transaction occurs. For that purpose it is necessary to understand that, although EDPR offers the same service in the countries it operates, the price and the way it collects its revenues is different. In what concerns the price forecasting, one alternative was to look at the future energy prices, however we considered it would be more accurate to look at the price trend in the past years (special attention to the prices practiced in 2013 until its 3rd quarter) and apply an average value or
simply use the 3rd quarter price. The achieved price per region would be linked to inflation movements thereafter. This was a topic that could have raised doubts, but if we look into the price evolution along with the growing maturity of markets, it is reasonable to assume that prices are, on average, on the equilibrium point (especially in the regimes of Pool + Green Certificates), and will almost solely evolve with inflation.
Income Statement
In order to reach the forecasted revenue per region, it is necessary to understand the actual remuneration scheme and the one that is most likely
Feed in tariff: Long-term contracts to renewable energy producers, who are awarded with a lower per KWh price (wind). It offers a cost-based compensation to renewable energy producers, providing price certainty that helps them finance renewable energy investments
Pool + Green certificates: An energy pool facilitates competition between generators and the calculation of the equilibrium price. All market participants are signatories to a pooling agreement that guides the operations of the pool.
A green certificate is a tradable commodity that proves that certain electricity is generated using renewable energy source. It is a way that governments have to reward green investors.
to to happen in the next years. For doing so, it is indispensible to proceed with an individual analysis, as was described in the section above.
Albeit there are different remuneration schemes, the formula used to calculate the expected revenue25 was similar for each country.
The electricity output will vary according to what was previously explained: each year, each region will suffer an addition of installed capacity and the existing one will continue to produce. However, it was necessary to find a formula to forecast the output that related the installed capacity and average load factors. With the formula given below, we reached a ratio26 for the 3 base years and then, applied that ratio (trend adjusted) in the place of the electricity we wanted to forecast.
The difference in each region comes obviously from the electricity output and the average selling price. The price evolution (chat 17) was already explained above. We acknowledge that the price of electricity output from renewable sources is dependent upon different factors. The capacity factor
for instance27 is extremely important in the price asked by the company and, as it has been stable throughout the years (28%-30%), we do not believe it will change in the forthcoming years (at least change in a negative way).
The cost of capital28 is also critical and, if EDPR pursues more projects
regarding Solar PV, it will be able to decrease the company’s overall cost of capital and possibly practice a more competitive price. The marginal cost29
is also extremely important and decisive in the accomplishment of the final price.
Our valuation begins in 2013, which is the first year that will have all installed capacity linked to the RD 661/2007 regime (Spain), having all the MWs under the Transitory Regime transferred. There are two options that are pending on the publishing and approval of the legislation. For assets under the special regime30, RD 2/2013 is mandatory and it reffers to a
feed-in-tariff of €81.247 per MW for 20 years31 linked to inflation.32 This was the
pricing method that we assumed in our valuation. The alternative method is the RD 9/201333 and the return is yielded through the Spanish 10-year bond
25 Average Revenue = Electricity output × Average Selling Price × (1+ Expected inflation)
1000
26 Ratio = Installed Capacity (MW) × Average Load Factors % × Electricity Output (GW)
1000
27 Or load factor is the average output power to peak power that the plant can deliver 28 Source: Article on the Greenrhinoenergy website
29 The amount of money needed to produce an extra Kwh 30 Source: 9M2013 Results from EDP Renováveis 31 Started in 2013
32 Annual inflation, excluding energy products and food, and any impact of tax changes, minus “x” (50 bps) 33 RD 2/2013 to lose its effect once full framework enters into force (reference date Jul-2013)
Chart 17 – Average Price Evolution (€)
Source: EDPR’s reports; NOVA Equity Research 0,0% 1,0% 2,0% 3,0% 4,0% 5,0% 6,0% 7,0%
56 €
58 €
60 €
62 €
64 €
66 €
68 €
70 €
72 €
74 €
76 €
2010 2011 2012 2013E 2014E 2015E
yields plus 3%, being the remuneration scheme based upon past and future returns of a standard asset.
In addition to this, from January 2013 onwards, the government introduced a 7% General Tax over electricity sales generated in Spain, meaning that part of the revenue EDPR collected is now transferred to the government (chart 18). Nevertheless, we will see in the next session that albeit this tax, Spain continues to be one of the strongest contributors to EDPR’s profit with an EV/MW of €1.75.
Portugal is also under a feed-in tariff and has 2 different regimes (chart 19)
that depend on the origin of the energy34: i) all the output resultant from EDPR’s EBITDA is under the “old” regime35 and suits wind farms accredited
prior to February 2006. The initial duration (15 years) remuneration scheme is equal to a feed-in tariff indexed to CPI movements and the next 7 years correspond to the market price with a cap/floor mechanism (€74 p/MW - €98 p/MW); ii) ENEOP’s capacity is paid under the “new” regime36. The price is
set in an international private auction, having been decided a €74 p/MW tariff for the first year, which is updated according to inflation. Posterior to an initiial period, prices will be indexed to the market electricity prices and Green Certificates, if such a market exists.
It is relevant to say that we assumed that the installed capacity additions would mantain the same ratio between EBITDA and ENEOP’s wind farms (chart 19), and that the price would then be equal to the one registered in the 3rd quarter of 2013 evolving in the following years according to expected CPI movements.
The remuneration scheme in Romania works under a market price plus Green Certificate system. For the existing assets37, there is an incentive of 2 GC38 p/MW until 2017 and after that date prior to reaching 15 years, the incentive turns into 1 GC p/MW. Half of those 2 GC received until the end of 2017 can only be sold from 2018 onwards. For new assets, there is a draft recommendation that consists of 1.5 GC until 2017 and 0.75 GC from 2018 forth until achieving 15 years.
The remuneration scheme in Poland39 is very similar to the one practiced in Romania, being the price for existing assets reached in market, bilateral contracts or sells to distributors at monitored prices (PLN 201.440 p/MW in
34 Source: EDPR presentation September, 2013 35 Before DL 33A/2005
36 After DL33A/2005
37 Source: EDPR presentation, September 2013
38 GC are tradable on market under a cap and floor system (€28.9 - €58.8) 39 Source: EDPR presentation, September 2013
40 PLN to Euro Exchange rate of 4.27 in 2013 Chart 19: Revenue Breakdown in
Portugal
Source: EDPR’ Reports; NOVA Equity Research
61%
39% EBITDA MW
ENEOP Chart 18: Effect of General Tax on
Spanish Revenues (€)
Source: EDPR’s Reports; NOVA Equity Research
496 €
482 € 488 €474 €
460 € 462 € 464 €
450 € 456 €
443 €430 €
432 €
380 €
400 €
420 €
440 €
460 €
480 €
500 €
520 €
2013E 2014E 2015E 2016E 2017E 2018E
2013). In terms of Green Certificates, wind receives 1 GC p/MW but there is a replacement cost for suppliers that do not follow the GC plan, which was set at PLN 297 and is linked to inflation. The situation for new assets is still under study and not clear for further analysis.
Revenues from U.S come not only from direct electricity transactions, but also from tax incentives (chart 20). In terms of remuneration frameworks41
for the existing assets, it works under a market price plus green certificates system. The transactions can be set under PPAs, hedges or merchant prices. We observed the trend in the last 3 years and concluded that the share of revenue coming from PPA agreements have been increasing 3% YoY42. In line with that, we decided to maintain that increase until PPA agreements account for 84% of the total revenue (2016). This means that EDPR’s exposure to market prices will continue to diminish throughout the forecasting years. In addition, we observed that the PPA and merchant prices did not alter much in the last 3 years43, which reduces even more the
volatility and uncertainty of revenues. Also, there is another very important component in the total revenue that comes from the income from institutional partnerships. We assumed that it would be equal to a percentage of the total output produced (1.5%), following the trend verified in the previous years.
In addition to the revenue collected from market prices, EDPR receives green certificates, also know as Renewable Energy Credits (REC), which are conditonal to each state’s governance and decisions. It is one of the measures of the New Economic Stimulus Package44, and consists on giving
to renewable energy producers a lump sum cash rebate or, for larger organizations, a 5-year payback plan from their regional utility firm.
In what concerns the tax incentives and depending on the state and legilsation, the most important incentive are the Production Tax Credits (PTCs), which are income tax credits directly linked to energy production (MW), and existent throughout the first 10 years of operations. The last extension made by the congress since its inception (1992), expires at the end of 2013 and it is vital that it gets extendend again.
In order to get the EBITDA per region, it was necessary to forecast the operating expenses. We calculated the percentage of operating costs per revenue for the period of 2010-2012, and then applied an arithmetic average for the forecasting period on the accounts that it is composed of, as the vast
41 Source: EDPR presentation, September 2013 42 Represented 75% of the total revenue in 2012
43 Merchant prices were in the interval between USD 30.1 and 31.2
44 American Recovery and Reinvestment Act of 2009, signed as a response of the Great Recession - ARRA
Chart 20 – U.S Revenue
Breakdown (€)
Source: EDPR’s reports; NOVA Equity Research
270 € 324 € 350 € 356 € 378 € 399 €
106 € 120 € 124 € 113 € 118 € 123 €
0% 10% 20% 30% 40% 50% 60% 70% 80% 90% 100%
2010 2011 2012 2013E 2014E 2015E
majority of the costs were variable and directly dependent on the output produced and revenue gathered (largely came from operations and maintenance activities, accounting for around 75%, and personnel costs). If one analyses EDPR’s EBITDA margin, it is highly above its peers (as stated before), and this can be explained by the agreement45 the company has with
Vestas, having the advantage of choosing the wind turbine models that it
wants and to prolong its 2-years Operating and Maintenance Agreement to 5 or 10 years. This close relationship to Vestas gives EDPR a competitive advantage that is reflected on the EBITDA margin.
Nevertheless, in order to forecast depreciations and amortizations we presumed that it would be a portion of the total installed capacity46. The tax
rates to apply to the EBIT were corporate tax rates47.
Balance Sheet
For valuation purposes, what matters is the value of the cash flow to be discounted to the WACC, which is equal to the previously explained operating cash flow minus the capital expenditure, changes in networking capital and changes in other assets and liabilities.
In order to reach the CapEx (chart 21), we had to forecast the value of two accounts in the balance sheet: PP&E and intangible assets and goodwill. We assumed that the repowering CapEx was already included in the CapEx value the company provided on its accounts, and as we presume the company will continue to operate in the PP&E’s that reach its end life (case-base scenario), the basis to forecast future CapEx was already established. Initially we decided that the forecasting key driver for the CapEx would be the historical average CapEx per megawatt, which would differ in each region48. As stated before, the company has an average CapEx p/MW considerably lower than its peers (€1.2-€1.3) and expects to maintain it (our assumption in the valuation performed) or even decrease it, due to possible technological development.
Other important indicator for the final valuation is the networking capital. We had to forecast trade receivables49, debtors and other assets from
45 Master Supply Agreement
46 Assumed that the % of installed capacity to use was an average of the 3 base years 47 Source: corporate tax rates presented by KPMG in its institutional website
48 Each region CapEx p/MW corresponded to its historical average, except for the Rest of Europe region, as throughout the 3
business-case years showed enormous volatility. In order to solve this problem we opted to used in this region the overall forecasted MW p/region by the company for the period (CapEx = 3,2; GW additions = 2,3 => CapEx p/MW = 1,39) 49 Days sale outstanding (Trade receivables/(Total revenue/365))
Chart 21– CapEx p/MW
Source: EDPR’s Reports; NOVA Equity Research
916 € 685 €
487 €
923 € 923 €
462 €
0,0 €
0,2 €
0,4 €
0,6 €
0,8 €
1,0 €
1,2 €
1,4 €
1,6 €
0 €
200 €
400 €
600 €
800 €
1.000 €
2010 2011 2012 2013E 2014E 2015E
commercial activities50, inventories51, current tax assets52, trade and other commercial payable53, and current tax liabilities54.
Weighted average cost of capital – WACC
In order to correctly discount the cash flows from each region, different WACCs were calculated, which comprise both costs for equityholders (cost of equity), debtholders (cost of debt) and institutional partners in the U.S (cost of tax equity). The cash flows were calculated at current prices, in local currencies55, being the discount rates equally nominal, current and in local currencies.
Beginning with the cost of equity, we used an approximation of the CAPM56. Concerning the risk free rate, we divided our analysis per 2
regions: i) European countries, ii) Brazil and North America. For the latter, we simply considered the 10-year U.S government bond. For the European countries we opted to form an equally weighted basket composed by the countries awarded with triple A government 10-year bonds57 (table 6). We
assumed that all European countries would have the same risk free rate, which would then suffer an adjustment related to the specific country risk premium.
Then it was necessary to calculate the beta linked to the market premium. We opted to look at EDPR’s previously stated comparable companies. It is necessary to find their unlevered betas, this is, the beta that does not take into account the market debt to equity ratio (how leveraged the company is). After reaching all unlevered betas of the peers, we average them and apply the debt to equity ratio correspondent to the company, in order to get the levered beta and apply it in the CAPM model.
Table 7 - Beta
Comparable Company Country Beta Adj. Rate Tax Mkt Cap (Equity) Debt D/(D+E) D/E Unlev.
EDPR Spain 1.23 30% 3484 3874 0.53 1.11 0.69
Acciona Spain 1.15 30% 3 212 8772 0.73 2.73 0.40
Longyuan China 0.77 25% 62 288 57477 0.48 0.92 0.46
ENEL Green Power Italy 1.41 31% 29 507 66539 0.69 2.26 0.56
NextEra US 0.76 40% 29 337 27359 0.48 0.93 0.49
Median 0.52
1.11 Levered
Beta
EDPR 0.92
50 Days (Debtors and other assets from commercial activities/(suppliers and services/365)) 51 % Installed capacity
52 % Revenues
53 Days (Trade and other commercial payable/(suppliers and services + personnel costs and employee benefits + other operating
costs)/365) 54 % Revenues
55 Except for Romania, as EDPR presented its operations in the region in Euros
56 Capital Asset Pricing Model: Risk Free + (ß × Market Premium) + (∂ × Country Risk Premium) 57 Norway, Sweden, Switzerland, Finland, Denmark, Netherlands, Germany, U.K
Table 6 Risk Free
Basket with triple A European countries
Country Bond 10Y
Norway 2.83 %
Sweden 2.31 %
Switzerland 0.95 %
Finaland 1.94 %
Denmark 1.82 %
Germany 1.75 %
U.K 2.79 %
We used a value of 6% for the market risk premium, as it is widely used and accepted among the most recognized corporate finance literature.
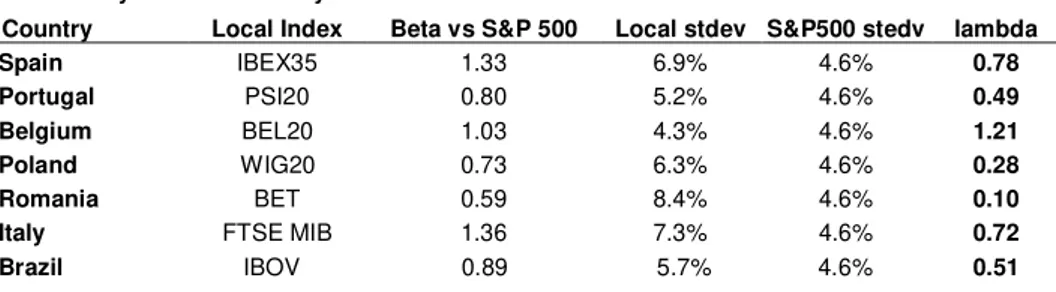
To finalize the calculation of the cost of equity per region we need to add a systematic country risk modulator, also known as lambda.
Table 8 - Systematic Country Risk modulator -
lambda Country Local Index Beta vs S&P 500 Local stdev S&P500 stedv lambda
Spain IBEX35 1.33 6.9% 4.6% 0.78
Portugal PSI20 0.80 5.2% 4.6% 0.49
Belgium BEL20 1.03 4.3% 4.6% 1.21
Poland WIG20 0.73 6.3% 4.6% 0.28
Romania BET 0.59 8.4% 4.6% 0.10
Italy FTSE MIB 1.36 7.3% 4.6% 0.72
Brazil IBOV 0.89 5.7% 4.6% 0.51
Its function is to cross the beta of the local indexes with the ones of a representative and recognized world market58 with a volatility ratio between the market and local volatilities. Basically, it attempts to only account for the systematic component of the total country risk, which is the one that truly matters and should be quantified.
Afterwards, it is necessary to multiply this lambda to a country risk premium59. Although we acknowledge that Damodaran makes strong
assumptions, such as considering that all the country risk is systematic and that the sector’s risk is perfectly reflected in the country risk, we believe that by adding the lambda factor, this will turn out to being a good proxy for countries that EDPR has operations in (table 9).
Rest of Europe Table 10 - Cost of
Equity - CAPM Spain Portugal France Belgium Poland Romania Italy U.S. Brazil
Risk Free 2.06% 2.06% 2.06% 2.06% 2.06% 2.06% 2.06% 2.62% 2.62%
Beta 0.90 0.90 0.90 0.90 0.90 0.90 0.90 0.90 0.90
MKT Premium 6% 6% 6% 6% 6% 6% 6% 6% 6%
Lambda 0.78 0.49 0.00 1.21 0.28 0.10 0.72 0.00 0.51
CRP 2.00% 3.25% 0.00% 0.70% 1.00% 2.00% 1.75% 0.00% 1.75%
E(R) 9.04% 9.08% 7.48% 8.33% 7.76% 7.68% 8.73% 8.04% 8.94%
As EDPR does not have a tradable bond, we had to calculate the cost of debt60 through an alternative method. We opted to use the synthetic rating
approach. The risk free rate is exactly the same as the one calculated for the cost of equity. We opted to look at the market yield from a 10-year bond issued by EDP61, so as to meet duration of cash flows. In order to find the
rating of EDPR we had to calculate the interest coverage ratio (€2.08 in
58 S&P500
59 Source: Default spreads for each country Moody’s – Damodaran research
60 Cost of Debt = (Risk Free + Credit Default Spread + Spread between EDP and EDPR) × (1- Default %) + (Risk Free + Credit
Default Spread + Spread between EDP and EDPR) × Default % × Recovery Rate 61 EDP CDS EUR SR 10Y CORP – Term 20/03/2024
Table 9 - Country Risk Premium
Default spreads by country Moody's
Country CRP
Spain 2.00%
Portugal 3.25%
France 0.00%
Belgium 0.70%
Poland 1.00%
Romania 2.00%
Italy 1.75%
2012)62 and, assuming that the company has a low market capitalization, according to Damodaran that corresponds to a rating B and a credit default spread of 6.5%. This was necessary to reach the risk spread between EDP and EDPR, which we found to be 3%63.
The probability of default comes in line with the fact that EDPR is not default-risk-free, and we acknowledged to be equal to 2.3%64. A recovery
rate of 60% was assumed, as it is considered to be a reasonable rate for companies with the rating of EDPR.
Table 11 - Cost of Debt - Synthetic
rating approach Rest of Europe
Spain Portugal France Belgium Poland Romania Italy U.S. Brazil
Risk Free 2.06% 2.06% 2.06% 2.06% 2.06% 2.06% 2.06% 2.62% 4.37%
Credit Risk Spread EDP 3.30% 3.30% 3.30% 3.30% 3.30% 3.30% 3.30% 3.30% 3.30%
Spread EDP and EDPR 3.00% 3.00% 3.00% 3.00% 3.00% 3.00% 3.00% 3.00% 3.00%
Probability of Default 2.3% 2.3% 2.3% 2.3% 2.3% 2.3% 2.3% 2.3% 2.3%
Recovery Rate 60% 60% 60% 60% 60% 60% 60% 60% 60%
Taxes 30% 25% 33% 34% 19% 16% 31% 37% 34%
E(R) 8.28% 8.28% 8.28% 8.28% 8.28% 8.28% 8.28% 8.84% 10.57%
E(R) after taxes 5.80% 6.21% 5.52% 5.46% 6.71% 6.95% 5.68% 5.55% 6.98%
In addition to the cost of equity and cost of debt, in the U.S there is another type of investor (Institutional partners) that discount their cash flows to a cost of tax equity, which is equal to 8.5% according the information gathered concerning renewable power project finances.
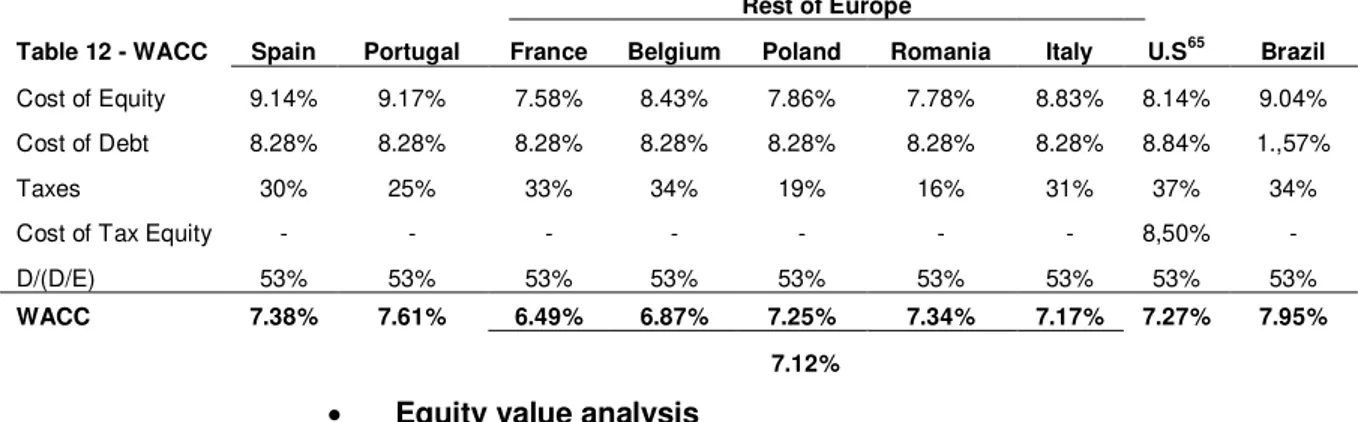
Rest of Europe
Table 12 - WACC Spain Portugal France Belgium Poland Romania Italy U.S65 Brazil
Cost of Equity 9.14% 9.17% 7.58% 8.43% 7.86% 7.78% 8.83% 8.14% 9.04%
Cost of Debt 8.28% 8.28% 8.28% 8.28% 8.28% 8.28% 8.28% 8.84% 1.,57%
Taxes 30% 25% 33% 34% 19% 16% 31% 37% 34%
Cost of Tax Equity - - - 8,50% -
D/(D/E) 53% 53% 53% 53% 53% 53% 53% 53% 53%
WACC 7.38% 7.61% 6.49% 6.87% 7.25% 7.34% 7.17% 7.27% 7.95%
7.12%
Equity value analysis
Although the most important value is the overall equity value of the company and the price per share, it is extremely important to look at the regions seperatly and register the ones that are yielding the greatest returns and the ones that need a revamp of some scale.
62 Interest Expenses / EBIT
63 EDP is a high market capitalization company with a rating of BB, giving it a spread of 3.50%
64According to Moody’s Investors Service, Global Corporate Finance default rates from 1920-2010 in the Energy & Environment industry
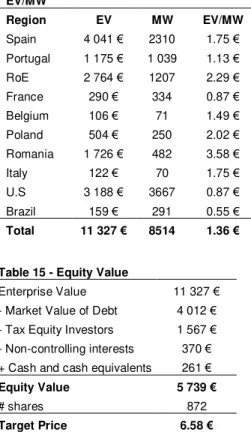
In order to reach the price per share, we added the per region equity values (the growth of the valuation is equal to estimated inflations66 – table 13) and then subtracted the overall market value of debt67, liabilities correspondent to the tax equity investors, non-controlling interests, and then added up cash and cash equivalents. This corresponds to the equity value, which is divided by the number of outstanding shares in order to get the price per share. In what concerns the entreprise value, we can make a comparative analysis per region through the EV/MW multiple, this is, the amount of enterprise value per megawatt of installed capacity (table 14 – case-base scenario). Focusing strictly on this multiple, it seems that Romania, Poland and Spain are the regions with the best results per megawatt, however one should also take into account other factors such as the development stage of the renewable energy sector in the country and even the maturity of EDPR’s operations in the region.
According to the company’s strategy, its presence in matured markets will start losing weight and importance in comparison to emerging markets. Between 2012 and 2015 the business plan for EDPR highly focuses on growing its presence in emerging markets in Europe and consolidating its presence in the North American market68.
Relatively to the market value of debt, EDPR has an average debt maturity of 6 years and an estimated cost of debt of 8.5%. In order to reach it, we calculated the market value of the principal – discounting the financial debt to the cost of debt – and the market value of the coupons through the discount of the interest expense to the cost of debt also. We now have everything to reach the Equity Value and the Target Price (table 15).
Market multiples analysis
It is important to perform a market multiples comparison to understand where EDPR stands in relation to its peers. We opted to look at 5 key ratios69: EV/EBITDA, EV/EBIT, P/E, P/B tangible and interest coverage
ratio. While the first 2 are intuitive and give us a taste of the weight the operational activity has on the enterprise value of the company (capital structure neutral), the other 3 provide us other type of information.
66Average of the Bloomberg’s forecasted inflation for the period between 2013-2015 67 Financial debt as principal and interest expenses as coupon payments
68 For valuation purposes we opted to disregard the prospects the company has on emerging markets, that accounted for 12% of
the forecasted capital expenditure 69 Source: Bloomberg data Table 14 -
EV/MW
Region EV MW EV/MW
Spain 4 041 € 2310 1.75 € Portugal 1 175 € 1 039 1.13 € RoE 2 764 € 1207 2.29 € France 290 € 334 0.87 € Belgium 106 € 71 1.49 € Poland 504 € 250 2.02 € Romania 1 726 € 482 3.58 €
Italy 122 € 70 1.75 €
U.S 3 188 € 3667 0.87 € Brazil 159 € 291 0.55 €
Total 11 327 € 8514 1.36 €
Table 15 - Equity Value
Enterprise Value 11 327 € - Market Value of Debt 4 012 € - Tax Equity Investors 1 567 € - Non-controlling interests 370 € + Cash and cash equivalents 261 €
Equity Value 5 739 €
# shares 872
Target Price 6.58 €
Spain 1.2%
Portugal 0.8%
France 1.3%
Belgium 1.5%
Poland 1.9%
Romania 3.6%
Italy 1.4%
U.S 2.4%
Brazil 5.8%
Table 16 - Comparable Ratios 2012
Comparables EV/EBITA EV/EBIT P/E P/B tangible Int. ratio
Iberdrola 7.25 13.59 9.14 1.77 2.57
Acciona 7.48 15.52 17.03 0.95 1.31
Longyuan 9.78 15.77 12.44 1.64 -
ENEL Green Power 7.96 13.74 17.56 1.43 3.94
NextEra 11.17 17.21 16.00 1,85 3.16
EDPR 7.81 16.52 28.53 0.85 1.78
Source: Bloomberg; NOVA Equity Research
In terms of EV/EBITDA and EV/EBIT EDP Renováveis is on the average comparing to its peers, what does not happen when analysing the other multiples that were selected. EDPR is clearly the company with the highest price to earnings ratio, which intuitively could be perceived as a bad signal, but if we look attentively to its strategy it is not. The company expects a strong growth of its cash flows and revenues in the near future, meaning that investors are already paying for that. In our opinion, as EDPR only distributed dividends for the first time in 2013, this high ratio means that investors expect an increase of earnings in the forthcoming trimesters, or else the price will have to fall.
EDPR is the company among its peers with the lowest P/B tangible ratio, which is an excellent indicator, meaning that it is the company that, theoretically, would leave its investors with the lowest losses if go bankrupt. EDPR is the company with most liquid book assets. Although EDPR presents the second lowest interest coverage ratio when comparing to the industry companies, it does not seem to be an aspect to worry as it is above 170 and cash flows are strong enough to pay its interest expenses.
Nevertheless, this target price corresponds to the base-case scenario and has to suffer the appropriate adjustment from the pessimistic-scenario, which accounts for 25% of the total valuation (annex 5). The premises of this later scenario were already presented and justified. The main differences come from Spain (increase of General Tax and no repowering), Rest of Europe (early stage operations with need of new capacity even after 2015), and from the U.S (no repowering, greatest Dollar-Euro devaluation and no income from institutional partnerships).
Table 17 - Target Price Target Price Probability
Base-case scenario 6.58 € 75%
Pessimistic-case scenario 1.43 € 25%
Overall Target Price 5.29 €
70 Value that the corporate finance literature uses as benchmark for the interest coverage ratio. A company should have a ratio
Markets and regulation
According to Enerdata71, the growth rhythm of primary energy production has
suffered a drop from the last 10-years average 2.4% to 2.1%, in 2012. 35% of the primary energy continued to be produced in the BRICs countries. Abeit the world’s energy consumption has grown in 2012, its pace has diminished and trend altered (chart 22). It has registered an average growth per year of 2.3% in the last decade72, contrasting to the slightly lower increase of 1.4% in 2012. In addition, China continues to be the region witth the highest growth rate (4%), although it had dropped 50% comparatively to the previous year. The main driver of consumption growth in 2012 were the BRIC countries, especially India and Brazil73.
Another interesting indicator is the energy intensity of GDP at constant purchasing power parities74, as it analysis the quantity of energy needed to generate one unit of GDP. This ratio has suffered a decrease of 1.6% in 2012, which is a higher decrease than the average of 1.2% registered since the beggining of the 21st century. Although North America’s energy intensity has droped more than 4% in 2012, it remains above the value in Europe, as it is still the region with the smallest energy intensity ratio (chart 23).
According to the International Energy Agency, the production of renewable energy is expected to increase at an average rate of 1.7% per year until 204075, whereas the growth of the wind-powered based electricity is expected to raise 2.6% per year for the same period, illustrating the greatest total growth in renewable production (chart 24).
By its turn, the Global Wind Energy Council forecasts that between 2013-2017 there will be a CAGR of 7.15% regarding wind installed capacity. Its absolute value in GW is expected to grow from 282,6 to 536,1, which represents a 90% increase (chart 25). Looking at the additions registered during 2012, nearly 60% of it happened in the 2 greatest markets – U.S and China. It is, however, very interesting that out of the total additions (44,8 GW), approximately 85% occured in the top 10 countries, which gives us a sense of how centralized the wind production is.
As stated by the Secretary General of the GWEC, “while China paused for breath, both the US and European markets had exceptionally strong years;
71“EnerData is a company that provides energy data, forecasts, market reports, research, news, consulting and training on the
global energy industry”
72 Source: EnerData
73 It is important to take into account that weather conditions directly influence energy consumption and that harsher winters are
positively correlated with energy consumption for instance. 74 Total energy consumption of country X / GDP
75 Annual Energy Outlook 2013 with Projection to 2040, from U.S. Energy Information Administration
Primary energy: Energy extracted from
nature that has not been altered, transformed or used before. It can correspond to renewable – fossil fuels and mineral fuels; or non-renewable sources – solar, wind, biomass, hydro, etc.
Chart 22: Electric power consumption U.S; Brazil and E.U (KW p/capita)
Source: World Bank; NOVA Equity Research
Chart 23: World’s Intensity Ratio
growth
Source: EnerData; NOVA Equity Research
Chart 24: Electricity generation by fuel (trillion kilowatt-hours per
year)
Source: U.S. Energy Information Administration; NOVA Equity Research
-6,0% -4,0% -2,0% 0,0% 2,0% 4,0% 6,0% 20500 21000 21500 22000 22500
2005 2006 2007 2008 2009 2010 2011
Energy Consumption Growth
0% -0,50% -1,10% -1,60% -2,0% -1,5% -1,0% -0,5% 0,0%
2009 2010 2011 2012
World 0 1 2 3 4 5 6
1990 2000 2020 2030 2040
History 2011 Projections
30% 16% 35% 17% 1% 25% 13% 19% 42% 1% Natural gas Renewables Nuclear Coal
Oil and other liquids
2010 1993 13% 11% 19% 53% 4% 0 1 2 3 4 5 6
1990 2000 2020 2030 2040
History 2011 Projections
30% 16% 35% 17% 1% 25% 13% 19% 42% 1% Natural gas Renewables Nuclear Coal
Oil and other liquids
Asia still led global markets, but with North America a close second, and Europe not far behind; European markets, led by Germany and the UK, with surprising contributions from ‘emerging markets’ in Sweden, Romania, Italy and Poland, accounted for 12.4 GW last year, a new record . However, on-going sovereign debt crises mean that the outlook for the 2013 market is uncertain, although Europe’s framework legislation and its 2020 targets ensure a degree of stability”76.
The increasing importance of green energy in the overall energy production and consumption is consequence of several factors, such as the need governments have to reduce CO2 emissions, increasing fossil fuel prices and more developed tecnhology. In line with this, governments are adopting schemes and incentives to encourage renewable energy production.
Each region puts in practice several action plans in order to see the emission of CO2 reduced (chart 26) and to guarantee increase usage of renewable energy. For that purpose, in 2002, the 15 Member States of the European Union agreed to jointly fullfill the Kyoto Protocol’s compliance mechanism (reduce the GHC emission in the 2008-2012 period to 8% below 1990 levels, at a first stage). Under the European Trading Scheme, companies can trade permits with each other and increase its reduction target for instance. Looking at the countries in which EDPR operates in, Spain had a score77 of -9%, Italy 1.7%, France 8.6%, UK 11%, Portugal
12.8%, Poland 29.2% and Romania 55.8%. So, the outcome is largely positive. Even the U.S. that has not embraced the protocol has met its goals. In 2012, the U.S. became the first major industrialized counrty in the world to meet the United Nation’s original Protocol 2012 target for CO2 reductions78.
In terms of electricity, the Spanish government is taking some actions in order to comply with the Kyoto target, such as79: provision of training programmes for installers (NSQPF80); Certification Programmes for RES
intallations; RD&D Policies; and Building obligations.
We believe that the targets proposed in the energy conferences81 will be met,
due to the fact that the technology required for producing renewable energy is less expensive and countries are aware of the penalizations they will suffer if they do not meet the targets. Even Spain, which is the country with the most complex situation (explained in the section below) has about 16%82
76 Source: Global Wind Energy Council: Solid Growth in 2012
77 If a country has a target to reduce its emissions by 5% and increases by 5%, then its score will be of -10% for instance 78 Source: EIA Data
79 According to Res-legal policies
80 National System of qualification and professional formation 81 E.U. Renewable Energy comittee for instance
82 Source: Association of Renewable Energy Producers Chart 25: Wind installed capacity
Source: GWEC
Chart 26: CO2 emission evolution