Sequential injection system for the spectrophotometric
determination of reducing sugars in wines
Alberto N. Arau´jo
a, Jose´ L.F.C. Lima
a, Anto´nio O.S.S. Rangel
b,* ,
Marcela A. Segundo
baCEQUP/Departamento de Quı´mica-Fı´sica, Faculdade de Farma´cia, R. Anı´bal Cunha164,4050Porto, Portugal bEscola Superior de Biotecnologia, Uni6ersidade Cato´lica Portuguesa, R. Dr. Anto´nio Bernardino de Almeida,4200Porto, Portugal
Received 23 July 1999; received in revised form 15 September 1999; accepted 16 September 1999
Abstract
A sequential injection system for the spectrophotometric determination of reducing sugars in wines is described. The methodology is based on the formation of a coloured complex produced by the reaction of copper (I) with 2,9-dimethyl-1,10-phenanthroline (neocuproine), after reduction of copper (II) to copper (I) by reducing sugars. In the present SI system, a dialysis unit was incorporated not only to allow the sample dilution, but also to minimise the interference of some coloured compounds. In this way, direct sample introduction into the system was possible, without any previous treatment of the wine samples. The proposed method can be applied to the determination of reducing sugars in two concentration ranges: from 2 to 25 g l− 1(table wines) and from 20 to 140 g l− 1(Port wines).
To perform determinations in these two ranges, the manifold configuration remained the same; just a few operational parameters were changed in the controlling software. A sampling-rate of 14 – 18 samples per hour was obtained with good repeatability for ten consecutive injections of wine samples (relative standard deviations (RSD) B2.1%). The results obtained from 19 wine samples were comparable to those obtained by the reference method. © 2000 Elsevier Science B.V. All rights reserved.
Keywords:Sequential injection; Reducing sugars; Wine; Dialysis unit; Spectrophotometry
www.elsevier.com/locate/talanta
1. Introduction
The determination of reducing sugars is fre-quently performed in the wine industry. It is an important parameter to control during wine pro-duction to follow the fermentation process. Re-ducing sugars determination in wines is also made
for routine quality control and for checking if the wine meets the legal or commercial reducing sug-ars content required for a certain wine type [1].
As the reference method [2] for this determina-tion is a time consuming redox titradetermina-tion, efforts have been made for implementing automatic methods to carry out this analysis, namely by resorting to equipment based on segmented flow analysis and HPLC [1] or flow injection analysis [3 – 6].
* Corresponding author. Fax: + 351-22-5090351. E-mail address:rangel@esb.ucp.pt (A.O.S.S. Rangel)
0039-9140/00/$ - see front matter © 2000 Elsevier Science B.V. All rights reserved. PII: S 0 0 3 9 - 9 1 4 0 ( 9 9 ) 0 0 3 3 8 - 0
Although flow injection systems represent an attractive alternative for automating this determi-nation, the manifolds previously proposed have some drawbacks. In the systems described by Valcarcel et al. [3], the wine coloured compounds had to be removed from the sample before mea-surement by filtration with charcoal. Maquieira et al. [4] managed to solve this problem by using a dialysis unit, which separated the analyte from the wine matrix. Nevertheless, this system was not suitable for wines with a high sugar content, demanding sample dilution prior to its introduc-tion into the system. This difficulty was overcome by Rangel et al. [5]; by using different sample injection volumes, it was possible to carry out determinations between 1 and 200 g l− 1.
How-ever, this implied a manifold change, according to the concentration range aimed. Precisely this type of difficulty can be overcome by using the recently described sequential injection (SI) technique. In fact, the main advantages pointed to SI when compared to FIA are the possibility of performing different analysis without system reconfiguration [7,8] and the considerable reagents saving, since a continuous consumption is not involved in SI systems [9,10]. In its simplest configuration, SI analysis consists in the sequential aspiration of a well defined sample and reagent zones into a holding coil by means of a multi-position valve. The flow is then reversed and the stacked zones are mixed and directed to the detector.
In the present work, the main objective was to devise an automatic system for determining reduc-ing sugars in wines usreduc-ing the sequential injection analysis technique. It was also aimed to obtain a wide concentration working range, making the system suitable for performing determinations in Port and table wines. The sample introduction into the system without prior handling was an-other concern during the system development.
For accomplishing these objectives, the SIA methodology chosen was based on the Cu(II)-neocuproine reaction, the formed coloured com-pound being measured at 460 nm [11]. To obtain a system with a variable dilution capacity, the joint effect of using different sample volumes and a dialysis unit was used. The use of dialysis unit in SI systems was firstly suggested in 1993 [12]. It
has been successfully used by van Staden [13], allowing the determination of iron (III) in phar-maceutical samples, which are usually turbid and contain undissolved organic particles. Arau´jo et al. [14] also used a dialysis unit to provide in-line dilution and interference minimisation of the sam-ple matrix to perform the L( + )-lactate spec-trophotometric determination in wines using a SIA system. In the work here presented, a dialysis unit is used not only to dilute the wine sample, but also to prevent some coloured compounds from reaching the detection system, especially in the case of red wines. In this way, the direct sample introduction into the system is possible, without any previous treatment required for colour elimination.
2. Experimental
2.1. Reagents and solutions
All chemicals used were of analytical-reagent grade with no further purification, and deionized water with a specific conductance less than 0.1mS cm− 1was used throughout. In order to minimise
bubble formation inside the flow system, the solu-tions used in the sequential injection manifold were prepared with previously boiled water.
To prepare the colour reagent, a 1 ml volume of ethanol containing 0.0150 g of neocuproine (2,9-dimethyl-1,10-phenanthroline) was added to an aqueous solution containing 0.0075 g of cop-per(II) sulphate pentahydrate and the mixture was diluted to 25 ml with deionized water.
The carrier solution was sodium hydroxide 0.075 mol l− 1, prepared daily by an appropriate
dilution from a 1 mol l− 1 stock solution. The
NaOH stock solution was prepared weekly by dissolving 10 g of sodium hydroxide pellets in 250 ml of deionized water.
The reducing sugar standards consisted of a mixture of fructose (60%) and glucose (40%). In the determination of Port wines, each standards was prepared by weighing the stated sugars, fol-lowed by dissolution in a 20% v/v ethanol solu-tion. In the determination of table wines, the stock solution was prepared from 1.875 g of
fruc-tose and 1.250 g of glucose dissolved in a potas-sium hydrogen phthalate – hydrochloric acid buffer (pH 3.4). The standards were obtained by appropriate dilution of the stock solution in the buffer, and ethanol was also added to achieve a 10% v/v concentration.
The potassium hydrogen phthalate – hydrochlo-ric acid buffer was prepared by adding 50 ml of a 20.42 g l− 1 potassium hydrogen phthalate
solu-tion to 10 ml of 0.100 mol l− 1 hydrochloric acid
solution and making the volume up to 100 ml. A 0.8 mol l− 1sulphuric acid solution was used
as washing solution. 2.2. Apparatus
The schematic representation of the sequential injection system for reducing sugars determina-tion in wines is depicted in Fig. 1.
The solutions were propelled by a Gilson Minipuls 3 peristaltic pump with a PVC pumping tube. This tube was connected to the central channel of an eight port electrically actuated se-lection valve (Valco VICI C15-3118E).
A Unicam 8625 UV-visible spectrophotometer equipped with a Helma 178.711QS flow-through cell (internal volume 30ml) was used as detection system and the wavelength was set at 460 nm. The analytical signals were recorded in a Kipp and Zonen BD 111 strip chart recorder.
The dialysis unit [5] consisted of two perspex blocks that were pressed against each other by four screws. The dialysis membrane, obtained
from Visking tubing (Medicell International Ltd.), was placed between the two blocks, separating two matching cavities (2 mm wide, 0.5 mm deep and 37 mm long), drilled in each block. The membrane was replaced weekly; it was soaked in carrier solution for 2 h before using.
All tubing connecting the different components of the SI system were made of Omnifit PTFE with 0.8 mm (i.d.).
To improve the sensitivity, the reaction coil was placed inside an I.S.Co GTR190 thermostatic bath.
A 386 personal computer (Samsung SD700) equipped with an Advantec PCL818L interface card, running a homemade software written in QuickBasic 4.5, controlled the selection valve po-sition and both the pump rotation sense and speed.
2.3. Procedure
The protocol of flow and timing sequence re-quired for the determination of reducing sugars in wines is listed in Table 1; different conditions were used for table or Port wines.
The analytical cycle can be divided in three parts: the sample treatment, the colorimetric mea-surement and the system washing. The sample treatment started with the sample (or standard) aspiration into the holding coil (HC). Then, the flow was reversed and the sample was propelled to the donor channel of the dialysis unit towards the waste, occurring the reducing sugar passage across the membrane. Next, the content of the HC was flushed with carrier to the waste in order to eliminate any sample remain.
To accomplish the colorimetric measurement, the colour reagent and the dialysed analyte were sequentially aspirated into the HC. The flow was again reversed and the HC content was trans-ferred to the reaction coil (RC), placed in a thermostatic bath. After the HC washing and a certain residence time, the reaction product formed in the RC was aspirated into the HC. Then, the flow was reversed and the reaction product was dispensed to the spectrophotometer. After the colorimetric measurement, the wine and reducing sugar remains must be removed Fig. 1. SIA manifold for the determination of reducing sugars
in wines. SV, selection valve; P, peristaltic pump; HC, holding coil (l = 100 cm); D, detection system (lconnection= 60 cm); DU,
dialysis unit system (lconnections= 20 cm); RC, reaction coil
(l = 70 cm); TB, thermostatic bath; C, carrier; S, sample or standard; CR, colour reagent; A, acid solution; W, waste.
Table 1
Sequential injection protocol sequence for the determination of reducing sugars in wines Operation time Flow rate (ml
Valve position Volume (ml) Description
Step
(s) min−1)
12
a 7 0.6/1.7a 120/340a Aspirate sample or reagent
b 8 12.5/30a 3.3/2.2a 688/1100a Dispense sample mixed with carrier, allowing
reducing sugar passage through the mem-brane
15
c 1 4.8 1200 Flush holding coil to remove sample remains
4.5 1.2
2 90
d Aspirate colour reagent
3
e 7.5 1.2 150 Aspirate dialysed containing reducing sugars
9 2.2 330
f 5 Dispense holding coil content to heated
reac-tion coil
15 4.8
g 1 1200 Flush holding coil
h 5 0/15a – – Stop period for colour development
7/14a
2.2/1.2a
257/280a Aspirate reaction product formed
i 5
45 2.2
6 1650
j Propel to detector, signal registration
8
k 15 4.4 1100 Dispense carrier to wash dialysis donor
chan-nel
6 4.4 440 Aspirate carrier to wash dialysis acceptor 3 l channel 1 4.4 m 4 73 Aspirate acid 20
n 5 4.8 1600 Dispense acid mixed with carrier to rinse
re-action coil
aParameters with different values for Port and table wines, respectively.
from the dialysis unit and the RC must be flushed to remove the reaction product remain and filled with carrier. The system washing began by dis-pensing carrier through the dialysis donor channel and by aspirating carrier to the HC through the dialysis acceptor channel. After that, a small vol-ume of acid was aspirated to the HC; by flow reversal, its content was dispensed through the RC, eliminating the remains from the dialysis acceptor channel and washing the RC at the same time.
2.4. Reference method
In order to assess the quality of the results obtained in the reducing sugar determination by sequential injection, they were compared with those obtained by a reference method [2]. The wines were previously treated either with lead acetate and calcium carbonate (red wines) or with potassium hexacyanoferrate(II) and zinc sulphate (white wines) and filtered. A cupric-alkaline solu-tion was added to the filtrate, and refluxed for 10
min. After cooling, an excess of potassium iodide was added and the solution titrated with sodium thiosulphate, using starch for indicating the titra-tion end-point.
3. Results and discussion
3.1. De6elopment of the SI system for the determination in Port wines
Sodium hydroxide was used as carrier solution. As the colour reaction took place under alkaline conditions, the use of this solution as carrier avoided an operation step to introduce the hy-droxide in the mixture between dialysed sample and colour reagent. The sodium hydroxide con-centration was varied between 0.050 and 0.100 mol l− 1. Its value was set to 0.075 mol l− 1 as its
influence in the calibration curve was not noticed. The concentration of the copper(II)-neocuproine solution was studied between 0.4 and 0.8 g l− 1in neocuproine and between 0.2 and 0.4
g l− 1 CuSO
4· 5H2O, keeping the concentration
ratio as 2:1. The concentration was set to 0.6 g l− 1 in neocuproine and 0.3 g l− 1 CuSO
4· 5H2O.
Higher concentrations gave rise to high blank signals and lower concentrations originated poor sensitivity.
The manifold parameters were selected to allow the direct injection of wine samples with no previ-ous treatment. A previprevi-ous study [5] indicated that calibration plots established with pure fructose standards presented a sensitivity 2.5 times larger than those with pure glucose. The sugar standards were composed of a mixture of fructose (60%) and glucose (40%) as it is the usual relative sugar percentage found in wine [6]. Additionally, the alcohol content also influenced the peak height. In this way, sugar standards were prepared with an ethanol concentration of 20% by volume, except for table wine determinations. For these wines, the ethanol content is lower, so the concentration in the sugar standards was 10% by volume.
Using the manifold depicted in Fig. 1, optimisa-tion procedures were carried out by studying the influence of some parameters on the calibration curve or on the analytical signal, maintaining the others to a pre-set value.
The sample volume chosen was 120 ml. This was a compromise between two factors: re-peatability and membrane fouling. Lower vol-umes decreased repeatability and higher values increased the time required for rinsing the membrane.
Previous FIA studies [4,5] indicated that the reduction of sugars requires drastic conditions for sufficiently fast development; therefore a thermo-static bath at a suitable temperature was incorpo-rated in the manifold. In the first approach, the holding coil was immersed in the bath; in this way, the mixture of dialysed reducing sugar and colour reagent was heated after sequential aspira-tion; by inverting the flow, the reaction product was propelled to the detector. However, bubble formation was inevitable. Therefore, the HC was removed from the bath and an open reaction coil was connected to the selection valve and partially immersed in the thermostatic bath. This configu-ration allowed any bubble formed to be expelled during step f and n (Table 1), when the carrier
was propelled through the reaction coil. More-over, the reaction coil content was withdrawn during reaction product aspiration (Table 1, step i), remaining empty during part of the analytical cycle. These two features avoided bubble forma-tion and also prevented those occasionally formed from reaching the detection system.
The chosen temperature was 80°C, which pro-vided enough sensitivity. Higher temperatures were not used because the signals obtained were too high for the concentration range aimed.
The reagent volume was varied between 60 and 120 ml and established to 90 ml. Volumes lower than 90ml originated poor sensitivity and lowered the repeatability; higher volumes increased the blank signal.
Since this type of wines presented high sugar contents, it would be necessary to have a low efficiency in the dialysis process. In order to achieve this, the sample passage through the donor channel was as fast as possible. The flow rate chosen was 3.3 ml min− 1 and the passage
time was 12.5 s, ensuring that the sample plug passed over the dialysis membrane.
To establish the volume aspirated from the dialysis acceptor channel, the volume of carrier solution present in the connection between the selection valve and this channel was considered. So, the volume and the flow rate were chosen in order to ensure the total recovery from the accep-tor carrier placed under the membrane. In this way, the volume chosen is 150 ml and the chosen aspiration flow rate was 1.2 ml min− 1.
With the dialysed and reagent volumes estab-lishment, the reaction coil length was studied. The total length could be divided in three different zones: 18 cm connecting the selection valve and the immersed reaction coil zone, 45 cm immersed in the thermostatic bath and 7 cm outside it, directed to the waste. Preliminary studies indi-cated that a longer immersed part increased bub-ble formation, as the residence time is longer. In this way, the length was adjusted to ensure that all the holding coil zone containing the reducing sugar dialysed plus the colour reagent passed in the immersed reaction coil part, but keeping it as short as possible at the same time. Lengths be-tween 20 and 60 cm for the immersed part were tried, being 45 cm the chosen length.
The reaction coil length conditioned the rated reaction product volume. So, volume aspi-rated was optimised in order to have the highest signal without air introduction into the holding coil. The volume was 257ml; for higher volumes, the sensitivity was increased, but bubble introduc-tion occurred sometimes.
After aspiration to the holding coil, the reaction product was propelled to the detector. Both flow rate and connection length between the selection valve and the flow cell were studied. The chosen flow rate was 2.2 ml min− 1. For higher flow rates,
the signal repeatability was decreased; for lower flow rates, the time required to finish this step was increased and the sensitivity was reduced. The connection length was also studied, being varied between 40 and 100 cm. The length chosen was 60 cm, for the same reasons stated for the chosen flow rate.
After signal registration, the dialysis channels must be washed. The time required for each step was kept as low as possible and the chosen flow rate was as high as possible. During preliminary studies, it was observed that when the tempera-ture used was higher or the sodium hydroxide concentration in the carrier was raised, a black precipitate was formed in the reaction coil and stuck to the wall. This affects the determination repeatability and sensitivity. To remove this pre-cipitate, the holding coil was rinsed with an acid solution.
3.2. Adaptation of the SI system for the determination in table wines
Sequential injection systems, when compared to flow injection systems, show more flexibility, due to the possibility of changing analytical parame-ters without manifold reconfiguration. Taking ad-vantage of this fact, the previously described system was adapted to perform the determination in wines with low reducing sugars content (2 – 25 g l− 1). The first step was to increase the sample
volume and, consequently, the volume that passed in the dialysis donor channel was also increased. Knowing that slow flow rates for the donor stream results in longer dialysis time as well as increases dialysis efficiency [13], a lower flow rate
was also used in this step. However, these modifi-cations were not enough to accomplish the deter-mination in the expected concentration range.
The reducing sugars determination on the range aimed was achieved by increasing the residence time of the colour reagent and reducing sugars dialysed mixture in the reaction coil. This was possible by adding a stop period between step g and i, during which the peristaltic pump is turned off. Moreover, the flow rate and the operation time in step i were changed, being the first low-ered and the second increased.
Nevertheless, when wine samples were analysed, the results obtained had a positive devi-ation when compared with those obtained by the reference method. This could be due to an influ-ence of pH in the reducing sugars passage through the membrane. To solve this problem, the pH of the sugar standards was adjusted to 3.4 (value usually found in table wines [1]), using the buffer solution hydrochloric acid – potassium hy-drogen phthalate.
3.3. Application to wine analysis
The proposed SI system allowed the determina-tion of reducing sugars in wines in two different concentration ranges, depending on the parame-ters introduced in the controlling software. Two second order calibration curves were established for table wines and Port wine concentration ranges. The standards concentration varied be-tween 2 and 25 g l− 1 and between 20 and 140 g
l− 1, respectively.
The SI system was applied to the determination of reducing sugars in ten Port wines and nine table wines, including the Portuguese Vinhos Verdes. The results (Cs) were compared with those
furnished by the reference method (Cr); they are
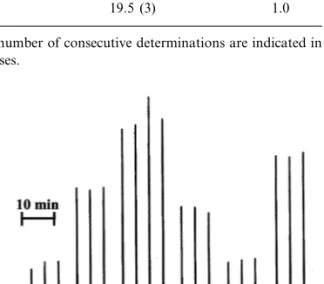
presented in the Table 2. A recorder output corre-sponding to the injection of a set of standards and three table wine samples is presented in Fig. 2.
For comparison purposes, a linear relationship (Cs= C0+ SCr) was established. The equation
parameters, as well as the 95% confidence limits, are presented in Table 3.
From these figures it is clear that the estimated slope and intercept do not differ significantly from
the values 1 and 0, respectively. Thus, there is no evidence for systematic differences between the two set of results [15] obtained by SIA and the reference method, even when the two concentra-tion ranges used are considered separately.
The precision of the SIA methods was esti-mated by calculating the relative standard devia-tion from ten consecutive injecdevia-tions of four wine samples with different reducing sugars concentra-tions. Relative standard deviations were lower than 1.7% for Port wines and lower than 2.1% for table wines.
The detection limit was calculated as the con-centration corresponding to the blank signal plus three times the standard deviation of ten consecu-tive blank injections. The blank signal was ob-tained by injecting solutions with the same composition as the standards, except for the re-ducing sugars. For table wines, the calculated detection limit was 1.2 g l− 1; for Port wines, the
calculated detection limit was 11.2 g l− 1.
The sample frequency was different for each concentration range. The time required for a com-plete analytical cycle is not merely the summation of the time required for each step performance. The time required for the proper port selection in the selection valve must also be accounted. Con-sidering this, the time required to complete an analytical cycle was 192 s for Port wines and 246 s for table wines. The sample frequency was 18 and 14 determinations per hour, respectively.
4. Conclusion
In the present work, a SIA system to perform reducing sugars determination in wines in a wide concentration range was developed. This was achieved using the same manifold configuration, just by changing a few operational parameters in the controlling software. This feature confirms the versatility attributed to SI when compared to FI systems.
The use of dialysis unit was effective in achiev-ing the large dilution required for determinations in Port wines. Additionally, it minimised the wine colour interference, avoiding sample treatment with decolourisation agents. Therefore, the sam-ple could be directly introduced into the system. Table 2
Comparison between the results obtained by SIA and by the reference method (OIV); relative deviation (RD) between the two methods RD (%) Concentration (g l−1)a SIA OIV 99.3 (3) 95.8 (2) −3.5 105 (8) 1.9 107 (10) 56.0 (3) 59.4 (10) 6.1 0.0 111 (3) 111 (4) 123 (4) 120 (3) −2.4 107 (4) 111 (5) 3.7 105 (4) 106 (3) −0.9 122 (4) 123 (5) −0.8 97.2 (4) 102 (3) −4.7 −1.4 101 (3) 99.6 (3) 12.1 (4) 12.2 (2) −0.8 24.7 (3) 23.6 (10) −4.5 −2.1 6.20 (4) 6.07 (4) 17.2 (3) 16.9 (3) −1.7 13.8 (4) 13.8 (3) 0.0 4.05 (4) 3.96 (3) −2.2 14.0 (5) 13.9 (3) 0.7 7.4 13.0 (3) 12.1 (3) 19.5 (3) 1.0 19.7 (7)
aThe number of consecutive determinations are indicated in
parentheses.
Fig. 2. Sequential injection register for a set of standards (2.0, 7.5, 15 and 25 g l− 1) and table wine samples.
Table 3
Parameters of the equation Cs= C0+SCrfor comparing the results (g l
−1) obtained by SIA (C
s) and by the reference method (Cr),
and the values for relative standard deviation corresponding to ten consecutive determinations
RSDa (%)
Equation parameters S
C0 Rb
0.936
Port wine range 6.111 0.990 1.3 (107)
(90.117)c
(912.253)c 1.7 (59.4)
Table wine range 0.430 0.965 0.997 2.1 (23.6)
(90.992)c (90.066)c 1.3 (6.20)
0.990
Both ranges 0.299 0.9991
(90.022)c
(91.683)c
aRelative standard deviation measured with four different wines, with the respective concentration (g l−1) between parentheses. bCorrelation coefficient.
cThe values in parentheses are the limits of the 95% confidence intervals.
These features point out the potential applicabil-ity of the developed methodology as a screening technique, namely for monitoring fermentation processes.
Acknowledgements
One of the authors (M.A. Segundo) thanks FCT for the grant PRAXIS XXI BD/13648/97. Support from PRAXIS XXI/Ageˆncia de Inovac¸a˜o through Project P076-P31B-09/97-INSIA and col-laboration from the firm Cockburn Smithes (Gaia Portugal) are also acknowledged.
References
[1] M.A. Amerine, C.S. Ough, Methods for Analysis of Musts and Wines, Wiley, New York, 1980.
[2] Office International de la Vigne et du Vin (OIV), Recueil des Me´thodes Internationales d’Analyse des Vins et des Mouˆts, OIV, 1990.
[3] A. Maquieira, M.D. Luque de Castro, M. Valcarcel, Analyst 112 (1987) 1569 – 1572.
[4] M. Peris-Tortajada, R. Puchades, A. Maquieira, Food Chem. 43 (1992) 65 – 69.
[5] J.L.F.C. Lima, O.B.A.O. Neves, A.O.S.S. Rangel, Flow injection determination of reducing sugar in wine in a wide concentration range using a dialysis unit and a stream splitting, in: J.J. Bimbenet, E. Dumoulin, G. Trys-tram (Eds.), Automatic Control of Food and Biological Processes, Elsevier, 1994, pp. 67 – 74.
[6] T.I.M.S. Lopes, A.O.S.S. Rangel, J.L.F.C. Lima, M.C.B.S.M. Montenegro, Anal. Chim. Acta 308 (1995) 122 – 128.
[7] J. Ruzicka, G.D. Marshall, Anal. Chim. Acta 237 (1990) 329 – 343.
[8] A. Mun˜oz, F.M. Torres, J.M. Estela, V. Cerda, Anal. Chim. Acta 350 (1997) 21 – 29.
[9] R.W. Min, J. Nielsen, J. Villadsen, Anal. Chim. Acta 312 (1995) 149 – 156.
[10] R.W. Min, J. Nielsen, J. Villadsen, Anal. Chim. Acta 320 (1996) 199 – 205.
[11] D. Bureau, A.W. MacGregor, Lebensm. Wiss. Technol. 14 (1980) 92 – 95.
[12] A. Ivaska, J. Ruzicka, Analyst 118 (1993) 885 – 889. [13] J.F. van Staden, H. du Plessis, R.E. Taljaard, Anal.
Chim. Acta 357 (1997) 141 – 149.
[14] A.N. Arau´jo, J.L.F.C. Lima, M.L.M.F.S. Saraiva, E.A.G. Zagatto, Am. J. Enol. Vitic. 48 (4) (1997) 428 – 432.
[15] J.C. Miller, J.N. Miller, Statistics for Analytical Chem-istry, 3rd edn, Ellis Horwood, New York, 1993.