The Preservation of Frozen Food Quality and
Safety Throughout the Distribution Chain
Leeds Meeting 26 - 27 September 1997
Temperature Abuses on Frozen Orange and Orange/Melon
Juices: Influence on Quality
A. F. Molinari and C. L. M. Silva
The objective of this work was to study the influence of temperature abuses during frozen storage on frozen orange and mixed orange/melon juices quality.
Samples of fresh orange 'Valencia' and orange/melon 'Cantaloupe juices (ratio 1:1) were frozen and stored at -20°C during 120 days. Part of the samples (test) suffered different kinds of temperature abuses during frozen storage. Three types of temperature abuses were carried out. At predetermined intervals, samples were transferred to room temperature or to a refrigerator cabinet, during a specified time and returned to the frozen storage room. The other part (control) of samples remained in the freezer until final analysis. To compare the quality of test and control samples a final evaluation was then carried out. A sensory evaluation was done using the paired comparison method, where the panelist indicated which samples he/she preferred. Other parameters were also analyzed: pectinesterase (PE) activity, pH, °Brix, acidity, Brix/acid ratio, color, total and reducing sugars and turbidity. The sensory analysis revealed that there was significant difference between test and control samples of melon/orange juice, within 95% confidence. For the orange juice samples more than half of the panelists confirmed the difference between the samples, however the result was not significant
This work is a part of the collaborative project coordinated by Dr Leif Begh-Sorensen.
Introduction
Freezing is one of the most important methods to preserve agricultural products. Nowadays, frozen foods have a prominent place. The most common frozen storage temperature is -18°C. However, at this temperature there is still deterioration because foods are not completely frozen. Hence, physical processes and chemical reactions can' degrade the stored material (Fennema 1995; Goff 1992). The quality of frozen foods and its shelf life prediction is very important. Storage time is a restrictive factor for frozen foods. This operation is responsible for more damage than freezing or thawing processes. The rate of deterioration depends on temperature. Therefore, it is imperative to control effectively the temperature throughout the storage life of the product (Arthey
1993; Fennema
et al.
1973; Lyonet al.
1988).Arthey (1993) indicated that the two more important critical points during frozen storage are the temperature of the stored product and the temperature fluctuations. Temperature fluctuations result on product quality losses. Poor cold room temperature control, where temperature fluctuations of ±5°C can be observed, can be more quality detrimental than stable-temperature (±1°C) conditions (Fennema
a al.
1973; Kramer1979).
Sensory quality is usually more affected than nutrient retention Kramer (1979). According to Jansen (1969), an inadequate frozen storage of orange juice concentrate is less detrimental for its nutrients (e.g. vitamin C) than for other qualities, such as flavor. Physical changes of ice crystals, recrystallization, can occur due to fluctuating temperatures Loss in quality can be a result of growing size of ice crystals (Fennema 1973; Goff 1992; Reid 1993). Recrystallization can be controlled by storing products at a constant low temperature and for a minimal time (Goff 1992). It is very difficult to avoid completely the variability of the temperature, mainly along the frozen food distribution chain. The time that product is out of the cold store (e.g. the time spent to transfer it to the retail cabinets) and retail cabinets are important sources of temperature abuses.
The objective of this work was to investigate the effects of temperature abuses, which can occur in the cold chain, on juice quality.
Materials and Methods
Materials
Portuguese melon 'Cantaloupe' (Cucumismelo) and orange 'Valencia Late' (Citrus
sinensis L.) were bought in the local market. The orange was squeezed by hand and the
melon pulp was smashed with a blender. To prepare the orange/melon juice, equal mass quantities of each fruit were mixed. The juices were frozen in individual polyethylene bags (0,5 1) with rectangular shapes (3 cm x 9 cm x 19 cm). The samples were frozen in a blast freezer (Annfield FT-36) at -25°C and stored at -20°C (± 1°C). The control and test samples were kept in insulated boxes separately, but in the same freezer. After 56 days of frozen storage the temperature abuses started to be carried out
Methods
Temperature abuses
Table 1 shows the different kinds of temperature abuses made along time and storage. Table 2 presents the time schedule used for temperature abuses. Before freezing a thermocouple was placed at the center of one orange juice and another in orange/melon juice samples. A Datalogger (Delta - T Devices Burwell - Cambridge - UK) was used for the temperature acquisitions during the temperature abuses. The freezer and room temperatures were also monitored.
Table 1. Types of temperature abuses carried out during frozen storage.
Temperature Abuses Description
Abuse A The test samples were placed at room temperature for 60 min. After that, the samples returned to the insulated box with the lid on.
Abuse B The test samples were placed in a refrigerator at approximately 5°C for 60 min. After that, the samples returned to the insulated box with the lid off for 23 hours.
Abuse C The test samples were placed at room temperature for 2 hours. After the samples returned to the insulated box with lid off for three days.
Sensory evaluation
To compare the quality of test and control samples a sensory evaluation was carried out two weeks after the last temperature abuse. Trained panelists were used in this study. The test was carried out in portable panel booths. The paired comparison method was used. The samples were quickly thawed in a water bath at 60°C. The panelists received 20 ml of test and control samples from each juice. The samples were presented in 30 ml plastic souffle cups at 13°C. Each panelist evaluated the flavor of the samples and chosen the preferred one. The data were statistically analyzed using Chi-square analysis.
Pectinesterase assay
For PE analysis, the method described by Koner et al. (1980) was used. Basically, the method consisted of a titrimetric measurement of the rate of carboxyl group •liberation from a 1% pectin (Unipectin Up Slow Set 150), 0.15 M NaCI solution at pH 7.0 and
controlled constant temperature. The activity was expressed in PEU which corresponds to the miliequivalents of add liberated per min per ml at pH 7.0 and specified temperature. The test temperatures used to determine residual activity were 30°C and 55°C. Some modifications, suggested by Amstalden and Montgomery (1994) were introduced. A 20 ml of juice sample was added to 40 ml, of pectin solution (previously heated up) with constant stirring and quickly adjusted to pH 7.0 with 0.1 M NaOH. When the pH 7.0 was reached the stopwatch was put in 'action simultaneously with the addition of 1 ml of 0.05 N NaOH. The stopwatch was stopped when the pH was back to 7.0. A constant temperature was maintained during the titration. PE activity was calculated by the equation:
(1m1 NaOH * N of NaOH * 10 4 ) PEUx104
(1) (time (min)) * (ml of sample)
where PEU is the unit of pectinesterase/ml of sample.
In order to take into account the effect of pectin degradation by the alkali which causes a pH decrease, an analysis was made with the pectin solution heated with distilled water instead of juice. The value determined was subtracted from the PE activity calculated by the equation (1). The accuracy of the method was ± 0.7 PEUx104/ml.
Color, acidity, Brix, and pH measurements
The color parameters were measured using a portable tristimulus colorimeter (Minolta Chroma Meter CR-300). The sample was placed in a glass Petri dish and the measurements were taken in triplicate. The Hunter L, a, b tristimulus scale was used to characterize the Total Color Difference (TCD). The TCD is determined using the equation:
TCD = [0_0442±(acra) 2+(30-b) 2T-2
(2) where the subscript "o" refers to the value for the control sample.
Acidity was determined by titration with NaOH and expressed as citric acid. Brix degree was measured with hand refractometer (Atago) at 20°C. The pH of orange juice was measured using a digital pH meter (Crison model 2002), previously calibrated.
•
Total and reducing sugars determination
Experimental quantification of the total and reducing sugars as a function of cuprous oxide was made by a volumetric method in agreement to the Luff-Schoorl technic (Norma Portuguesa 1987).
Turbidity determination
The measurements in orange juice samples were done directly. The melon/orange juice was diluted in water, before determination in a spectrophotometer (Shiinadzu UV-1601, Japan). The turbidity was read from the absorbance at 660 nm.
Results and Discussion
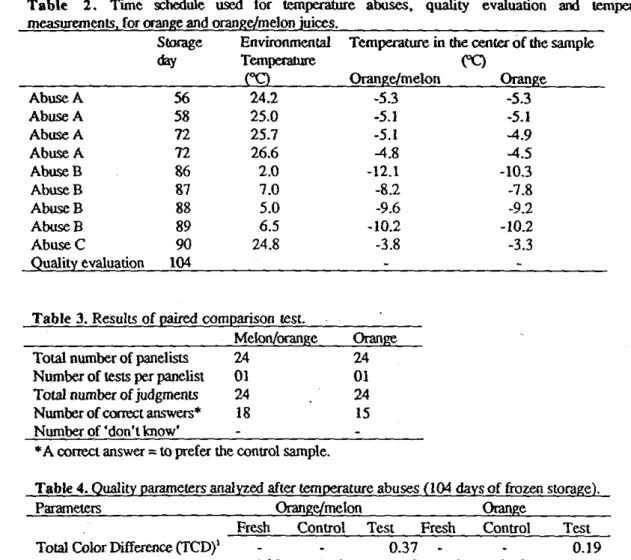
Table 2 presents the time schedule for the temperature abuses together with environmental temperature and the temperature at the center of the samples at the end of each temperature abuse.
CM-square analysis, to the sensory evaluation results, revealed that there was significant difference between test and control samples of orange/melon juice, within 95% confidence. Tice same behavior was not observed for the orange juice. However, more than half of the panelists confirmed the difference between test and control samples (Table 3). Tice dilution observed in the test samples was the attribute more easily recognizable in both juices. Probably, the recrystallization process caused alterations in texture. Thus, it modified the taste of the juices, mainly orange/melon. The viscosity of this juice was higher than the orange juice.
Table 2. Time schedule used for temperature abuses, quality evaluation and temperature measurements, for orange and orange/melon juices.
Storage day
Environmental Temperature
(°C)
Temperature in the center of the sample CC) Orange/melon Orange Abuse A 56 24.2 -53 -5.3 Abuse A 58 25.0 -5.1 -5.1 Abuse A 72 25.7 -5.1 -4.9 Abuse A 72 26.6 -4.8 -4.5 Abuse B 86 2.0 -12.1 -103 Abuse B 87 7.0 -82 -7.8 Abuse B 88 5.0 -9.6 -9.2 Abuse B 89 6.5 -10.2 -10.2 Abuse C 90 24.8 -3.8 -3.3 Quality evaluation 104
Table 3. Results of paired comparison test.
Melon/orange Orange Total number of panelists 24 24 Number of tests per panelist 01 01 Total number of judgments 24 24 Number of correct answers* 18 15 Number of 'don't know'
-• A correct answer = to prefer the control sample.
Table 4. Quality parameters analyzed after temperature abuses (104 days of frozen storage).
Parameters Orange/melon Orange
Fresh Control Test Fresh Control Test
Total Color Difference (TCD)' 0.37 - 0.19
pH 4.00 4.00 3.99 3.59 3.58 3.56 °Brix 10.2 9.6 9.0 10.4 9.4 9.2 Acidity (%)2 0.7 0.6 0.7 0.8 0.7 0.8 Brix/acid 14.57 13.7 12.9 13.0 13.4 11.5 Pectinesterase activity 30°C 14.74 12.2 13.3 20.86 14.3 15.6 (PEUx104/m1) 55°C 25.37 20.9 24.0 25.12 18.7 19.7 Total sugar (%) 9 5 9 11 8 9 Reducing sugar (%) 5 3 7 5 3 4 Turbidity (NTU) 1070 176 116 1190 161 138
'calculated between test and control samples 2g of citric acid
The results obtained for physical and chemical parameters are showed in Table 4 The TCD and pH values for both juices were not significantly different between test and control samples. The variations observed for °Brix and titratable acidity are more easily verified in terms of Brix/acid values. In both juices there was a significant decrease in this value. This results confirms that a dilution or a loss of viscosity of the juices
occurred. The panelists commented that the taste of the test samples was not so strong like the control ones.
During frozen storage some PE inactivation occurred. Several factors can contribute to this, for example pH can cause protein denaturation (Bella and Grosch
1987). Solute concentration of the unfrozen medium increases during freezing and causes changes in pH, viscosity, ionic strength and other properties (Belitz and Grosch 1987; deMan 1990; Reid 1990). Therefore, the PE enzyme inactivation can be caused by the low a pH value in the unfrozen medium of frozen juice.
Test samples presented a higher enzyme activity than control ones. Probably recrystallization, that occurred due to temperature abuses, disrupted more cells liberating more enzyme. Pectin is deesterificate by PE and results in pectinic acids and methanol. These components are insoluble (Jansen 1969). Thus, the greatest PE activity in test samples can be responsible by its decrease in Brix degree. The enzyme activity can influence the turbidity. It is known that PE destabilize the cloud citrus juices (Amstalden and Montgomery 1994; Marshall et at 1985; Versteeg
a
at 1980). Theresidual PE activity measured can be able to break chains of pectin reducing the juice turbidity
References
Arthey, D. (1993). Freezing of vegetables and fruits In- Frozen Food Technology. (Ed. C. P. Milieu). Chapman & Hall, 237-269
Amstalden, L. C. and Montgomery, M. W. (1994). Pectinesterase em suco de laranjw. oracterizacao. Cienc. Tecnol. Aliment, 14(1):37-45
Belitz, RD. and Grosch, W. (1987). Food Chemistry. Spring-Verlag, Germany
deMan, J.M. (1990). Principles of Food Chemistry. 2nd ed. Van Nostrand Reinhold, USA
Fennema, O.R., Powrie, W.D. and Mardi, E.H. (1973). Low-temperature Preservation of Foods alci Living Matter. Marcel Dekker, Inc., New York
Fennema, 0. (1995). Future challenges and opportunities for the frozen food industry. In: 2nd European Congress on Food Freezing. The University of York, 6 and 7 April 1995, 1-14.
Jansen, E.F. (1969). Quality-related chemical and physical changes in frozen foods. In: Quality ad Stability of Frozen Foods. (Ed. W B. van Arsdel; MJ. Copley; R.L. Olson) Wiley-Interscience,
19-42
Lyon, D.H., McEwan, J.A., Taylor, J.M. and Reynolds, M.A. (1988). Sensory quality of frozen Brussels sprouts in a time-temperature tolerance study. Food Quality and Preference, 1(1)37-41 Goff, H.D. (1992). Low-temperature stability and the glassy state in frozen foods. Food Research
International, 25:317-325
KOner, B., Zimmermann, G. and Berk, Z. (1980). Orange pectinesterase: purification, properties, ad effect on cloud stability. J. Food Sci., 45:1203-1206
Kramer, A. (1979). Effects of freezing and frozen storage on nutrient retention of fruits and vegetables. Food Technol. 2:58-61/65
Marshall, MR., Marcy, J.E. and Braddock, RJ. (1985). Effect of total solids level on heat inactivation of pectinesterase in orange juice. J. Food Sci., 50:220-222
Norma Portuguesa (1987). Frutos, produtoshorticolas e setts derivados. Detenninac.ao dos acucarestotais, dos acucares redutores e dos acucares nao redutores (sacarose). NP-1420, 1-9
Reid D S (1990). Optimizing the quality of frozen foods. Food Technol., 7:78-82
Reid, D.S. (1993). Basic physical phenomena in the freezing and thawing of plant and animal tissues. In: Frozen Food Technology. (Ed C P. Malleu). Chapman & Hall, 1-9
Versteeg, C., Rombouts, F.M., Spaansen, C.H., and Pilnik, W. (1980). Thermostability and orange juice cloud destabilizing properties of multiple pectinesterase from orange. J. Food Sci., 45:969-971/998