Adsorption of Anionic Dyes on the Biopolymer Chitin
Elisane Longhinotti, Fabíola Pozza, Lígia Furlan, Maria de Nazaré de M. Sanchez, Marilene Klug, Mauro C.M. Laranjeira, and Valfredo T. Fávere*
Grupo de Pesquisa em Quitinas e Aplicações Tecnológicas (QUITECH),
Departamento de Química, Universidade Federal de Santa Catarina, C.P. 476,
88040-900 Florianópolis - S.C., Brazil
Received: August 27,1997
A adsorção dos corantes aniônicos alaranjado IV, alaranjado G e alaranjado de xilenol pela quitina foi estudada empregando a isoterma de Langmuir. Os parâmetros de adsorção foram determinados utilizando várias regressões lineares da isoterma. Os resultados revelaram que a capacidade de adsorção é dependente do pH. Em pH ácido, os grupos aminos do polímero estão protonados e a cadeia polimérica está carregada positivamente, predominando a adsorção por troca iônica. Deve ocorrer também em pequena extensão adsorção de van der Walls e por ligações de hidrogênio. Para o alaranjado de xilenol uma relação linear com coeficiente angular de 0,726 L mg-1 foi encontrada. O aumento da temperatura diminui a capacidade de adsorção pela quitina, devido ao aumento da etapa de desorção no mecanismo. Os valores de ∆H de -10,9 kJ mol-1 para o alaranjado G e -28,9 kJ mol-1 para o alaranjado IV comprovam uma adsorção de natureza física para estes corantes sobre a superfície da quitina.
The adsorption of the anionic dyes orange IV, orange G and xylenol orange on chitin was studied, employing the Langmuir isotherm. The adsorption parameters were determined utilizing various linear regressions of the isotherm. The results showed that the adsorption capacity is dependent on pH. In acid pH, the polymer amino groups are protonated and the polymer chain is positively charged, with a predominance of adsorption through ion exchange. Van der Waals adsorption, as well as adsorption through hydrogen bonding, is also likely to occur to some extent. For xylenol orange, a linear regression was found, with an angular coefficient of 0.726 L mg-1. The temperature increase reduces adsorption capacity by chitin, due to the enhancement of the desorption step in the mechanism. ∆H values of -10.9 kJ mol-1 for orange G and -28.9 kJ mol-1 for orange IV prove the physical nature of the adsorption by these dyes on the chitin surface.
Keywords:anionic dyes, Langmuir adsorption isotherm, chitin
Introduction
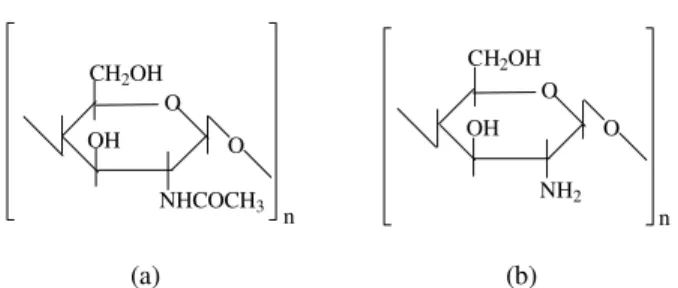
Chitin is a very common natural polysaccharide, found in marine animals, insects and fungi. This biopolymer consists predominantly of repeated units of N-acetyl-β -D-glucosamine (Fig. 1a) and will normally contain a small number of β-D-glucosamine units (Fig. 1b) in a chain1-3.
Chitin has been utilized as an adsorbent for a variety of substrates. Yang and Zall4 have studied the adsorption of various metallic ions. Giles and Hassan5 have investigated the adsorption of ionic species of sulfonated azo dyes and
Article
Printed in Brazil. 0103 -- 5053 $6.00 + 0.00
(a) (b)
O O CH2OH
OH
NHCOCH3 n
CH2OH
OH O
O NH2
n
inorganic and organic acids. McKay et al.6 have studied in detail the adsorption of blue acid dye 25, blue acid 158, mordant yellow 5 and direct red 24.
The study of adsorption is important for various physico-chemical processes and for an understanding of phenomena such as textile dyeing, clarification and depol-lution of industrial liquid effluents7,8.
For industrial liquid effluents, color is the first indica-tion of water polluindica-tion. The industrial dumping of effluents containing dyes not only mars the natural beauty of the rivers, but is extremely toxic to aquatic life, interfering in the transmission of sunlight and thus reducing the action of photosynthesis9.
The removal of dyes in the effluents is one of the major problems requiring solution by the textile industries. Some processes have been employed in order to solve this prob-lem, such as adsorption9,10, chemical floculation11, chemi-cal oxidation12,13 and biological techniques14,15. Adsorption appears to be a good alternative for the treat-ment of effluents.
The aim of the present study is to investigate the adsorp-tion of the dyes orange G (OG), orange IV (OIV) and xylenol orange (XO) by the biopolymer chitin, utilizing Langmuir isotherm to determine the adsorption parameters.
Experimental
Chitin extraction
Chitin was extracted from the exoskeleton ofshrimp with NaOH 1 mol L-1 for 24 h.This process was repeated three times with alkaline solution. The material was washed with water until the pH became neutral and demineraliza-tion was then carried out with HCl 2 mol L-1 at room temperature. The pigments were oxidized with NaClO 1% w/v and the material was washed until its pH was neutral. The material was then dried at 100 °C for two hours16,17 and pulverized at 100 mesh. The degree of deacetylation of the chitin determined by elemental analysis (Perkin Elmer 2400) was 10% (w/w).
Dyes
The dyes utilized in the adsorption experiments are illustrated below and were used as commercial salts.
Orange G as supplied by Synth (95 % purity) (Fig. 2). Orange IV as supplied by Sigma (98 % purity) (Fig. 3).
Xylenol Orange as supplied by Vetec ( 90% purity) (Fig. 4).
Dependence on pH
Samples of 100 mg of chitin were placed in a conical flask, with 25 mL of dye solution. The pH was adjusted to the desired value by the addition of acid or alkaline solution and control of the medium ionic strength was achieved by addition of NaCl 0.10 mol L-1. The flask was then closed
and placed in a bath controlled by a thermostat at 25.0 ± 0.5 °C, for two hours. After the contact period, supernatants were separated from the solid phase by centrifugation, and the concentrations of dyes in solution were determined from the respective analytical curves. The quantity of the dyes adsorbed was determined by the following equation:
{QD} = (C0− Cf) V
W (1)
where {QD} is the quantity of dye adsorbed (mg g-1), Co is
the initial concentration of dye in the solution (mg mL-1), Cf is the final concentration of dye in the solution (mg
mL-1), V is the volume of the solution in milliliters (mL) and W is the mass of chitin in grams.
Adsorption isotherms
The adsorption isotherms were obtained by the batch method, employing 100 mg of chitin and 25 mL of the dye solution at different concentrations. These solutions were buffered at a pH optimum (pH 4.0) for adsorption. These solutions were stirred in mechanical shakers until they reached adsorption equilibrium (60 min). The polymer was separated by centrifugation and the quantity of dye ad-sorbed was determined by employing a spectrophotometer UV-Vis, Hitachi model U-3000, in the respective λmax. of
each dye.
R = ( (CH2COOH ) 2 N CH2 )2 SO3Na
C CH3
H3C
O OH
R R
Figure 4. Structure of Xylenol Orange (OX).
N=N
NaO3S
SO3Na OH
Figure 2. Structure of Orange G (OG).
N=N
NaO3S NH
Results and Discussion
The effect of the different values of pH on the adsorp-tion of dyes by chitin is represented in Fig. 5. The data indicates that the adsorption capacity of dyes by chitin is dependent on pH. The biopolymer has functional groups OH, NHCOCH3 and NH2. According to Giles and Hassan5,
the hydroxyl groups of the polymer are strongly hydrated and are virtually incapable of forming hydrogen bonds with dyes; nevertheless they can adsorb, by the formation of a hydrogen bond, by van der Waals interactions and also by ion exchange with other groups.
Depending on the pH in the water, the polymers con-taining the amino groups are neutral (-NH2) or cationic
(-NH3+). At a pH of higher acidity, these groups are
pro-tonated and to maintain neutrality in an aqueous environ-ment, negative counter-ions are adsorbed. These ions are movable and are exchanged by ions from the dyes at appropriate pH. In this case we have a process of ionic exchange in which electrostatic interactions are involved8. The results show a tendency towards greater adsorption for anionic dyes (in the pH range of 3-4). At a pH below 2, the anions in the solution compete with the anionic dye, thereby decreasing adsorption. This is also observed in alkaline pH since the amino groups of the polymer are deprotonated.
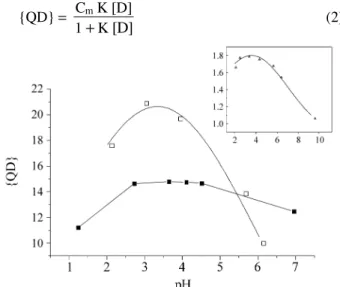
The most frequently employed adsorption processes consist of measuring the relation between the concentration of the solution in the solid phase and the concentration of equilibrium in the aqueous phase. The Langmuir adsorp-tion isotherm is the best known model and the one most frequently utilized to determine the adsorption parame-ters6,7,18-20. The Langmuir expression can be represented by the equation:
{QD} = Cm K [D]
1 + K [D] (2)
where {QD} is equal to the quantity of dye adsorbed in milligrams per gram of chitin, Cm is the maximum quantity
of dye adsorbed in mg per gram of chitin, K is the constant of the Langmuir adsorption, and [D] is the dye concentration of the equilibrium in milligrams per liter. Figures 6, 7, and 8 show the adsorption curves of the three dyes by chitin.
The experimental data in this work was always inter-preted in terms of the Langmuir isotherm. Regarding Lang-muir, the quantity adsorbed reaches a near-saturation level when the concentration of equilibrium increases; however, for xylenol orange, a linear relation was observed between the equilibrium concentration and the quantity absorbed. Some examples of linear relations were also reported in the studies of Bird and Harris21 and Gonzales-Davilla et al.22; and these isotherms were classified with the Nernst iso-therm, that is {QD} = KL [D]. The angular coefficient of
Figure 5. pH effect on the adsorption of dyes by chitin at 25.0 ± 0.5 °C. XO (100 mg/L). OG (100 mg/L). ∆ OIV (5.0 mg/L).
Figure 7. Adsorption of OIV on chitin. ∆ 25.0 ± 0.5 °C. O 35.0 ± 0.5 °C.
• 45.0 ± 0.5 °C. 53.0 ± 0.5 °C. Acetate buffer (0.10 mol L-1), pH = 4.0 and contact time of 60 min.
this isotherm (KL) corresponds to the ratio between the
solubility of the dye in water and in the solid phase. In this case, the value of KL represents the partition coefficient of
the Nernst equation. The partition coefficient of this dye between the two phases was 0.726 L mg-1.
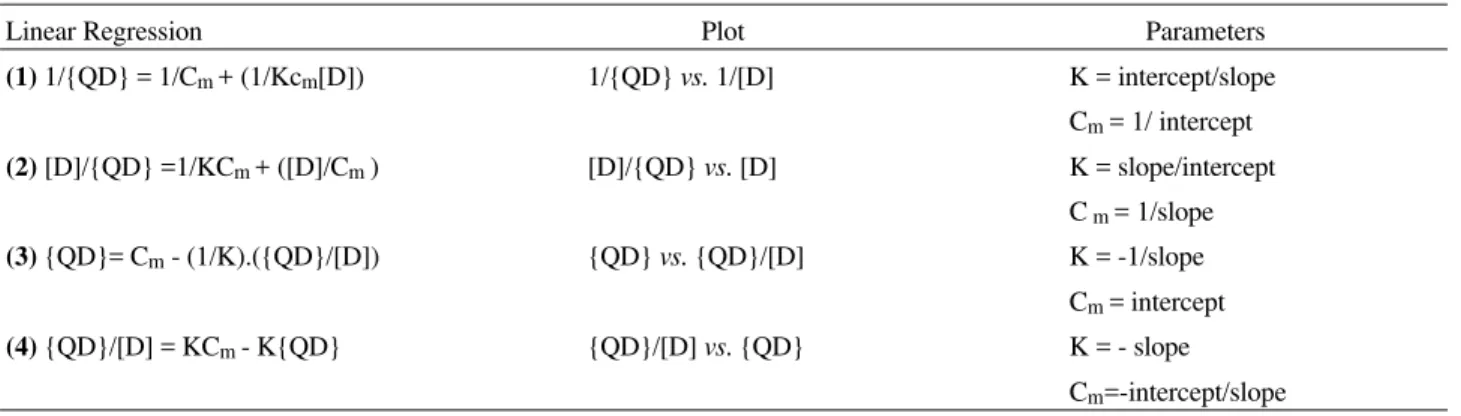
Langmuir adsorption parameters are determined by transforming the Langmuir Eq. 2 isotherm to a linear form. The isotherm can be made linear in at least four different ways. Depending on the linearization chosen shown in Table 1, different estimates are obtained for the values of the parameters. This occurs because, depending on the way the isotherm is linearized, the error distribution changes either for better or for worse18. However, the best transfor-mation has been extensively reported in the biochemical literature where equations analogous to the Langmuir iso-therm are important for the description of the binding sites for the drugs and enzyme catalysis. The best treatment is obtained by using the second equation in Table 1, since this choice tends to minimize deviations from the fitted equa-tion, resulting in the best error distribuition18.
Figures 9 and 10 illustrate the linearizations selected to calculate the adsorption parameters.
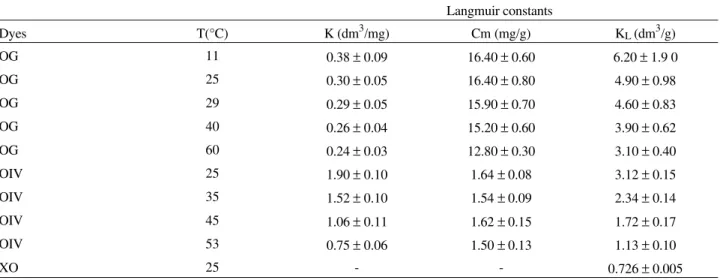
Table 2 illustrates the results of values of the adsorption parameters. In Eq. 2, Cm represents the monolayer coverage
in terms of mg dye/g chitin, and is related to the Langmuir equilibrium constant6, KL by the equation:
Figure 10. Linearization (2) of adsorption isotherm for OIV. ∆ 25.0 ± 0.5 °C. O 35.0 ± 0.5 °C. • 45.0 ± 0.5 °C. 53.0 ± 0.5 °C.
Figure 8. Adsorption of XO on chitin at 25.0 ± 0.5 °C. Acetate buffer
(0.10 mol L-1), pH = 4.0 and contact time of 60 min. Figure 9. Linearization (2) of adsorption isotherm for OG. 11.0 0.5 °C. ∆ 25.0 ± 0.5 °C. O 29.0 ± 0.5 °C. • 40.0 ± 0.5 °C. 60.0 ± 0.5 °C.±
Table 1. Linear transformations of the Langmuir isotherm.
Linear Regression Plot Parameters
(1) 1/{QD} = 1/Cm + (1/Kcm[D]) 1/{QD} vs. 1/[D] K = intercept/slope
Cm = 1/ intercept (2) [D]/{QD} =1/KCm + ([D]/Cm ) [D]/{QD} vs. [D] K = slope/intercept
C m = 1/slope (3) {QD}= Cm - (1/K).({QD}/[D]) {QD} vs. {QD}/[D] K = -1/slope
Cm = intercept (4) {QD}/[D] = KCm - K{QD} {QD}/[D] vs. {QD} K = - slope
KL= Cm K (3)
The effect of temperature on orange G and orange IV adsorption shows that the adsorption capacity decreases with the temperature. Orange G maximum adsorption de-creases from 16.4 to 12.8 mg g-1. For orange IV, the capacity decreases from 1.64 to 1.50 mg g-1. This phenome-non is quite common6 and is caused by the increase in the desorption step when the temperature increases. The 10-fold difference between the maximum quantity of adsorbed dye (Cm) values for the dyes OG and OIV can be attributed
to the interaction between the chitin chain and π-electron system of the orange G, which is identified as van der Waals attraction. The extension of a planar dye molecule which can be oriented along one chitin chain probably determines this physical attraction. Also, hydrogen bond forces related to the hydroxyl group in the molecule can also contribute to this interaction.
From the values of the constant KL, the adsorption
enthalpy was determined by plotting the log KL vs. 1/T
(Kelvin). The values of ∆H of -10.9 kJ mol-1 for orange G and -28.9 kJ mol-1 for orange IV were determined by means of the angular coefficient in the graphs of Fig. 11. These values are in good agreement with those reported by McKay et al.6 for the adsorption of Acid Blue 25, Acid Blue 158 and Mordant Yellow on chitin. The negative values indicate that heat is released during the adsorption process, and the small values of ∆H confirm an adsorption of a physical nature.
Acknowledgments
We thank CNPq, FNMA and FUNCITEC for financial support.
References
1. Muzzarelli, R.A.A. In Chitin; Pergamon Press: Ox-ford, England;1977p 8 and 11.
2. Mathur, N.K.; Narang, C.K. J. Chem. Educ.1990, 67, 938.
3. Maghami, G.G.; Roberts, G.F.A. Makromol. Chem. 1988, 189, 239.
4. Yang, T.C.; Zall, R.R. Eng. Chem. Res.Div.1984, 23, 168.
5. Giles, C.H.; Hassan A.S.A. J. Soc. Dyers Col.1958,
74, 846.
6. McKay, G.; Blair, H.S.; Gardner, J.R. J. Appl. Polym. Sci.1982, 27, 3043.
7. Adamson, W.A. Physical Chemistry of Surfaces; Cali-fornia, 1990, p 595.
8. Zollinger, H. In Color Chemistry: Syntheses, Proper-ties, and Applicatios of Organic Dyes and Pigments; VCH Verlagsgesellschaft mbH, Weinheim, 1991.
Figure 11. Log KL vs. 1/T: (•)OG, (O) OIV.
Table 2. Parameter values of adsorption.
Langmuir constants
Dyes T(°C) K (dm3/mg) Cm (mg/g) KL (dm3/g)
OG 11 0.38 ± 0.09 16.40 ± 0.60 6.20 ± 1.9 0
OG 25 0.30 ± 0.05 16.40 ± 0.80 4.90 ± 0.98
OG 29 0.29 ± 0.05 15.90 ± 0.70 4.60 ± 0.83
OG 40 0.26 ± 0.04 15.20 ± 0.60 3.90 ± 0.62
OG 60 0.24 ± 0.03 12.80 ± 0.30 3.10 ± 0.40
OIV 25 1.90 ± 0.10 1.64 ± 0.08 3.12 ± 0.15
OIV 35 1.52 ± 0.10 1.54 ± 0.09 2.34 ± 0.14
OIV 45 1.06 ± 0.11 1.62 ± 0.15 1.72 ± 0.17
OIV 53 0.75 ± 0.06 1.50 ± 0.13 1.13 ± 0.10
9. Nawar, S.S.; Doma, H.S. Sci. Total Environ.1989, 79, 271.
10. Waters, B.D. Water. Pollut. Control.1979, 78, 12. 11. Smith, K.T.; Brent; H.S. Am. Dyest. Rep.1993, 82, 18. 12. Benszedits, S. Am. Dyest. Rep.1980, 69, 37.
13. Nambooodri, C.G.; Perkins; W.K. Am. Dyest. Rep. 1994, 83, 17.
14. Hamza, A.; Hamoda, M.F. Industrial Waste Confer-ence, Purdue University, Indiana, 1980, p 151. 15. Guoging, W.; Hengli, D.; Lin, C.; Lin; Z.N. Water
Treat.1990, 5, 463.
16. Fujita, T. Japan Patent, Chemical Abstract1978, 7, 013, 599.
17. Broussignac, J. Chim. Ind. Gén. Chim.1970, 99, 1241. 18. Kinniburgh, G.D. Environ. Sci. Technol. 1986, 20,
895.
19. Longhinotti, E.; Furlan, L.; Laranjeira, M.C.M.; Fávere, V.T. Química Nova1996, 19, 221.
20. Furlan, L; Fávere, V.T.; Laranjeira, M.C.M. Polymer 1996, 37, 843.
21. Bird, C.L.; Harris, P. J. Soc. Dyers Col.1957, 73, 199. 22. Gonzales-Davila, M.; Santana-Casiano; Millero, F.J.