RS
UNIVERSIDADE
DE
ÉVORA
Influência
dos obstáculos
de
pequena dimensão na
estruturação
dos
agrupamentos
piscícolas
,írífr
The
impact
of small physical
obstacles on
the
structure
of
freshwater Íish
assemblages
Carlos Manuel Engeitado Alexandre
Licenciado em Biologia
Investigador do Instituto de Oceanografra
EV
Tese apresentadaà Universidade de Évora para-obtengão do grau de Mestre em
Conservação e Reabilitação de Águas Interiores.
Orientação:
Professor Doutor Pedro Raposo de Almeida
(Professor Auxiliar, Departamento de Biologia, Universidade
u"u'"*'JT"À
IqL
Esta tese não
inclui
as críticas e sugestões feitas pelojúri.
Mnsrnaoo
EM
CoNsrcnvlÇÃo
E
REABILITAÇÃo
DE
AcUaS
INTERIORES
Évonq.
2008
AGRADECIMENTOS
No final
desta tese gostariade
agradecera
algumas pessoas que contribuíramdirecta ou indirectamente para a sua elaboraçáo;
Ao
ProfessorDoutor Pedro
Raposo deAtmeida,pela
sua orientação epelo
interesseque sempre demonstrou
por
este trabalho, desdea
sua idealização atéà
fasefinal
deescrita. Sem o seu peÍmanente incentivo, a conclusão desta tese seria infinitamente mais
dificil.
Ficarei sempre agradecido pela permanente aposta que tem feito no meu trabalho ao longo dos últimos anos;A
Prof. Doutora IsabelÂmbar,
directora do Instituto de Oceanografiada Faculdade deCiências da Universidade de Lisboa e à Prof. Doutora
Maria
José Costa, coordenadorado
Grupo deZoologia
Mariúa
pela disponibilizaçdo das instalaçõese
restante apoiologístico, indispensáv el à realização deste trabalho;
A
Prof.
Doutora
Maria
IIhéu,
pelos
importantes ensinamentosque me
transmitiudurante o
último
ano e que muito contribuírampaÍaaminha
evolução profissional;Ao
Bernardo Quintella
pelo
apoio
e
sugestõesque
de
forma
permanente sedisponibilizapaÍadar.
Com ele vou sempre aprendendo qualquer coisa de novo;Ao
Lino
Costa pela disponibilidade na revisão e correcção do trabalho escrito e peloaconselhamento de alguns tratamentos estatísticos ;
Aos
meus colegasque auxiliaram
no
trabalhode
campo:Catarina Mateus, Filipe
Romão,
Sflvia
Pedro eVera Canastreiro.
À
Ana
Ferreira
peloauxilio
no trabalho decampo e
por ter
servido de"cobaia"
parao
inicio
do tratamento dos dados da tese.À
Ana
e àAndreia
da Forpescas.Aos meus sogros e cunhada, por terem permitido a minha estadia em sua casa ao longo
das inúmeras viagens Évora-Lisboa. Vendas Novas transformou-se também na
miúa
casa!
A
minha avó pelo seu apoio e permanente preocupação cadavez que vou para o campo.Agora que
estou
mais
longe,
reconheçoa
falta que
sempreme fizeram as
suasconstantes recomendações.
Aos
meuspais,
portudo o
que semprefrzeram para que os meus esfudos e posteriorcarreira profissional seguissem por bom
camiúo. A
nova e importante vida queiniciei
este ano não apaga as saudades que sinto de uma casa que sei que há-de ser sempre a
minha;
À
Paula, por todo
o
apoio,
amore
compreensão que sempre demonstrou. Agradeçoprincipalmente por ser pedra basilar da minha vida e fonte profusa de vida e alegria.
Este
fiabalho
foi
suportado financeiramentepela
FCT
(MCTES),
atravésdo
seuprograma de financiamento plurianual ao Centro de Oceanografia
(I&D
199).The
impact
of
small physical
obstacles
on the
structure
of
freshwater Íish
assemblages
I
Carlos
Manuel
EngeitadoAlexandre
t
Instituto
de OceanograJia, Faculdade de Ciênciasda
Universidade deLisboa,
CampoGrande, I 7 49-0 I 6 Lisboa. E-mail
:
carlos. a. alexandre@clix.ptABSTRACT
Many studies have assessed the effects
of
large dams on fishes but few have examinedúe
effects of small obstacles. Fishes were sampled and environmental variables were characteized
at 28 sites in two Iberian süeams, 14 located immediately downstream, upstream and between
five
small obstacles at River Muge and 14 at River Erra, considered as the reference steam.Multivariate analysis indicated that habitat variables
like
current velocity and depth, but notphysicochemistry, were the main responsible
for
site groups' discriminationin
both streams.The reference stream
eúibited
a longitudinal gradient of current velocity that, however, wasn'tstrong enough to cause significant changes in the fish assemblage's composition and structure.
By
successive and drastically repeating this gradient near each structure,úe
obstacles streampresented differences in fish fauna between the three site types. Lentic upstream sites presented
higher density of limnophilic, omnivorous and exotic species, like gudgeon Gobio lozanoi,who
are
well
adaptedto this
type
of
habitat. Downsffeam and between obstacles sites werecharacteized
by
the
dominanceof
rheophilicand
invertivorous t@ea, especially barbelLuciobarbus bocagei. Richness metrics did not differ among site types, but diversity was higher
in sites located between the obstacles away from its direct influence, where the habitat diversity
was higher. Contrarily to upstream sites, downstream and between obstacles sites were similar
in
manyof
the studied features to the reference streanq implying that this typeof
structurescause a higher modification in the upstream fish community. This study suggests that the effects
of small obstacles on habitat and fishes are similar, in some extent, to those reported for larger
dams, proüding important considerations for riverine ecosystem conservation efforts.
KEYWORDS: Fish assemblages, small physical obstacles, habitat fragmentation, connectiüty,
ecological guilds, Portugal.
Influência
dos
obstáculos
de
pequena
dimensão
estrufuração
dos
agrupamentos
piscícolas
na
RESUMO
O
efeito
das grandes ba:ragensna
comunidade piscícolavem
sendo docnmentado pornumerosos estudos, enquanto o número de trabalhos que incidem sobre o efeito dos obstiículos
de pequena dimensão é bastante mais reduzido.
A
comunidade piscícolafoi
amostrada e asvariáveis ambientais foram caracteizaÁas em 28 locais diüdidos por dois cursos de
ágn
daPenínsula lbérica, 14 dos quais localizados imediatamente a montante, jusante e entre cinco
pequenos obstiículos na Ribeira de Muge e 14 na Ribeira de Erra, considerada a linha de água de
referência. Através de
aúlise
estatística multivariadafoi
possível verificar que variáveis dehabitat como a velocidade de corrente e a profundidade, e não as variáveis fisico-químicas,
foram as principais responsáveis pela discriminação dos vários grupos de locais nas duas
ribeiras. A ribeira de referência exibiu um gradiente longitudinal de velocidade de corrente que,
contudo, não era suficientemente forte para causar alterações significativas na composição e
estrutura dos agrupamentos piscícolas. Através da sucessiva e drástica repetição deste gradiente
junto a cada estrutura, a ribeira com obstiâculos apresentou diferenças na fauna piscícola enhe os
três tipos de locais. Os troços lênticos a montante apresentavam t,ma densidade mais elevada de
espécies limnofilicas, omnívoras
e
exóticas, comoo
góbio (Gobio lozanoi), que esüío bem adaptadasa
estetipo
de habitat.Os
locaisde
amostragem situados a jusantee
enfre osobstáculos caracteizavarn-se pela dominância
de taxa
reôfrlose
invertivoros(i.e.
barbo,Luciobarbus bocagei).
As
métricas relacionadas coma
riqueza, especifica não apresentaramdiferenças entre os três tipos de locais, ao contriirio da diversidade que
foi
mais elevada nospontos situados enfre os obsfáculos, afastados da sua inÍluencia directa, onde a diversidade de
habitats ta:rrbém é mais elevada. Contrariamente aos locais a montante, os troços a jusante e
entre os obstiículos apresentaram similaridades, em muitas das características estudadas, com a ribeira
de
referência, sugerindo que estetipo
de
estruturas provoca uma alteração maissignificativa
na
comunidade piscícolaa
montante. Este estudo sugere queos
efeitos dospequenos obstaculos no habitat e na ictiofauna são, em parte, semelhantes aos descritos para as
grandes barragens, fomecendo considerações importantes para os esforços de conservação dos ecossistemas ribeirinhos.
PAL/NVRAS-CHAW: Agrupamentos piscícolas, pequenos obsüículos, fragmentação de habitat,
conectividad e, guilds ecológicas, Portugal.
Submetido para publicação
l2
de Fevereiro, 2009-
Rivers Reseorch and ApplicationsINTRODUCTION
Historically, rivers and
adjacent areas have been usedby
human populationsmore than any other type
of
ecosystem(Jungwirth,
1998). Humans have exploited theresources
provided
by
rivers
andtheir flood
plains
anddrastically modified them
toreduce the threat to urban areas
(Arthington
&
Welcomme,1995; Jungwirth, 1998). Asa result from this sometimes unruled use, very few water courses maintain their
original
integrity (Jungwirth,1998;
Jager et a1.,2001).By
theearly
1900s, most large riversin
temperate regions had already been modified, and nearly
all
large rivers in theworld
arenow
impounded
by
hydroelectric power plants
and
other hydraulic
structures(Welcomme, 1995).
Fragmentationand loss
of
aquatic
habitat
originated
by
theconstruction
of
artificial
barriers such as dams, weirs, roads or bridges are someof
themost
important
anthropogenicactions
in
this type
of
ecosystem,at
a
global
scale (Dynesius&
Nilsson,
1994; Jungwirth eta1.,2000;
Morita
&
Yokota,
2002; Nilsson, 2005).[n
rivers,
fragmentationis
easyto
accomplish since a single damming event isenough to isolate adjacent
river
segments (Jager et aL.,2001).Unlike
many
groups
of
animals,
fish
movement
is
limited
to
within
watercourses. Because
of
their high
mobility
and stage-specific movement pattems, aswell
their distinct
habitat requirements,steam-dwelling fish
populations are severelyaffected
by
the disruption
of
the longitudinal
continuum,
proving
to
be
sensitiveindicators
for
assessmentof
the highly
variable connectivity conditions
of
runningwaters over space and time (Jungwirth et a1.,2000;
Morita
&
Yokota, 2002).The impacts
of
large dams(i.e. height>l5m
definedby Poff
&
Hart,2002)
onfish
arewell
documented. The obstructionof
the dispersal and migrationof
organismsis its most discussed effect (i.e. Saunders et
al.,l99l;
Dynesius&
Nilsson,
1994;Peter,1998; Nilsson, 2005), being
directly
linkedto
lossof
populations and entire speciesof
these
sfuctures
on the
aquatic
ecosystems,namely
the
changeson
úe
habitatcharacteristics
from
alotic
to
alentic
environment (i.e. Martinez et a1.,1994; Godinhoet a1.,1997; Rodriguez-Ruiz, 1998; Guenther
&
Spacie, 2006), consequently benefitingthe
nonnative species,and
degradationof
the water
quality
resulting
from
the
high nutrient accumulation and primary production growth (i.e. Godlewska&
Swierzowski,2003; Carol et a1.,2006). Contrary to the extensive literature that exists about the large
dams,
the
effects
of
small
obstacles such asweirs,
low-head dams,road
crossings,culverts
and
bridges
have
received less attention.
Most
of
the
studies
that
haveinvestigated
the
impact
of
suchsmall barriers
mainly
concernwith
fish
migrations(Lucas
&
Frear, 1997;Wanen&
Pardew, 1998; Winter&
Van Densen, 2001;Ovidio
&
Phillipart, 2}}2),populations
isolation(Morita
&
Yokota, 2002; Meldgaard et a1.,2003)or its
application as a methodfor
preventingthe
invasionof
migratory exotic
species(Thompson
&
Rahel, 1998;Mclaughlin
et a1.,2007). However, studies addressing theimpact
of
small
obstacleson fish
community
structureremain
scaÍce and have beencarried out mainly
in
France andU.S.A
(Cumming,2004; Tiemann et aL.,2004; Gilletteet aL.,2005; Poulet, 2007).
Small
obstacles designscould
vary from
simple, low-water fords
to
massiveconcrete
or
earth-filled structures (Warren&
Pardew, 1998; Gibson et a1.,2005). Someof
them may
act as semipermeableor
seasonal barriersto fish
movement,similar
toshallow
riffles,
others may precludeall
movementsby
fishes,similar
to
the effectsof
dams
(Winston
etal.,
l99l).
Regardlessof
their
size and complexity, the presenceof
these structures
is
often
associatedto
local
changesin
the physical
structureof
therivers,
mainly the
homogenizationof
severalmicro-habitat
characteristicssuch
ascurrent
velocity,
depth, substrate, among others (Hagglund&
Sjoberg, 1999;Dodd
eta\.,2003;
Santucci eta\.,2005;
Poulet, 2007). The native fish fauna of alotic
ecosystemis
generally
well
adaptedto
natural
fluctuations
of
the
environmental
conditions(Gehrke
&
Haris,
2001)but
there are clear evidencesof
anevolution
in
theway
toexploit
specific habitat features,which
includefor
example,highly
adapted body fomtsand mouth position.
Any
fypeof
change to the habitatstability
could alter thelife-cycle
of
fish
speciesand
consequentlythe local
structure pattems
of
its
assemblages(Welcomme et
al.,
2006).The native freshwater
fish
faunaof
the Iberian Peninsulais
charactenzedby alow
numberof
families,with
mostof
the species belonging to thefamily Clprinidae,
ahigh degree
of
diversification at the species level, and the greatest European percentageof
endemism(Doadrio,200l;
Clavero eta1.,2004;
Rogadoet
a1.,2005).As in
otherMediterranean peninsulas,
the Iberian
fluvial
network
is
complex, comprisinga
highnumber
of
independentriver
basins where the different species populations are stronglyisolated and
highly
vulnerable
to
habitat
alterations (Collares-Pereiraet
al.,
2000;Corbacho
&
Sanchez,200l;
Clavero eta1.,2004).Iberian
ichthyofaunas have receivedlittle
attention, speciallythe
onesfrom
small rivers,
evenúough
an urgent needfor
conservation and
plans
of
action
arerequired
(Corbacho&
Sanchez,20Ol).
In
thiscontext, a comprehensive assessment
of
fish biodiversity and their possible relationshipwith
environmental variables andriver
alterations should be carried out as an importantmanagement tool for its conservation.
ln
thiswork
it
is presented a comparative analysisof
the
fish
assemblages'structure
of
two
Iberian
streamswith
similar
original
characteristics
but
different levels
of
impact from the
presenceof
small
physical obstacles.The aim
of
this
study
was
to
evaluatethe
hypothesisthat the
habitatalterations originated
by
the presenceof
this typeof
structureswill
promote changes onthe structure
of
fish assemblages.MATERIALS AND METHODS
Study
areaIn
the
beginning
of
2008,
a
field
survey
was
conductedin
order
to
find
watercourses
with
similar abiotic and biophysic characteristics butwith
different levelsof
impact from the presenceof
smal1 obstacles. The southem basinsof
the country wereavoided to reduce the structuring effect
of
their harsh intermittent hydrological regime,as
well
riverswith
a high regulatedflow,
causedby
the presenceof
large dams or otherhydroelectrical structures. Rivers were selected using a
criterion
of
minimum
evidenceof
human disturbance (presenceor
absenceof
small
obstacles aside) such as majorpoint-source
pollution or
agriculturalrun-off
(Dodd etal.,
2003).After
this survey,two
rivers were selected
for this
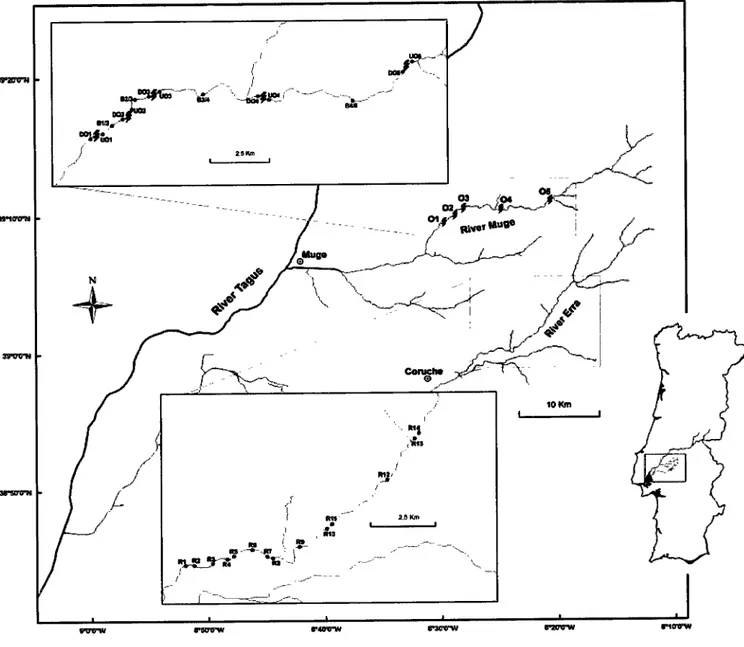
study:River Ena
and River Muge(Figure
1). These riversbelong to the River Tagus basin, considered Europe's
fifth
major basinin
termsof
areaand the
third
on the lberian Peninsula, covering atotal
surfaceof
about 80629 km2,of
which
24800 km2 (30%) arein
Portugueseterritory
(INAG,
2008a). Being located neareach other
in
alow
altitude (= 54m), reduced slope (4-8%) andhigh
mineralization areaon
the
sedimentary depositsof
the Tagus basin(INAG,
2008a), theserivers
are verysimilar
in
what
concems
to
environmental
and
climate
features.
The
aÍea
ischaracterued
by
alow
annualrainfall,
nearly 730mm+l18.30
(mean+s.d.), and a highmean annual temperature (15.5'C+0.38). Both rivers have a
low
mean annual drainage,which can vary between 100-200 mm
(INAG,
2008a)'The River Muge
is
severely affectedby
the presenceof
small obstacles, mostof
them
consistingof
bridges
for
the
passageof
people
and/or vehicles,wiú
elevatedbases similar
to
small weirs or low-head dams.In
thisthird
orderriver,
a reachof
17.5km of
length
(with
the
river's total
length being 55
km)
with five
structuresof
thedescribed type was selected as the "Obstacles stream". For a more detailed description
of
the studied obstacles, please check AppendixI.
TheRiver
Erra(total
lengthof
37.5rzFfr
sl6EI{
suer
SERFH
km),
being
significantly
less
affectedby
habitat
fragmentation,was
electedas
the"Reference stream" and a reach
of
similar
order and length butwithout
the presenceof
any obstacle was considered for the study (Figure 1).
nfgor ffÚÚc
Cducll
@
l0 l(fi tl
gUFW Í@ry .l.aoleu, rrew rlCFg
Figure
l.
Location ofúe
study area and sampling sites(')
in
the "Obstacles stream" (RiverMuge) and in the "Reference stream" (River Ena). Obstacles are identified by lightening
ü).
,O,
UO
andB
abbreviations represent respectivelythe
sampling sites locateddownstream, upstream and between the obstacles, while R represents the sampling sites in
the reference sfream.
5 I I
i
,i -1,ãr€ z!6 L.-J ,,I N+
tr Itlt)
t. I l§' aôh a n0 õ I I El, -_+_J3 I E I,1€-É#
í 'i ', :tl I EtoaFw I -É= ÊflSampling
procedure
In
the obstacles stream, sampling was donein
threetlpes of
sites: immediatelydownstream
from the
obstacles(DO),
immediately upstreamfrom the
obstacles(UO)
and between obstacles, away
from its
direct
influence(B),
in
a
total
of
14 sites.An
equal number
of
sites were sampledin
the
reference stream(R),
respectingthe
samealrangement and distance between them.
In similar
studies, reference and non-referencesites were selected and compared
in
the
same watercourse(i.e.
Tiemann eta1.,2004;
Poulet, 2007). Considering the
longitudinal
continuumof
thelotic
ecosystems and thelinkage between
all of
its components (see Vannote et a1.,1980), selecting the two typesof
reachesin
different rivers allows to reduce the indirect effectof
the obstacles on thereference sites (Dodd et
a|.,2003).
During May
2008, fishes were collectedwith
a backpack electrofishing device(Hans Grassl
ELT60II
HI,
500V
DC, 104), following an
adaptationof
the
standardsampling
protocol defined
by
INAG
(2008b)
in
the
scopeof
the Water
Framework Directive. According to this protocol, theminimum
length of the sampling reach shouldbe 20 times
its
meanwidth,
never being lessthan
100m. In this
study,this
was thelength sampled
in all
sites because noneof
them had more than 5m of width.
Each sitewas blocked
oft,
at its downstream and upstreamlimits,
with
20 mm knot to knot meshsize nets that were secured to the stream bed to prevent the escape
or
entryof
any fish.For
a better estimationof
Íish
abundance, a removal methodwith
at least three passeswas completed at each site. Regardless of the higher
simplicity
and cost-effectivenessof
the single-pass method, which is mostly recommended
for
simple monitoring progÍams,úis
procedure hasproven
to
be more
accurateon
successfully determinethe
fish
abundance
in
this typeof
studies (Meador et a1.,2003; Peterson et a1.,2004).After
eachpass, fishes
were identified
and countedallowing
a
breakof
ll2h to
let
úe
systemrecover and
the
fishes retaketheir
normal behaviour.Additional
electrofishing passeswere made
if
necessaryuntil
the
catchper
pass declinedby
75Yoor
more
betweensuccessive passes (Peterson et al.,2OO4).
At
the endof
each pass, nets were cleanedof
debris and
inspectedto
ensurethey
were barriers
to
fish
passage.All
block
netsremained
in
position
until
electrofishing
samplingwas
concluded.All
captured fishwere placed
in
oxygenatedlive
wells
and
held
at
streammargins.
Only after
theconclusion
of
all
passesfishes
were
retumed
alive
to
their natural
environment.Considering
the specific
daily
variation on the
spatial occupationof
eachtmon,
thesampling procedure was completed at a similar hour and climate conditions
in all
sites.For
each
site
sampled,water
temperature(oc),
dissolved oxygen
(mgl-'),
conductivity
(pS/cm) andpH
(Sorensen scale) were recorded, using a calibratedmulti
parameter probe
(fS/
600XLM-M)
coupled toa
data logger viewer(fS/
650MDS)
anda
pH
probe(pH
1g7
WTW).
Currentvelocity (rnr-')
was measuredusing
a
Valeportcurrent meter
(Model
105)
and meandepth
was
obtainedby
taking
measurements(precision of 0.01 m) several times at each sampling site (minimum of 3 measurements).
Dominant
type
of
substratein
eachsite was
characteizedconsidering
5
differentclasses:
silt;
sand;gravel;
pebbles;blocks. The biophysic
featuresof
eachsite
werecharacteized
by
direct observation, namely thefollowing
parameters: shade (providedby
the riparian habitat) and aquatic cover (providedby
aquatic vegetation, debris androcks) proportions (5 classes : 0-200Á; 20-40%; 40-60%; 60-80%; 80- l 00%)'
Data
analysisAll
abiotic
andbiotic
variables were log-transformed before being statistically analysedto
reducenormality
deviations. Before
the
application
of
any
parametricanalysis,
normality
and homogeneityof
variances were testedfor
each variable, usingShapiro-Wilk
Z-statistic and the Levene test, respectively.Sampled
sites
on both
streamswere
groupedby
their abiotic
and biophysiccharacteristics using a hierarchical classification
with
a linkage between groups'meúod
and the
Euclidean distance as measure, asrecoÍlmended
for
abiotic
data(Sokal
&
Rohlf,
1981).An
arbitrarycut-off
level
was used, suchthat
separate groups could bechosen. This analysis was complemented
with
a stepwise discriminant function analysis(DFA; Wilks's
l.
method,F
entry:
3.840,F
removal: 2.710)to identiff
the variablessignificantly
responsiblefor
the group discrimination. These analyses were performedand resulting plots displayed using SPSS 12.0.
After
the
application
of a
multiple
pass removal method
in
the
samplingprocedure,
fish
species' abundancein
the
sampled siteswas
estimatedwith
Leslie'scensus method
(Cowx,
1983) byplotting
captureper
:umritof ef[ort
(CPUE, expressedin
number
of
fishes caughtper
mimúe) against cumulativeremoval
and estimating thetotal
numberof
fishesthat
would
be removed whenthe CPUE
tendsto
zero.[n
úe
resulting graphic, designated
by
Leslie's representation (AppendixII),
the estimativeof
the
initial
population's
dimension(N-)
correspondsto
the
point
in
the
abciss whenCPUE:0
andit
can be calculatedby dividing
the regressionline's
interceptby
its slope(capturability coeffrcient)
§-:
- (a/b)1.All
the assumptions for using this method weresatisfied
in
the
study design.With
úe
estimated abundance values, andknowing
thearea
of
the
sampled sites (meanwidth of
the reachx
sampled length), each species'density
was
calculatedand
expressedin
number
of
fishes
caughtper
!00
m2. Thelamprey's
ammocoetes (genera Lampetra) and the mosquitofish (Gambusia holbrookiGirard,
1859) capturedin
both streams were removedfrom
the subsequent analysis dueto
their
ecological features and responseto the
sampling methodology. Thefirst
ones havevery
specific habitat requirements,forming
large accumulation areas commonly known as aÍnmocoetes beds(Almeida
&
Quintella,2002), which
can cause disturbancein the
field
sampling and bias in the data analysis. As for the mosquitofish, its small sizeand shoaling behaviour allows these specimens
to
escapein
high
numberfrom
the netblocking, reducing its capture efficiency.
The association between
fish
community composition (meanN-
valuesof
eachspecies) and site types
within
each sfteam was tested by using a G-testof
independence(Sokal
&
Rohlf,
1981).A
Canonical CorrespondenceAnalysis
(CCA Ter Braak,
1987)was
used tocharacterise and compare the relation between the spatial
variability
of the captured fishspecies (expressed
in
density) and the environmental parametersin
both studied rivers,(CANOCO 4.5). The result
of this
analysisis
anordination
diagram, where symbolsrepresent
fish
speciesand
sites sampled, and vectors correspondto
úe
environmentvariables. The vectors indicate the direction
of
maximum variationof
the correspondentenvironmental variable. Environmental variables, whose projection
in
a particular axisis
extended, are strongly correlatedwith
the referred ordination axis (Ter Braak, 1987).The statistical significance of the relation between the fish species density and the set
of
environmental variables was assessed
through a Monte Carlo global
permutation test(999
permutations)(Ter
Braak,
1987).Poorly
represented species(occurring
only in
three
or
less samples andtotal
density below5
fishesper
100m';
were removedfrom
this analysis.
For
each sampling site,total
fish
species-richness(i.e.
TR,the
numberof
fish
species
in
each sample), introduced species-richness (IR), native species-richness (NrR),species diversity (É/, Shannon-Wiener Index) and density
of
introduced individuals(DI)
were
determined.
The
captured
specieswere classified
according
to
its
habitatrequirements
(rheophilic,
DRheo;
eurytopic,
DEury; limnophilic,
Dlimno)
and
itsfophic
ecology (invertivorous,Dlnve;
piscivorous; omnivorous,DOmn)
(Michel
andOberdorff,
1995; Welcornme et a1.,2006; Kottelat&
Freyhof, 2007), and the densityof
theseguilds
in
each samplewas
determined. Becausethe
piscivorous
species werepoorly
representedin
our
samples(only
large-mouth
bass,Micropterus
salmoidesLacepêde,
1802)
its
density
was very
low
and this guild was
excluded
from
the statistical analysis.Several studies describe
the
distance
from the
source
as
a
key
factor
ondetermining
the
fish
assemblages'structure
in
lotic
environments,being
specially relatedwith the
species-richness(i.e.
Angermeier&
Schlosser, 1989;Gillette et
al.,2005; Poulet, 2OO7). Thus,
for
both studied steams, the relationshipof
the compositionand structural metrics
(TR,
NR, IR,DI
andII)
and guilds densitywith
distance from thesource was investigated using Pearson
or
Spearman correlations, whether the data wereparametic
or
not
(SPSS l2.O).
If
this
was significant (P<0.05),
an
analysis
of
covariance
(ANCOVA)
was performedin
orderto
testthe
differencesin
metrics andguilds
structure between thetwo
streams and between the groupsof
siteswithin
eachstream.
This
method, performedwith
the program BIOMstat
for
Windows
(Version3.0), allows
to
adjust the valuesof
the related metrics and guilds (dependent variables) so that one can estimate the mean and variance thatwould
have been obtainedif
thedistance
from
the
source (covariate) hadnot
variedwithin a
sample (Sokal&
Rohlf,1981).
If
the
correlation was
not
significant,
a
one-factor analysis
of
variance(ANOVA),
followed
by
a post-hoc Gabriel testfor multiple
comparisons,or
in
caseof
non parametric data a
Kruskall-Wallis
testwith
a
Simultaneous Test Procedure (STP)(Siegel
&
Castellan, 1988)for multiple
comparisons,were
conductedwith
the
sameobjective. These ar'talyses were performed using SPSS 12.0.
RESULTS
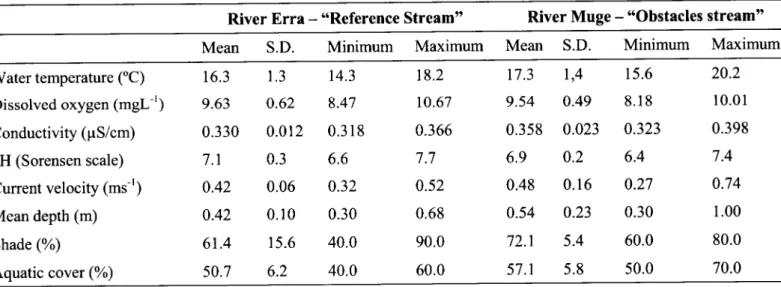
Abiotic
characterizatron
During
the
sampling period,
physicochemical
parameters,such
as
watertemperature, dissolved oxygen, conductivity and pH, showed
little
variation between thetwo
studiedrivers
and among sampling siteswithin
eachriver
(Table
1). On the otherhand,
environmental features
directly
related
with
stream morphology
andhydrodynamics,
such
as
current
velocity and
mean depth,
and
with
biophysiccharacteristics,
like
shade and aquatic cover, exhibited some variation between the twowatercourses
and
sampling
sites
within
(Table
1).
Substrate
was
reasonablyhomogeneous throughout the
two
studied reaches, beingmainly
composed of sand.Table 1. Abiotic and biophysic characteristics of the studied area on both streams
River Erra
-
"Reference Stream" River Muge-
"Obstacles stream"Mean S.D.
Minimum Maximum
Mean
s.D.
Minimum
MaximumWater temperature (oC)
Dissolved oxygen
(-gL-')
Conductivity (pS/cm) pH (Sorensen scale) Current velocity(.t-')
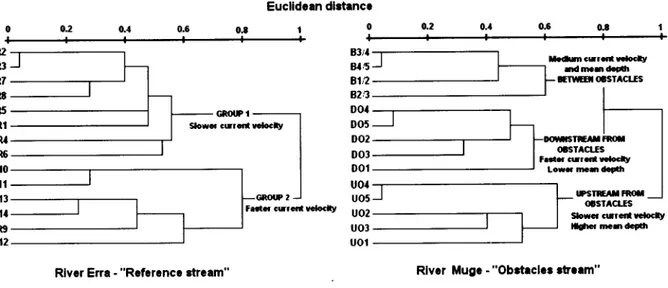
Mean depth (m) Shade (%) Aquatic cover (%) t6.3 9.63 0.330 7.1 0.42 0.42 61.4 50.7 1.3 0.62 0.012 0.3 0.06 0.10 15.6 6.2 t4.3 8.47 0.3 18 6.6 0.32 0.30 40.0 40.0 t8.2 t0.67 0.366 7.7 0.52 0.68 90.0 60.0 17.3 9.54 0.358 6.9 0.48 0.54 72.1 57.1 1,4 0.49 0.023 0.2 0.16 0.23 5.4 5.8 15.6 8.18 0.323 6.4 0.27 0.30 60.0 50.0 20.2 10.01 0.398 7.4 0.74 1.00 80.0 70.0 S.D. - Standard Deviation.Hierarchical clustering
of
the
14
sitesof
the
reference streamidentified
twogroups
of
sites (Figure2). Group
1 included eight sampled sites (R1-R8), locatedin
adownstream area
of
theriver,
and Group2
included the upstream remainingsix
sites(R9-Rl4). The
discriminant function
analysis
(DFA)
conducted
for
this
streamidentified
currentvelocity (within-group
correlationwith
theDFA
function:
-0.53) asthe environmental gradient
significantly
separating thetwo
groups(Wilks
À:
O.tl,
F:
44.820,P <0.001). Cross-validation (leave-one-out method) procedure revealed that theDFA
correctly predicted the statusof
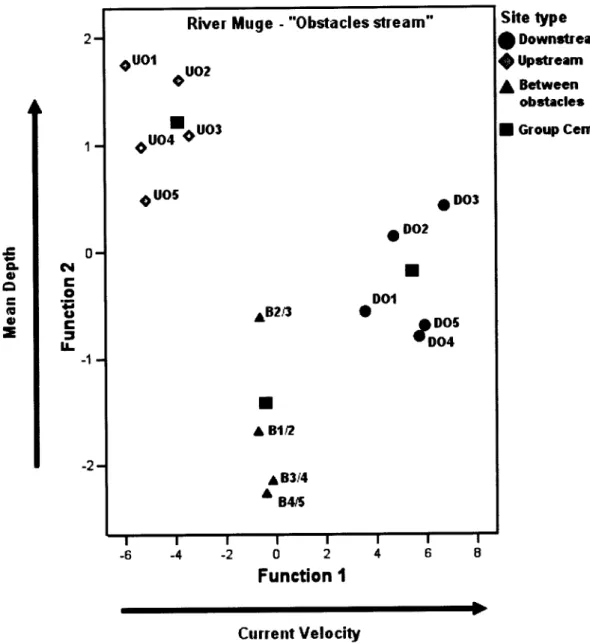
100% of the cases.The hierarchical classification
of
the sampled siteswithin
the
obstacles streamidentified
three groups (downstreamfrom
obstacles-
DO,
upstreamfrom
obstacles-UO
and
betweenthe
obstacles-
B),
clearly
separated accordingto
their
positionrelatively
to
the
obstacles(Figure
2). DFA
conductedfor
the
threesite
typesof
thisstream revealed
a
gradientof
currentvelocity (within-group
correlationwith
the first
DFA
function:
0.99) that separatesDO
andB
sites,with
faster current,from
the UOsites
with
slower current (Figure 3). The second discriminant axis ofDFA
separated UOsites
with
higher mean depth(within-group
correlationwith
the secondDFA
function:
0.91) from
DO
andB
siteswith
lower depth. TheDFA
procedure washighly
significant(Wilks
)'":
0.21,F
:
29.733,P
<0.001) and correctly predicted the statusof
100%of
the cases. o.2 0 o.2 0.4 0.6 0.t 0.4 0.ô GN(XP I Euclldcan dlrtencr
to
GROIP 2 Íaír c[Ící t êlcly 0.4 kúm c!Íãta urlc.lt/ BStl 8t,5 81n a2n oot D05 DO2 003 DOÍ u0{ u05 u02 u03 uol P2 R3 R7 R8 R5 R1 M R6 Rt0 Rtt R13 RÍI R9 RÍ2 (f,sÍACt.Es ;aáüilÍaíltfftt Low{mrúaÉ Ídm0d.dr ETTE(ESTACIIS IPSIII^IÍ*fl otsÍActts SoÊã Glrrcíl rcloclt/ ,líhq mÍdcíarrRlvcr Erra - "Rcfcrcncc atrêam" Rlvcr Mugc - "Obcteclor .E.lm"
Figure
2. Hierarchical classificationof
sampled sites on both studied rivers, based on theirabiotic and biophysic characteristics.
12
River Muge - "Obstacles
stÍeam"
ouoí
ouos
a
Dol uo2o
uo3ô
DO2o
DOío
LBzBI
uo4
0
,rlT
tB3i4
^
g+trI
LB1Iz 2 a Site§pe
I
Downúrcrm$up*rcem
I
Betweenobrtrcler
I
Croup Centroidê
oê
c, o -0N
tro
,lau
E=
IL-6
-4
-202
Function
í
6B
4 CurrentVeloci§l
Figure 3. Sampling sites scores (by site type) on the two discriminant function (DFA) axes for River Muge
-
"Obstacles stream".When
considering
all
the
sampled
sites
of
both
streams,the
hierarchicalclustering
identified
two major
groups, assemblingDO
andB
sitesof
the
obstaclesstream
with
Group2 of
the
reference stream andUO
siteswith
Group 1
(Figure 4).DFA
conductedfor
all
the
sampledsites
identified
current
velocity
(within-groupcorrelation
with
the
DFA
function
:
0.81) as
the
main
environmental
gradientsignificantly
separating thetwo
groups(Wilks
l,
:
0. I 8,F
:
77.l8l
,P
<0.001).Cross-validation
procedure revealed thatthis
DFA
correctly predictedthe
statusof
100%of
the cases.0 o.2 Euclldcan dlstancc 0.4 0.6 0.8 I DOWT{STREAIÚ AT{D BETWEEN OBSTACLES + GROUP 2 OF REFERENCE STREAlÚ F.ící crÍÍcrt rclocly UPSTREAIí FROIÚ OBSTACTES + GROUP
I
OF REFEREI{CESTREAl{ SIowCÍ CtrÍCíI UCI,OCIIy
Figure 4. Hierarchical classification of all sampled sites on both rivers, based on their abiotic
and biophysical characteristics.
Fish-species
composition
andenvironmental relationships
A
totalof
11 fish-species were sampled (Table 2). Theirmajority
were capturedon
both
streams,
except
large-mouth
bass
and
roach (Iberocypris
alburnoides Steindachner, 1866)that
were
only
presentin
the
obstacles stream.Among the
11species,
four
were classif,red as introducedQ6.a%).
ln
termsof
ecology, 27 .3yoof
thespecies sampled were rheophilic, the same proportion eurytopic and
455% limnophilic
(most
of
them introduced). Concerningtheir
feeding habits, mostof
the
species wereomnivorous
(45.5%o),36.4% were
invertivorous
and
only
one was
classified
as Rt3 DO3 83tl B,1t5 D05 Rí1 DOI R10 B.2R Btn DO2 Rí2 DOl I R7 R3 RE uot RT R5 RI u02 R2 uo3 u05 R6 14piscivorous. Due to the reasons described in the methodology section, mosquitofish and
the specimens of the genera Lampetra were not considered
in
thefollowing
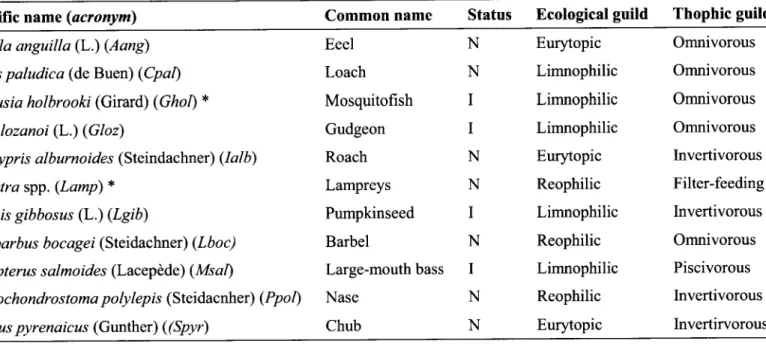
analyses.Table 2. Status, ecological and trophic guilds of the fish-species sampled
S cientiÍic name (acr o ny m) Common
name
Status
Ecologicalguild
Thophic guitdAnguilla anguilla (L.) (Aang)
Cobitis paludica (de Buen) (Cpat)
Gambusia holbrooki (Girard) (Ghol) * Gobio lozanoi (L.) (Gloz)
Iberocypris alburnoides (Steindachn er) (Ial b)
Lampetra spp. (Lamp) *
Lepomis gibbosus (L.) (Lgib)
Luciobarbus bocagei (Steidachner\ (Lboc)
Micropterus s almoides (Lacepêde) (Ms al)
P s eudo chondro s toma po ly lep is (Steidacnhe r) (P po l)
Squalius pyrenaicus (Gunther) ((Spyr)
Eeel
NLoach
NMosquitofish
I
Gudgeon
I
Roach
NLampreys
NPumpkinseed
I
Barbel
N Large-mouthbass
I
Nase
NChub
N Eurytopic Limnophilic Limnophilic Limnophilic Eurytopic Reophilic Limnophilic Reophilic Limnophilic Reophilic Eurytopic Omnivorous Omnivorous Omnivorous Omnivorous Invertivorous Filter-feeding Invertivorous Omnivorous Piscivorous Invertivorous Invertirvorous N-
Native, I-
Introduced.*
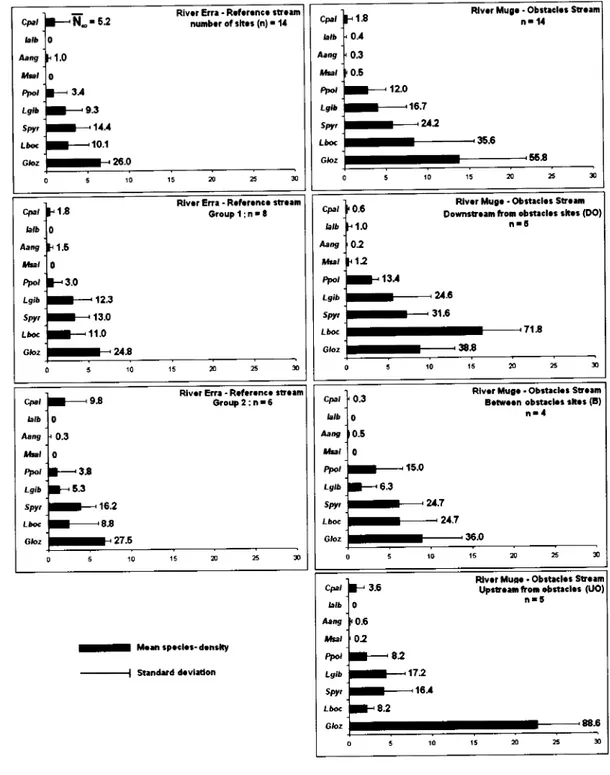
These species were removed from the analyses due to the reasons described on the methodology section.Overall,
the
studied
rivers
presentedstatistically similar
fish
assemblages,dominated
by
cyprinid
species,with
gudgeon, barbel and chubexhibiting
the highestvalues of mean density (Figure 5). The rarest species
in
these watercourses were roach,eel and large-mouth bass. Regardless
of
the abiotic distinction
observed between thetwo
groupsof
siteswithin
the
reference stream,their
fish-species composition wasstatistically
similar
and independentfrom
the sample group (P >0.05), so the referencesffeam was always compared as a whole. Despite of the independence test results (Table
3), the separated analysis
of
the three site typesof
the obstacles stream was maintainedbecause
this
was the treatment stream.In
the
sites sampled immediately downstreamfrom
the obstacles(DO),
the highest valuesof
mean density were exhibitedby
barbel(dominating species), gudgeon and chub.
The
fish-species proportionsin
this type
of
sites did not differed significantly from the ones in the reference stream (Table 3). In the
same way, sampling sites located between the studied obstacles
(B)
were characterizedby
a high
density
of
the
samethree most
abundant species,but without the
cleardominance
of
noneof
them.The
G-tests revealed nonsignificant
differences betweenthe fish
composition
of B
sitesand
the
onesfrom DO
sites and
reference stream.Gudgeon, an introduced species, exhibited the highest mean density value
in
the siteslocated immediately upstream
from
the obstacles(UO),
clearly being the predominantspecies
in
this type
of
sites. Species that were abundantin
other locations, barbel andchub,
presentedlow
values
of
density,both being
surpassedby
another introducedspecies, i.e., pumpkinseed. Contrarily to what was being observed among the other site
types and
whole
streams,the
fish
species compositionof
UO
siteswas
significantlydifferent from
theDO
andB
sitesin
River
Muge andfrom
the reference stream. Thesignificance
of
this
differences was higher between the siteswithin
the sameriver
(P<0.001) than the one observed against the whole reference stream (P <0.05).
Cpr, btb Àeig Usl tu, LClb sw. Là@ Glp.z -N-' s.z nunb.? oí sh.t (n) . 14 0 't.0 0 3,1 9.3 11,1 26.0 0 5 10 m s
í3 RlY.Í Mug. - Obrt.cl.3 Sú..m
cPa, larô Àaag ,t*ál fut Lglb sw, Lôoc G/pz n. íl 0.4 0.3 0.6 12.0 16.7 u2 36.6 563 0 5 r0 15 x T Cp, hlb Aang *bt foo, Lgib SW Lôo. Gbz 13 Crouplinrt 1.6 0 3.0 12.3 13.0 í 1.0 u3 5 10 15 n ã +.
ê
E"=
TE(,
o
.g
(,
o
o.
o
I ?.2
IL
- Mrsip.cl.s-d.nilty St.ndüd d.vl.donFish
species denslty
(no
of fishes/í00 m;
mean + s.d.)
Figure 5. Fish-species density (n" of fishes/l00 m'; mean + s.d.) and mean estimated N* values
for each species sampled in the studied streams and groups of sites within.
cpa, blb Aary *b, w, Lgib spt, LàG Gloz 0.2 12 0.6 ío
Rlv.Í Mue. - Obst.cl.r Sú.il
Oom3t.am trom obÍ.c|.. 5h.3 (DO)
n'6 í3J us 31.6 71'8 384 5 r0 n É
Rlval EÍÍr - RaíaÍ.ncr súalm
cpa, b,b Àdlg *bt Ao, Lgih spyr Lôoc Gtoz 93 GÍoup 2 ; n.6 0 0.3 0 33 5.3 16.2 8.8 27.5 0 5 í0 15 r ã crÉl b,b Àaog *bt fut Lgib sür fà@ Gloz 0.3 0 r0.6 Rlv.t Mug. - Obí.clr3 Sú.lm B.tr..n obttrcl.3 rh.r (l) n'l 0 15.0 6.3 u:l 24.7 36.0 0 5 m cpt, ,arb Àar,g t&Et wt Lslb sPy, Lô@ Gloz
3.6 Fuvar Up3t.il ítor cbí:clor ttlu§. - ObitacLr St alm(UOl
nr6 0 0.6 o2 82 17.2 í6r 8.2 88.6 5 10 l5 Ã 3 t7 0 0 0 x)
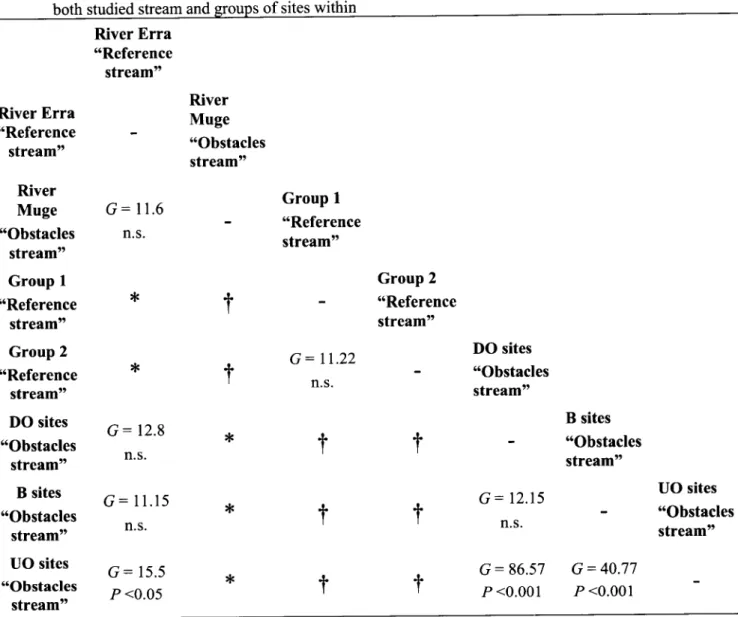
Table 3. Results
of
G-
tests of independence on the fish-species composition (mean estimatedN-
values)of
both studied stream and grouPs of sites within
River
Erra
ttReference stream" RiverErra
"Reference stream" River Muge "Obstacles stream" GroupI
"Reference stream" Group 2 "Reference stream" DO sites "Obstacles stream" B sites "Obstacles stream" UO sites "Obstacles stream" River Muge "Obstacles stream"G:
lt.6
n.s.G:
12.8 n.sG:11.15
n.s.G:
15.5 P <0.05 GroupI
"Reference streamttG:11.22
n.s Group 2 "Reference stream"*
t
t
t
,rt
t
t
t
DO sites "Obstacles stream"G:
12.15 n.s.G:86.57
P <0.001 B sites "Obstacles streamtt G = 40.77 P <0.001 UO sites "Obstacles stream" ,(t
t
*
*
G.oup, of sites were not tested against the rivers they are within it'f
Fi.h-.p""ies composition of Group 1 and Group 2 (Reference stream) was statistically independentof
the sample (P >0.05), so the River Erra was compared in its whole.The
Canonical Correspondence Analyses(CCA)
showedthat the
fish-speciesassemblages
of
the
studied
rivers
were differently
structured,
regarding
their relationshipswith
the environmental features (Figure6).
In
the reference stream CCA,of
the nine abiotic and biophysic variablesinitially
considered (variablesfrom Table
1plus
Distancefrom the
source)only
six
were retainedfor
the
analysisby
the forward selection procedure(Table
4). The first two
axis
of
this CCA
ordination
explained39.9% of the fish assemblage spatial
variability
and78.5Yoof
the relation betweenfish-species
density
and
the
selected environmental
variables.
The
high
correlationcoefficients between species and environmental variables, obtained for the first
two
axes(0.82 and 0.73 respectively), suggest that environmental variables explain the
variability
associated
with
fish-species density. Thehigh
correlationof
aquatic cover and shadewith
the
first
canonicalaxis, and
currentvelocity
and mean depthwith
the
secondcanonical
axis, identified the main
environmental gradients
for
each
axis
in
thereference stream (Table 4). The global permutation test
(F-ratio
:
3.00) showed that thefirst
canonical axis was statistical signific ant (P <0.05). The test based on the sumof all
canonical eigenvalues led
to
an F'-ratioof
2.88, demonstrating that the relation betweenfish-species density and environmental variables was also
significant
(P
<0.05). ThisCCA
ordination separated the sampled sitesin two
main groups,in
a similar way to therespective
hierarchical
clustering. Sites locatedin
the
downstream areaof
the
studyreach (R1-R8) were characterized
by
higher mean depth, shade and aquatic cover, andwere mostly differentiated
by
an elevated densityof
pumpkinseed. On the other sideof
the horizontal axis
(Axis
II),
the sites located upstreamin
the sampling reach (R9-R10)were
mainly
representedby
native specieslike
nase and chub, and were associatedto
afaster current velocity. The most abundant species, barbel and gudgeon, were not clearly
associated to any of the resulting groups, being common throughout the sampled reach.
In the obstacles stream CCA, the same six environmental variables were retained
by
the
selection procedure (Table4).
The
first two
axis
explained 48.7o/oof
the
fishassemblage spatial
variability
and 78.lo/oof
the
relation between fish-species densityand the selected environmental variables.
The
first two
axes obtainedhigh
correlationvalues
of
0.97 and 0.69, respectively. Mean depth, currentvelocity
and shade exhibitedhigh
correlationswith
thevertical axis
(Axis I),
representing themain
environmentalgradients structuring
the
fish
assemblagesin
the
obstacles stream.All
canonical axes were statistical significant(F-ratio:2.42,
P
<0.05). Thevertical
axis clearly separatesthe
sampling sitesof
this
streamin
two
opposite groups, accordingto
its
locationrelatively
to
the
obstacles. TheUO
sites were grouped and characteizedby
a highermean depth and slower current
velocity.
The fish-species associated to this typeof
siteswere
the
pumpkinseed, gudgeonand loach.
The DO
and
B
siteswere
representedtogether,
exhibiting
faster current velocities, shallower habitats and a higher percentageof
shade, where specieslike
barbel, chub and nase were more abundant.ú?
q
Prl Rla clmGlÍYE-oclÍY Ppt RÍ3 cPt R10 sptl R12 R9 Glo, R8 R2 A.IJ IE RI 8flr solJicE R5 R6 RN'ER ERRA .REFERE'{CE STREAT' ^aq Á4 Uq uo5 oo5 OGSOLYED OTYGO' l03 &'5 Lqb tEnt sptl B2',l uol Bl4 uo2 YIL@IÍY IÃJATE rc2 rc1 FRC 8d'ICE cFt RNER TUGE .OBSTACLESSTREAT-o
x
o
x
q
(\
Iq
§l I -1.5 AXrS r1.5
-1.0 AXIS ! 2.5Figure 6. Canonical correspondence analysis (CCA) biplot for fish-species and environmental
variables (with indication
of
samples) assessed for both studied rivers. Environmentalvariables are represented
by
aÍrows thatpoint
towards the directionof
maximumvariation.
Table 4. Results
of
the ordinationby
CCAof
fish-species density data: eigenvalues,species-environment correlation coefficients, and intraset correlation of environmental variables
with the first two canonical axes
River Erra
-
"ReferenceStream"
River Muge-
"Obstacles Stream"Axis
I
l,
= 0.10 AxisII
À:
o.os AxisI
l,
= 0.06 AxisII
À:0.02
Species-environment Aquatic cover Current velocity Dissolved oxygenDistance from source
Mean depth Shade 0.82 -0.58 -0.10 -0.10 0.16 0.15 -0.53 0.73 -0.26 0.62 -0.21 -0.40 -0.54 -0.35 0.97 0.15 -0.60 -0.33 0.40 0.88 -0.62 0.68 -0.37 -0.31 0.33 -0.43 0.2t 0.05 20
Community structure
On the
studied
streams,of
all
the metrics and guilds
analysed,only
TR ("Reference stream": Pearsonr
:
0.32,P<0.05;
"Obstacles stream": Pearsonr
:
0.41,
P<0.05)
and NrR ("Reference stream": Pearsonr
:0.54,
P<0.05;
"Obstacles stream":Pearson
r
:0.44,
P<0.05)
weresignificantly
relatedwith
distancefrom
the source, soan
ANCOVA
was applied to these variables.From the studied metrics and guilds, only
NÀ
andIR
weresignificantly
differentbetween the
two
streamsin
its whole
(Table 5),with
the obstacles streamexhibiting
ahigher number
of
introduced species and, consequently, a lower native richness than thereference
stream (Figure
7).
None
of
the
variables tested presented
significant differences betweenthe
two
groupsof
siteswithin
the reference stream, sothis river
was always compared as a whole.
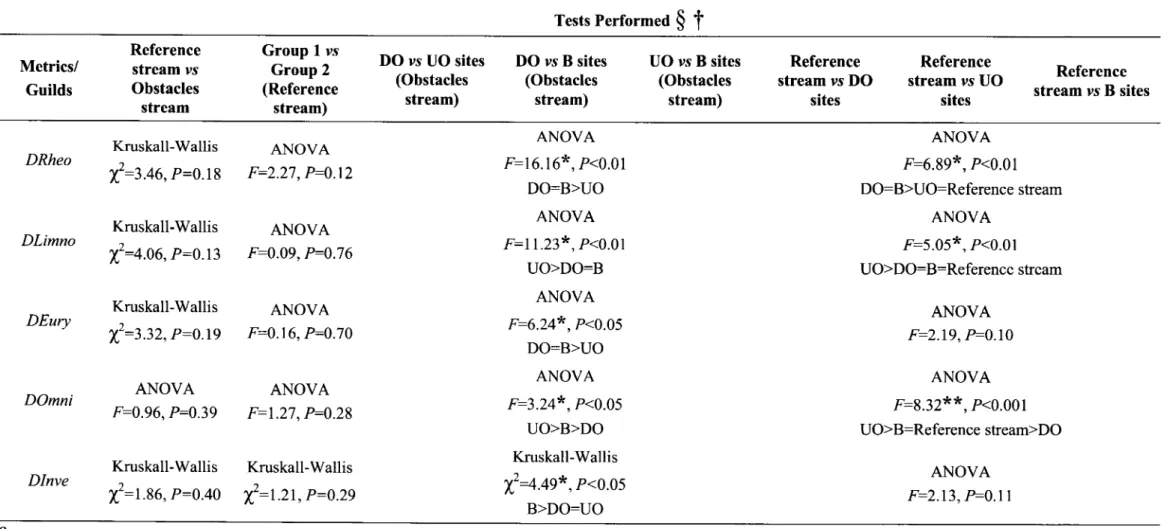
Within
the
obstacles stream,H,
DI
andall
the
ecological andtrophic
guildspresented
significant
differences betweenthe three site types (Table
5).
DRheo
andDEury
weresimilar
betweenDO
andB
sitesbut
higher thanin UO
sites.DI,
DOmni
and
Dlimno
exhibited an inverse pattern,exhibiting
higher values atUO
sites (Figure7).
Species-diversity(II)
wassignificantly higher
in B
sites thanin
UO
andDO,
a patternsimilar
to
the one
observedfor Dlnve.
In
the
obstacles stream,none
of
therichness metrics was significantly different among site types.
When testing
the
three site types
of
the
obstacles stream againstthe
wholereference reach, the richness metrics
did not
exhibited signif,rcant differences,with
theexception
of
1Àthat
was constantlyhigher
in all
site typesof
the impounded stream(Figure
7).In
the reference stream, É1wassimilar
to the values observedin B
sites andhigher than
in UO
and DO.DI, DLimno
andDOmni
weresignificantly
higherin
UOsites
with
the reference streamexhibiting lower
values,similar
to the ones observedin
DO
and
B
sites.DRheo
was significantly lower
in
UO
and
reference sites, whencompared
to DO
andB
(Table 5).
DEury
andDlnve
werenot
significantly
differentbetween the three site types
of
the obstacles stream and the whole reference stream.Trbl€
5. Results fiomúe
statistical aÍâlyses applied to test the difrerences itr composition and stnrctual metrics aod guilds density betweetr the two streams âtd groups of siteswiúin
Tests PerformeO§
t
Metrics/ Guilds Reference stream vs Obstacles stream Group 1 us Group 2 (Reference stream) DO vs UO sites (Obstacles stream) DO ys B sites (Obstacles stream) UO vs B sites (Obstacles stream) Reference stream vs DO sites Reference stream vs UO sites Reference stream ys B sites TR NR ANCOVA Intercepts F:0.93, P:0.35 Slopes F:0.01, P:0.91 ANCOVA Intercepts F=18.31*, P<0.05 SlopesF:|.02,
P:0.32
ANCOVA Intercepts F:0.26, P=0.62 SlopesF:|.23,
P:0.29
ANCOVA Intercepts F:0.05,P:0.82
Slopes F:0.54, P:0.48 ANCOVA Intercepts F:0.24,P:0.64
Slopes F:0.1l,
P:0.75 ANCOVA Intercepts F:0.20, P=0.68 SlopesF:|.20,
P:0.32
ANCOVA Intercepts F=\.19, P:0.32 Slopes F:0.18,P:0.69
ANCOVA Intercepts F:0.57, P=0.48 SlopesF:|.69,
P:0.25 ANCOVA Intercepts F=0.88, P=0.39 Slopes F:0.05,P:0.84
ANCOVA Intercepts F:0.73, P:0.43 Slopes F:0.69, P:0.45 ANCOVA Intercepts F:0.76,P:0.36
Slopes F:0.48,P:0.59
ANCOVA Intercepts F:5.35, P<0.05 Slopes F:0.00,P:0.96
ANCOVA Intercepts F:1.01, P=0.38 Slopes F:0.26,P:0.62
ANCOVA Intercepts F:10.75, P<0.05 SlopesF:l.65,
P:0.22
ANCOVA Intercepts F:0.99, P:0.35 Slopes F:0.21,P:0.62
ANCOVA Intercepts F:11.45, P<0.05 Slopes F:2.54, P:0.13 IRH
ANOVA
Kruskall-WallisF:38.37*,P<o.ol
t':O.Ot, P:0.52
Kruskall-Wallist':z.ot,
P:0.14
Kruskall-Wallist':zse,
P:0.34
ANOVA F:4.64, P:0.06 ANOVA F:0.45, P:0.51 Kruskall-Wallisf=|.97,
P:0.72 Kruskall-Wallist':s.tz*,P<0.05
B>DO:UO ANOVA F:10.63*, P<0.01 UO>DO:B Kruskall-Wallist':zr.sz*,P<o.oo1
DO:UO:B
>Reference streamKruskall-Wallis
t':tt.ls*,P<o.ol
B:Reference stream>Do:Uo ANOVAF:6.09*,P<0.01
UO>DO:B:Reference streamDI
§
Groups ofsites were not tested against the rivers they are within it.t
Menics aod guilds were always statistically similar (P >0.05) betweeo Group 1 and Group 2 (Refêrence stream), so the River Elra was compaÍ€d as a v/hole.*
Significant;**
Highly significânt.Table 5 (coÍt,). Results ftom the statistical analyses applied to test the differences in composition metrics ând guilds density between the two stÍ€ams aÍld groups of sites withitr Tests PerformeO
§
t
Metrics/ Guilds Reference stream ys Obstacles stream GroupI
vs Group 2 (Reference stream) DO vs UO sites (Obstacles stream) DO vs B sites (Obstacles stream) UO vs B sites (Obstacles stream) Reference stream vs DO sites Reference stream vs UO sites Reference stream ys B sites DRheo DLimno DEury DOmni DInve Kruskall-Wallis t'--2.+a,P=0.18 Kruskall-Wallist':+.oa,P:o.13
Kruskall-Wallist':z.zz,
P:0.19
ANOVA F:0.96,F0.39
ANOVA F:2.27, P=0.12 ANOVA F:0.09, P:0.76 ANOVA F:0.16, P:0.70 ANOVA F:1.27, P:0.28 ANOVAF:l6.l6x,P<0.01
DO:B>UO ANOVA F:L1.23*,P<0.01 UO>DO:B ANOVA F:6.24*,P<0.05 DO:B>UO ANOVA F:3.24*,P<0.05 UO>B>DO Kruskall-Wallis TJ=4.49*,P<0.05 B>DO:UOKruskall-Wallis
Kruskall-Wallist':t.ae,
P:0.40 t':t.zt,
p:0.2s
ANOVA F:6.89*,P<0.01 DO:B>UO:Reference stream ANOVAI':5.05*,
P<0.01 UO>DO:B:Reference stream ANOVA F:2.19, P:0.10 ANOVAF:8.32**
,P<0.001 UO>B=Reference stream>DO ANOVA F=2.13,,F0.l
I§
Groups of sites were not tested against tlrc dvel§ they are within it.t
Metrics ând guilds were alwâys stâtistically similiar (P >0.05) betweeo GroupI
atrd croüp 2 (Reference stresm), so theRivo
Erra was compared as a whole.*
SigÃificant;**
Highly significant.srrEs
SAMPLED (OBSTACLES STREAM)
DOI'I'NSTREAM
DOI lX)í aíI DO2 lro2 t2it OOI rc! Atrl DOa rcl Bl'5 OOI t 05
1a
TOTAL SPECIESXICHNESS OR)
ã
I
i
E!
I r. ! { I I 2 IR7 N' D RI' RII Rí2 RIt Rí4
DOt toí ttll rcz rc2 t2r, Do, lro! !3ia ooa lba aG m5 uo5
ía II{TROOUCCO SPECIES*ICHNESS ín,
I
.tl
tt
! t 6 4 2 }I I + !+ a I t ! t T' I a HPBR{EFR7Mmí rct 8íl2 00? m2 42,! m, uo3 Dt4 Doa w o{6 Do' rct ta
a
,a
n
to
DENSTTY OF IIfTROOUCED SPECIES íO"
I ! a f
{
t I a XI P B R' R5 R' R' S P Rí' Tíí M2 RII Rí' _34 Tlr
I
!r
EÍ.
l'.
l!.
m! El 3te rc2 rc2 f2r! rct u lr4 rca u ls rct rc5DEllslw oF LlÍlNoPHlLlc sPEclES íDLrmm,
a +. t{ I I ,_! I I a I RI T2 RI R4 E R' H RI 6 Rí' Ríí Tí? RTI Rí' UPSTREAM
DOI rcl 8í2 DO2 m2 t2)! DOt rc! ltra OOa toa tG m5 ÚOt Í0
ilATtVE SPECIES{lCHl{ESS íin,
É a
i
E'
t It
-a !t I IT t+{ 2 a Rt R2 B R{ R5 R' X7 RI R' Ri' Ríí RI Rt' RI'm uoí tlz rc, uo2 ll/t Dot to, lr/a Do4 lro4 l{1, Do5 1rc5
^ 2,X
-
SPECtESJTVERSTTí ír0 í,60 !t I T I I I í.o a.s a.x Rí M R! R' S R3 R7 M P R[MíRí2Rí'RI4 DOí rct aí2 DO? m2 32'! DOt lht Atra m4 uoa 816 m5 rc5í
a ta
2a
la
DEllslTY oF RHEOPlllLlc sPEclES íDRh@,
I
]
! a Rí P B R' E M R7 B M RI'RIIRI2Ii'RI' 5a E!r
I!r.
e1,.
I
{,.
l!o
Doí @l 8í, m2 rc2 42,! m, rc, Alí m4 rca Aa6 m5 @g
DE}ISITY OF EURYTOPIC sPÉcIÉS (DEUTYI
{
Rí e2 it Rt R5 n3 R7 r, B ma mí Rí2 Rí' tla - s mí rcl 812 m2 m2 t2l! Dot m! tr/{ rc{ m{ }16 Do5 rc5 x ta 2a ía aDEtaslTY oF lXVERTrvoRous sPEclES íOrnv.,
I I I !
a RíPBR4NSSn7BR'
DOVI'NSTREAM UPSTREAM
SITES SAMPLED (REFERENCE STREAM)
Figure 7. Variation of community structural metrics (TR, NR, IR,
H
andDI)
and guilds density(rheophilic, limnophilic, eurytopic, omnivorous and invertivorous species)
on
bothstudied rivers: River Erra
-
"Referencestream"
I-
;
River Muge-
"Obstaclesg11gnp"
*
í
TI'
Ir
Cl.
Í'
!r
DEilsrrY oF oll{|VORoUs SPECIɧ@omni)
a a I I a I
?4-,
,,n* T I I I I I a a I I E ü I ã § E T ÊI
I
C I ã T!
t
i
I Iooí lrol tta Do2 rcr l2it oot txr! tl4 Dol lroa a,ü5 Dot rct
Rí N2 Rt R4 E R' RT B R' Rí' RIí H2 RT' Rí' I
I a