The transition trend from Pay-TV to Streaming
Platforms:
The influence of Decision-making-power and
Age on consumers’ motivations.
João Elias
Dissertation written under the supervision of Professor Nuno
Crispim
Dissertation submitted in partial fulfilment of requirements for the
MSc in Management with Specialization in Strategic Marketing, at the
1
ABSTRACT
Dissertation title: From Pay-TV to Streaming Platforms: The influence of
Decision-making-power and Age on consumers’ motivations
Author: João Maria Bernardino Mira Mendes Elias
Keywords: Pay-TV, Streaming Platforms, Transition, Age, Decision-making, Power,
Cord-cutter.
The purpose of this project is to explore and analyse the transition trend of content consumption from pay-TV to Streaming Platforms, by examining the influence of the factors Decision-making-power and Age of consumers on their motivations (eg. Price, Convenience). The consumer’s motivations were established from information gathered in the Literature Review, and were used throughout the research.
The study is exploratory as well as quantitative, which included data collection through two focus groups with a total of 15 participants, and an online survey with 184 respondents. The results show that the factors Age and Decision-making power influence some of the consumer’s motivations, and there is clear evidence that respondents are watching content for more hours on Streaming Platforms than on pay-TV channels and that they recognize the platform as less expensive, more convenient and more entertaining than pay-TV channels. Since there is, in fact, influence from the factors Age and Decision-making power, pay-TV-channel companies must create different strategies for consumers in different situations and age groups, in order to protect their businesses in the future. Furthermore, this study would be more complete and enlightening if, using a similar model, researchers explore each motivation deeper. Moreover, determining which motivations are the most important should be accessed after a quantitative research and not from information gathered on the Literature Review.
2
RESUMO
Título da tese: From Pay-TV to Streaming Platforms: The influence of
Decision-making-power and Age on consumers’ motivations
Autor: João Maria Bernardino Mira Mendes Elias
Palavras-chave: Pay-TV, Plataformas de Streaming, Transição, Idade, Tomada de Decisão,
Cord-cutter.
O objetivo deste projeto é explorar e analisar a tendência de transição de consumo de conteúdo, dos canais de televisão paga para as plataformas de Streaming, através da análise dos fatores Poder de Decisão e Idade e a sua influência nas motivações do consumidor. As motivações do consumidor foram estabelecidas a partir de informação recolhida na Literature Review, e foram usadas em toda a pesquisa.
Este estudo é exploratório e quantitativo, e incluiu recolha de dados através de dois Focus Groups com um total de 15 participantes, e um Survey Online com 184 participantes.
Os resultados mostram que os fatores Idade e Poder de Decisão influenciam algumas motivações dos consumidores, havendo provas claras de que os participantes veem conteúdo por mais horas nas plataformas de Streaming do que nos canais de Televisão, e de que reconhecem a plataforma menos dispendiosa, mais conveniente e melhor provedora de entretenimento do que os canais de Televisão. Tendo em conta que há, de facto, influência dos fatores Idade e Poder de Decisão, as empresas de canais de Televisão terão de criar estratégias diferentes para os consumidores em situações de vida diferentes e em grupos etários diferentes, se quiserem proteger os seus negócios no futuro.
Este estudo seria mais completo e mais esclarecedor se, usando um modelo similar, os pesquisadores pudessem explorar cada motivação mais detalhadamente. Mais, as mesmas motivações poderão ser mais fiáveis se forem criadas através de uma pesquisa quantitativa prévia e não através da Literature Review.
3
AKNOWLEDGEMENTS
This project was, without a doubt, the most challenging thing I have ever done in my life. In the end, the hours and the persistence that it took to finish it make me feel proud.
I thought about quitting many times and it is to the people that prevented me from doing so that I would like to thank.
To my parents, Maria and Alexandre, I would like to thank for the unconditional support, motivation and love.
To my brothers, Alexandre, Leonor, Marta, Barbara, Pedro and Antonio for the advice and support.
To Professor Nuno Crispim for the orientation.
To my friends Adriana Soares, Afonso Faro, Alberto Ramos, Filipa Basto, Francisco Bettencourt, Gonçalo Empis, Gonçalo Campos, João Caiado, João Lucena, Jorge Vieira and Salvador Canto Moniz, for the support and kind words.
To Marina Beirão da Veiga, for all the things she taught me and for giving me many hours of her time.
4
LIST OF FIGURES
Figure 1 - Number of Netflix subscribers vs cable pay-TV subscribers in the U.S (in millions) Figure 2 - SVOD subscriber forecasts by platform
Figure 3 - Growth in the number of Netflix subscribers in the U.S by age
Figure 4 - How often were consumers watching content on SVOD services in 2017 compared
with 2016
5
LIST OF TABLES
Table 1. Survey sample representation ... 49
Table 2. Descriptives and independent t test - Price ... 49
Table 3. Descriptives and paired t test – Price ... 50
Table 4. Descriptives and independent t test - Convenience ... 50
Table 5. Descriptives and one-sample t test - Convenience ... 50
Table 6. Descriptives and independent t test - Advertising ... 51
Table 7. Descriptives and one-sample t test – Advertising ... 51
Table 8. Descriptives and independent t test - Satisfaction ... 51
Table 9. Descriptives and one-sample t test – Satisfaction ... 52
Table 10. Descriptives and paired t test - Satisfaction ... 52
Table 11. Descriptives and independent t test - Information value ... 52
Table 12. Descriptives and pair t test ... 53
Table 13. Descriptives and independent t test - Entertainment value ... 53
Table 14. Descriptives and pair t test - Entertainment value... 53
Table 15. Descriptives DM and Inter generation One-way ANOVA comparison tests - Price54 Table 16. Descriptives NDM and Inter generation One-way ANOVA comparison tests – Price ... 54
Table 17. Descriptives DM and Inter generation One-way ANOVA comparison tests - Convenience ... 55
Table 18. Descriptives NDM and Inter generation One-way ANOVA comparison tests - Convenience ... 55
Table 19. Descriptives DM and Inter generation One-way ANOVA comparison tests - Advertising ... 56
Table 20. Descriptives NDM and Inter generation One-way ANOVA comparison tests - Advertising ... 56
Table 21. Descriptives DM and Inter generation One-way ANOVA comparison tests ... 57
Table 22. Descriptives NDM - Satisfaction ... 57
Table 23. Descriptives DM and Inter generation One-way ANOVA comparison tests ... 58
Table 24. Descriptives NDM and Inter generation comparison tests... 59
Table 25. Descriptives DM - Entertainment value ... 59
6 Table 27. Nº hours/day watching Pay TV channels and Streaming platforms during works days and weekend days ... 60 Table 28. Descriptives and pair t test - Number of hours... 60 Table 29. Descriptives DM - Nº hours/day watching Pay TV chanels and Streaming Platforms ... 60 Table 30. Descriptives NDM - Nº hours/day watching Pay TV channels and Streaming Platforms ... 60
7
TABLE OF CONTENTS
1. INTRODUCTION ... 9
1.1 Background ... 9
1.2 Problem statement and research questions ... 9
1.2.1 Problem Statement ... 10 1.2.2 Research Questions ... 11 1.3 Managerial relevance ... 11 1.4 Dissertation Outline ... 11 2. LITERATURE REVIEW ... 12 2.1 Generations ... 12 2.2 Pay-TV or Traditional TV ... 13 2.2.1 Revenue Stream ... 13
2.2.2 Evolution of distribution platforms & formats ... 14
2.3 The cord-cutting phenomenon ... 16
2.4 The Rise of Streaming Platforms ... 18
... 20
2.5 The motivations that are leading consumers to move from pay-TV to Streaming platforms ... 20 2.5.1 Price ... 22 2.5.2 Convenience ... 22 2.5.3 General Satisfaction ... 23 2.5.4 Content ... 23 2.5.5 Advertising ... 24 3. RESEARCH APPROACH ... 25 3.1 Research instruments ... 25
3.1.1 Population and sample ... 25
3.1.2 The Focus groups ... 26
4. FOCUS GROUPS ... 27
4.1 Sample Representation (Appendix 1) ... 27
4.2 Insights from the focus group ... 27
1. Price ... 27 2. Convenience ... 27 3. General Satisfaction ... 27 4. Content ... 28 5. Advertising ... 28 5. THE SURVEY ... 29
8
5.1 Survey Sample Representation ... 29
5.2 Survey Statistical Analysis Methodology ... 30
5.3 Survey Insights ... 31 5.3.1 Research Question 1 ... 31 1. Price ... 31 2. Convenience ... 32 3. Advertising ... 32 4. Satisfaction ... 33 5. Content ... 34 5.1 Information value ... 34 5.2 Entertainment Value ... 34 5.3.2 Research Question 2 ... 35 1. Price ... 35 2. Convenience ... 36 3. Advertising ... 36 4. Satisfaction ... 37 5. Content ... 38 5.1 Information Value ... 38 5.2 Entertainment value ... 39 5.3.3 Research Question 3 ... 39
5.4 Quantitative Research Main Findings ... 40
6. MAIN CONCLUSIONS ... 42
6.1 Managerial Contribution ... Erro! Marcador não definido. 7. LIMITATIONS AND FUTURE EXPLORATION ... 46
7.1 Limitations ... Erro! Marcador não definido. 7.2 Future Exploration ... 47
9
1. INTRODUCTION 1.1 Background
In 2016, the global broadcasting & cable TV market had total revenues of US$439.1bn (PRNewswire, 2017) Besides the technical improvements on consumption and distribution, the evolution of this ever-changing market has been shaped by an insatiable and demanding consumer. From the ages of the “one channel TV” to the ability to stream video on demand, the future of this industry is far from stagnating.
In 2011, 18-24-year-old Americans were watching about 24 hours a week of traditional television. By 2016, that number had dropped to about 15 hours a week, according to the Nielsen Total Audience report from Q1 2016. Moreover, the 12th edition of Deloitte’s Digital
media trends survey found that younger people are now spending more time watching streaming video than TV. The drop is less precipitous for older Americans., but with streaming services now in more than 50% of households, the trajectory for television is clear (Ascheim, Burke, 2017).
1.2 Problem statement and research questions
The television industry has been transformed by the internet and now faces a problem – the traditional methods of broadcasting, which had ruled and provided growing revenues for decades, are now threatened by a set of new platforms that are able to fulfil the ever-demanding needs of modern consumers. Today, it’s the media consumer that decides how, what and when to consume. Television as we know it is going through changes. Content is consumed and distributed in diverse ways, which means that broadcasting, telecom and production companies must develop new strategies to maintain their businesses.
Taking into account that one of the biggest trends in the TV industry at present is disaggregation and fragmentation (Investopedia, 2015), that, according to McKinsey’s 2015 Global Media Report, there is a growing move away from “bundled” media, such as that offered by traditional pay-TV and that cord-cutters are being born each day, refusing astronomical monthly payments for 500 channels when they consume maybe a dozen (Minerley, 2015), it is important to investigate the motivations that form the basis of such trends.
10 Consumers now have many ways to watch programming without having to purchase channels they do not wish to receive and pay for. In fact, the day of paying a monthly cable bill may be ending as the phenomenon of cord-cutting becomes a greater trend in the American society (Crawford, 2016). A 2015 U.S. poll by Forrester Research predicts that by 2025, 50% of U.S. adults under age 32 won't pay for traditional cable subscriptions (Harris, 2015).
Secondly and on the other hand, quality content and the ability for people to watch on their own terms have both led to huge engagement increases for platforms like Netflix, which recently boasted a subscriber base watching an average of 90 minutes of Netflix programming every day (Matrix, 2014).
Thirdly, there is evidence that the ability to serve up content when we want has Millennials and Gen-Z’s revaluating their relationship with cable companies, while older generations still dedicate most of their media consumption time in front of the TV. Millennials and Generation Z represent the major threat to cut the cord because purchasing a television and cable/satellite box is not an attractive option when laptops are much more portable, and one can purchase streaming services online for less money and reduced complexity. Thus, age is a determinant factor when evaluating the threat of cutting the cord (The Economist, 2016). However, there is no clear evidence that consumers are, in fact, cutting the cord in favour of Streaming platforms or that the decision-making power1 influences consumer’s decisions, which is why
the author found relevant to explore it in this thesis.
1.2.1 Problem Statement
Thus, the first goal of this thesis is to explore the motivations that are leading to an increase on the Streaming platforms subscriptions like Netflix. Furthermore, the second goal of this thesis is to explore if the decision-making powerand age have influence on the consumer’s motivations and value attribution to pay-TV and Streaming platforms.
1 Decision making power– The consumer’s power to make decisions on any aspect regarding pay-TV or
11
1.2.2 Research Questions Research Question 1
- How does decision-making-power influence the consumers’ motivations regarding Pay-TV vs Streaming platforms?
Research Question 2
- How does age influence the motivations regarding Pay-TV vs Streaming platforms?
Research Question 3
- How does Decision-making-power and Age influence the time spent watching content on streaming platforms and on pay-TV?
1.3 Managerial relevance
Taking into account the current cord-cutting trends and the prediction made by Harris (2015), which states that by 2025 50% of U.S. adults under age 32 won't pay for traditional cable subscriptions and that it is predicted that, by 2020, Generation Z (maximum 30 years by 2025) will make up as much as 40 % of the US consumer market (EY report, 2016), its crucial for broadcasting companies to consider strategies that are able to adapt to these trends.
Broadcasting companies need to understand what the new generation’s motivations are and why are they causing the contemporary trend of moving from pay-TV to streaming platforms. Moreover, it is important to understand that there are consumers that, although they may have a formed opinion on the matter, still haven’t got the chance to decide because they still live with a decision maker. This means that these companies need to focus on both groups of consumers – Decision makers – and – Non-decision makers – and understand if there are differences in their motivations regarding both platforms. That is why exploring the decision-making-power and age factors becomes crucial and its essential for the future of these companies.
1.4 Dissertation Outline
The first part of this work’s structure is an introduction to the thesis’ topic, provided by outlining the background and introducing the research problem and questions. Literature review is the second chapter, where the author gathered academic and statistical data concerning the different generations, the characteristics of the contemporary media consumer,
12 the television industry’s structure, revenue stream and the evolution of distribution platforms and formats. The next chapter addresses the methodology used and justifies both qualitative and quantitative research.
The following chapter addresses the research questions through an analysis of all the data gathered and is followed by the conclusions chapter, where the author draws the main findings of the present thesis. Lastly, the limitations and future research chapter intends to determine the limitations of the project, as well as how this study can be used for further exploration.
2. LITERATURE REVIEW 2.1 Generations
The four generations that are significantly important to analyse for the purpose of this paper, which focuses on the transition trends form pay-TV to Streaming platforms, are Baby boomers (aged 54 to 72), generation X (aged 39 to 53), millennials (aged 24 to 38) and generation Z (aged 6 to 23) (Robinson, 2017).
Baby Boomers are defined as being from the huge population increase that followed World War II, and the Great Depression. They grew up in a time of prosperity and an absence of world wars. Unlike their parents who grew up during the Great Depression, Boomers became the great consumers. They became famous for spending every dollar they earned. This was the first Western Generation to grow up with two cars in every garage and a chicken in every pot. Baby Boomer spending and consumerism has fuelled the world economies. The Baby Boomers fought for environmental protection (Robinson., 2018).
Between 39 and 53 years old as of 2018, Generation Xers tend to be more ethnically diverse and better educated than Baby Boomers, since over 60 percent of them attended college. They came of age in an era of two-income families, a faltering economy and rising divorce rates. As a result, they are independent and resourceful. Gen Xers are comfortable with PDAs, smartphones, email, laptops, tablets and, of course, cable TV. Generation X is ambitious and eager to learn new skills, but they like to accomplish things on their own terms. (Kane, 2018) The Millennial generation, also known as Generation Y, was the first to come of age with cable TV, the Internet and cell phones, so technology is essentially baked into every millennial’s DNA. It is known that Millennials have more of a positive view of how
13 technology is affecting their lives than any other generation. More than 74 % feel that modern technologies makes their lives easier, and 54 % feel new technologies help them be closer to their friends and family (Nielsen, 2014).
According to an EY report from 2016, Generation Z, sometimes called the iGeneration, is defined as those born since the mid-1990s, representing about 25% of the US population. It is predicted that in 2020 this group will make up as much as 40 % of the US consumer market. 91% have access to a smartphone, 65 % have access to a tablet and 90 % watch YouTube daily. In a rapidly progressing digital world, technologies such as virtual reality, driverless cars and 3D printing no longer surprise Generation Z, who have moved 'from innovation to expectation' and no longer see tech as disruptive (Ashford, 2016). Generation Z’s interest is in seamless experiences and building ongoing relationships.
2.2 Pay-TV or Traditional TV 2.2.1 Revenue Stream
The broadcasting & cable TV market consists of all terrestrial, cable and satellite broadcasters of digital and analogic television programming and it is valued as the revenues generated by broadcasters through advertising, subscriptions, or public funds (either through TV licenses, general taxation, or donations).
Global broadcasting & cable TV market had total revenues of $439.1bn in 2016, representing a compound annual growth rate (CAGR) of 2.8% between 2012 and 2016. The TV advertising segment was the market's most lucrative in 2016, with total revenues of $198.8bn, equivalent to 45.3% of the market's overall value (PRNewswire, 2017).
The U.S market is the most significant in a worldwide scale, accounting for approximately 38,7% of the global revenue. The broadcasting and TV industry has become a major part of the United States economy, with revenues of $170.1bn in 2016, representing a CAGR of 0.9% between 2012 and 2016. Although the market has overall witnessed a slow to moderate growth in recent years compared with global numbers, it is expected to accelerate somewhat in the forecast period up to 2021. Growth is driven by both advertising and subscriptions. The TV subscriptions segment was the market's most lucrative in 2016, with total revenues of $98.1bn, equivalent to 57.7% of the market's overall value. The TV advertising segment
14 contributed revenues of $71.3bn in 2016, equating to 41.9% of the market's aggregate value (Marketline, 2017).
The main sources of revenue that fund today’s mainstream television content development are called affiliate fees, which are included on the subscriptions segment discussed above. They are a “share” of the subscription fee consumers pay to cable or satellite operators (channel only aggregators) that is then shared back to the content owner/distributor (eg. FNG). Today’s most typical cable strategy is built entirely around profit maximization utilizing affiliate fees. FNG’s goal, for example, is to develop one or two hit programs and fill the rest of the linear line-up with very inexpensive content. The “hits” make you a “must have” for any channel only aggregator– granting the right to ask for fees. Over the past 30 years, these fees have become the lifeblood of the TV content business – affecting how the major aggregators think and operate, also affecting how content is produced, financed, and packaged (Gurley, 2010). Additionally, one must consider that, recently, many broadcasters have made a strategic shift to content production, generating revenue from international licensing deals and global/ local syndication. This has provided protection from slowing growth in advertising revenues and rising costs of premium content. This trend can be seen globally with investment in content leading to the creation of new content kingdoms, beyond Hollywood (Accenture, 2016).
2.2.2 Evolution of distribution platforms & formats
TV’s institution, since its foundation, has received a crucial role – to be in the public service – and has its obligations regarding the education and information of the citizens (Mitu, 2011). Its importance is great, not only because its impact on society is astronomical, both socially and economically, but also due to its rapid and thorough ability to spread information. The first commercial TVs were displayed at the World Fair in 1939. While available to consumers, these early television sets were far from affordable. In the 1950’s, the “Golden Age” of television, colour becomes the wave of the future and the remote control is invented. The “tube” becomes an advertiser’s dream come true and products are marketed directly to the consumer by sponsorships. The family dinner is revolutionized with the introduction of the “TV dinner”.
15 The 80’s saw little innovation with the television specifically, however, a growing number of television accessories like the VCR2 appeared. Although cable had been around since the
50’s, cable television saw a significant boom during the 80’s. The 90’s saw substantial changes in technology all together. DVD players take over the home theatre experience. Much like the VCR, DVD players were introduced a decade earlier, but took some time to gain momentum. At the beginning of the decade, DVD players were in approximately seven percent of homes; in less than 10 years, more than 80 percent of homes had a DVD player. TiVo revolutionized the way we watch television. It had the ability to pause live broadcasts and record several programs at once, even while the television was on another channel. No longer were people tethered to their couches living by the network’s times. They were free to watch what they wanted when they wanted. TV becomes interactive with the introduction of “American Idol” home viewing audiences became part of the competition. Encouraging the public to “vote” for their favourite performer, the programs enabled audiences to take an active part in the show’s outcome.
Television goes all digital. HD DVD and Blu-ray enter a battle for high definition supremacy. TV goes online. With the introduction of high speed Internet, video streaming and digital recording enters the scene. Many are posting their favourite programs and commercials online without the permission of broadcasters. This has led to many networks making their programs available online (Monaghan). Streaming services like Netflix and Hulu enter the market and begin to threaten major broadcasting companies with online, on-demand content. However, such OTT3 content is not referred to as television (Petersen, 2017).
In 2016, the United States witnessed a strong rise in the sales of smart TVs, as the total penetration of Smart TVs increased from 46.9% in 2015 to 56.1% in 2016. By 2020, this figure is expected to rise to 60.4%. Smart TVs have apps that facilitate the use of substitutes like SVOD services and an increase in such TVs, enhances the threat of substitutes (Marketline, 2017). In line with the increase in the number of SmartTVs, is the rise of services that provide online TV subscriptions.
2 VCR – Video Cassette Recorder - device that records analog audio and video from broadcast television or other source on a removable, magnetic tape videocassette, and can play back the recording.
3OTT – Over-the-top – An over-the-top (OTT) application is any app or service that provides a product over the Internet and bypasses traditional distribution.
16
2.3 The cord-cutting phenomenon
2014 was the first year in the media history where the US consumer spent more time using mobile screens than watching TV, according to Flurry, a Yahoo-owned mobile analytics service (Khalaf, 2017). In 2016, about 81% of adults in the United States had smartphones which were used about one hour and 39 minutes daily on average to consume media. Moreover, the average time spent watching TV is skewed by 50-plus viewers. For the 18-34 demographics, 39% of media consumption happens on digital (smartphones, tablets and PCs) and 15% on connected-TV4 devices (like game consoles, Apple TV, Roku and Google
Chromecast) versus 29% with live TV and 17% with radio. Americans aged 50 and older spend 53% of their time with media in front of the TV, with 21% on digital platforms, 17% on AM/FM radio and 8% on connected-TV devices.
One of the biggest trends in the TV industry at present is disaggregation and fragmentation. We’re moving from a world in which most people consume, almost exclusively, pay-TV delivered through a traditional infrastructure and set-top box to one in which people consume a variety of video content through many different channels.
Unbundling, or cutting the cord, is the TV networks' worst fear; they would no longer receive regular revenue from being part of a cable package. Instead, they would have to compete on their own merits. (Investopedia, 2015).
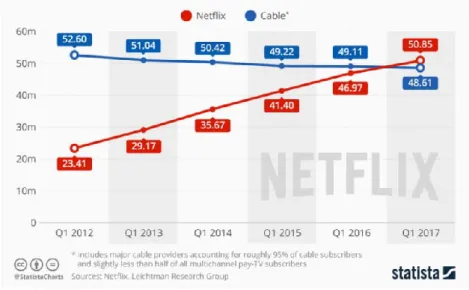
Cord-cutting, regarding television viewing, is defined as the dropping of a cable or satellite television subscription service in favour of one or more alternatives. The decision to cut-the-cord frequently results from a consumer performing a cost-benefit analysis and concluding that a cable or satellite package costs more than it is worth. Figure 3 illustrates the phenomenon of cord-cutting and the rise of Netflix’s subscriptions.
Not only cord-cutters, but also cord-nevers and cord-shavers are threatening the well-established traditional TV industry. A cord-never is a consumer who has never paid for a cable or satellite TV service (Selyuhk, 2015), whilst a cord-shaver is a consumer that cuts pay-TV expenses without cancelling it. Cord-shavers represent a worrisome threat in the sense that, on an initial stage, their intentions are to improve the TV service for their own
4 Application to access different content. Some of the most popular applications available on Connected TVs include Netflix and Hulu.
17 benefit without cancelling it, but if this demand cannot be provided by broadcasting companies they may become cord-contemplators (stage where the consumer considers the possibility to cut the cord) and finally become cord-cutters for good.
A 2015 U.S. poll by Forrester Research provided startling numbers. Its online survey of 32,000 American adults found that of the 24 per cent who say they don't pay for cable, only 6% are cord-cutters, while 18% are cord-nevers.
Although, in November 2010, a Magid study of consumer video consumption habits and platforms found that only 3% of consumers report that they are even considering cancelling their traditional subscriptions without replacing it with a competing subscription (Econtentmag, 2010), Forrester predicts that by 2025, 50% of U.S. adults under age 32 won't pay for traditional cable subscriptions (Harris, 2015).
Despite these numbers, there are media specialists who believe that broadcasting still has a significant role on the lives of TV consumers. As Liz Evans stated at a Tedx talk in 2014, “There is something very comforting about TV broadcasting, that is always there. The continuing importance of live TV broadcasting, that moment, that sense of liveness and eventness, gives us something special and different.” In fact, nothing online generates the type of water-cooler conversation that shows like “American Idol” do. It is true that we watch online videos primarily as individuals, but we still watch TV shows, like the one mentioned above, in groups. When a crisis happens, for example, consumers still turn on their TVs. The initial alert might come from another source, but after that people turn on their TVs for
18 broader coverage and a better explanation of what’s really happening (Kirkland, 2014). As Liz Evans puts it “It’s a message, a story coming from one central point out to millions of people, all at the same time”. We, as consumers and individuals, want to be a part of that story.
Broadcasting, which we usually associate with TV, can be experienced through smartphones and other web connected devices, which means that even if streaming takes over cable or satellite TV, this kind of media will hardly fade away.
2.4 The Rise of Streaming Platforms
The famous statement by Time Warner’s CEO Jeff Bewkes regarding the evolution of SVOD5
services in 2010 - “It’s a little bit like, is the Albanian army going to take over the world? I don’t think so.” – is an evidence of how quickly things can change. SVOD services have morphed into big competitive beasts and they are taking over the world (Farrell, 2017).
For many analysts, SVOD is quickly emerging as the dominant model in the pay TV business. In fact, Todd Juenger from Sanford Bernstein stated that “If broadband had existed in the 1950s, we doubt TV would have evolved the way it did.”
As an example, Netflix has grown by leaps and bounds (Farrell, 2017). An interesting fact that illustrates the incredibly rapid rise of SVOD services is that by March 31 2017, Netflix was expected to reach 50 million domestic subscribers, a milestone it hit in just nine years since its debut. In contrast, it took the cable and satellite TV business 15 years to reach the same point. The rise in Netflix subscribers is shown in figure 3.
More than 40 years after Ted Turner started the first basic-cable network (WTBS in 1976), pay TV programmers are faced with a new dilemma. The rapid rise of subscription video-on-demand has the TV industry wondering how much longer the lucrative linear pay TV model will last (Farrell, 2017).
The number of SVOD services has been rising exponentially and it is unlikely that they will stop. Nonetheless, although it’s arguable that all of the subscription video-on-demand services now surging in number will be able to strive in the coming years, there are no signs that the
19 global appetite for SVOD is fading. In figure 4 is possible to understand the rapid rise in SVOD viewing habits.
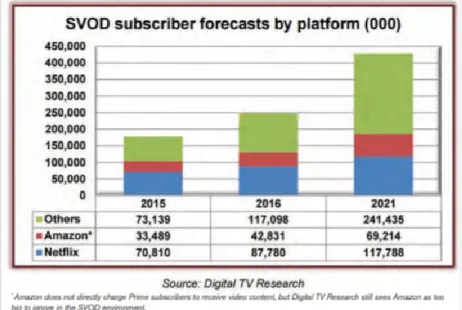
As shown in figure 2, according to the Digital TV Research’s Global SVOD Forecasts report, the number of SVOD homes is expected to reach 428 million across 200 countries by 2021. The United States, with 127 million subscribers by 2021, will remain the largest SVOD market by 2021. Among individual services, the forecast sees Netflix keeping its global lead with 118 million paying subs by 2021, or 27.5% of the worldwide total, while also raking in $13.14 billion in annual revenues by 2021. The company expects Global SVOD revenues to hit $32.18 billion by 2021, up from the $12.2 billion posted in 2015 (Baumgartner, 2016).
Figure 3. Growth in the number of Netflix subscribers in the U.S by age Source: PWC 2017
20 Nielsen’s “Total Audience Report” from 2017 indicates that in the space of 5 years, close to half of Americans aged 18-24 traditional TV viewing time has migrated to other activities or streaming. Figure 5. shows us the evolution of the number of hours in which consumers watch content on pay-TV.
With regard to the other age groups, Millennials (25-34) represent a considerable 32.2% drop Those results demonstrate the age-related skew in traditional TV viewing, with declines easing off with each age bracket and turning into a slight viewing increase among the oldest age group.
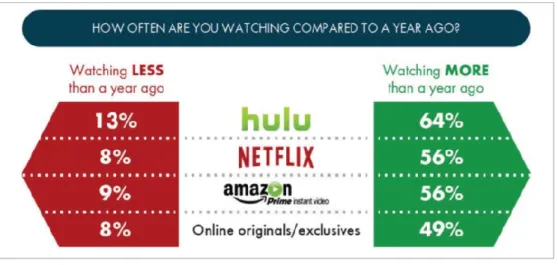
Figure 4. How often were consumers watching content on SVOD services in 2017 compared with 2016
21 This might indicate that age has a significant role in pay-TV and Streaming platforms viewing.
2.5 The motivations that are leading consumers to move from pay-TV to Streaming platforms
“The industry is quickly shifting from B2B to B2C models, which makes understanding customers more paramount to success than ever before." Martyn Whistler, EY media and entertainment lead analyst. In fact, if the actual television story were to be splashed across the front pages of tomorrow’s newspapers, the headline would read: “Consumers are in control” (EYGME, 2013).
Consumers now have many ways to watch programming without having to purchase channels they do not wish to receive and pay for. In fact, the day of paying a monthly cable bill may be ending as the phenomenon of cord-cutting becomes a greater trend in the American society (Crawford, 2016).
According to an eMarketer report from 2017, that surveyed respondents about the factors that persuade them to subscribe to a Streaming platform, low cost was the top factor (34%), followed by convenience of watching content on any device (~25%) and access to original content (18%). Moreover, data gathered from a survey conducted by surveymonkey for SurveyMonkey shakedown with 500 American respondents, shows that cost and convenience is cited as the top two reasons people use streaming services.
Jon Giegengack, principal of Hub Entertainment Research stated that one of the main reasons behind the ongoing rise in SVOD consumption is the fact that the majority of these services does not have advertising. In sum, Todd Juenger, a media analyst from Sanford Bernstein, an investment research and management company, stated that “SVOD is tailored to today’s content viewer in that it is on-demand, easy to access and search, inexpensive and either has limited advertising or is completely commercial-free.”
Based on what was found in the Literature review and aiming to understand the consumer’s motivations that are leading to the transition from pay-TV to Streaming platforms, the author identified five motivations:
22
2.5.1 Price
There are a number of reasons consumers are driven to consider alternatives to traditional television subscriptions, starting with cost. In fact, a 2016 survey from DigitalSmiths indicates that the top complaint among unsatisfied consumers (with their current TV service) was that prices were too high (DigitalSmiths, 2016).
The latest edition of Deloitte’s “Digital Media Trends Survey” stated that 46 percent of all pay TV subscribers said they are dissatisfied with their service and 70 percent of consumers feel they get too little value for their money (Elligson, 2018).
Millennials and Generation Z represent the major threat to cut the cord because purchasing a television and cable/satellite box is not an attractive option when laptops are much more portable, and one can purchase streaming services online for less money and reduced complexity. Many young people do not have a steady income and cable or satellite television, with their soaring prices, are not considered a necessity. In addition, they often choose not to pay premium prices for a service that gives them unnecessary content when online streaming is cheaper, and they are able to select the content that they want (Crawford, 2016). Millennials are also among the hardest hit by the economic slowdown. The 25–34 age group is good at finding deals and they excel at finding the least expensive way to get exactly what they want online, when they want it.
If, outside of live sports and news, the consumer is only watching on-demand shows and a fraction of what’s being served, why should it be paying full freight? Cord-cutters are being born each day; refusing astronomical monthly payments for 500 channels when they consume maybe a dozen (Minerley, 2015).
2.5.2 Convenience
The ability to serve up content when the consumer wants had Millennials and Gen-Z’s revaluating their relationship with cable companies.
Bearing in mind that “Americans now own four digital devices on average, and the average U.S. consumer spends 60 hours a week consuming content across devices.” (Nielsen (2014), the convenience of being able to watch videos from anywhere, at any time and how many
23 times you want to watch, also offers the convenience of being able to stream on a wide assortment of devices, namely Smart-TV, PC, I-pad, smartphone, etc (roshan, 2017).
According to a survey of TV watchers from consulting giant PwC, which in October 2017 questioned 1,986 Americans between the ages of 18 and 59, with household incomes of at least $40,000, cord cutters said that even while having an average of more than three services available to them, they watched an average of just 1.8 of those services regularly. Part of the reason for that is just finding something to watch on a particular streaming service. PwC said that because of such factors, streaming services need to make their content easier to discover, explore and watch (Crum, 2017).
Streaming platforms strategy strives because control is given back to consumer. Netflix, for example, sometimes launches all episodes of a season at once, and fans gobbled them up in marathon sessions (Fast company, 2015, 2016) (binge-watching6), which means that the
consumer is able to decide when and where he/she wants to watch an episode, or more.
2.5.3 General Satisfaction
US video consumers are more satisfied with streaming video on-demand (SVOD) products than traditional pay-TV services, according to the annual American Customer Satisfaction Index (ACSI) 2018 Telecommunications Report.
This was the first year that the ASCI has included the streaming video sector in its survey. Customer satisfaction with SVOD services achieved an average score of 75 (out of 100). Pay-TV fared worse — in fact, the worst — to an 11-year low, down 3.1% year-over-year with an average score of 62 across the sector (Schomer, 2018).
2.5.4 Content
As Bob Gilbreath states on an article entitled Rise of Subscriptions and the Fall of Advertising, “A funny thing happens once you completely focus your business around making paying customers happy: Your product gets better.” Bob believes that “the race is on to produce more quality content to keep subscribers happy, often using data from their direct relationships to learn about their preferences and continually improve.”. Platforms like Netflix
6Binge watching - the practice of watching multiple episodes of a television programme in rapid succession, typically by
24 have been doing just that: improving their content production using insights from consumers’ preferences and choices, which is one of the main factors for the success of the platform. Quality content led to huge engagement increases for platforms like Netflix, which recently boasted a subscriber base watching an average of 90 minutes of Netflix programming every day (Crawford, 2016). SVOD services offer content that correspond to the promise and are in connection with user’s demand. This confirms the success of niche video platforms, whose content will be more likely to satisfy passionate and enthusiast consumers (Okast, 2017). According to a Q2 2017 study by TiVo, 7.5% of cord-cutters said they cancelled their pay TV subscription because the bulk of their TV viewing consists of original content on streaming services, like Netflix’s “Orange Is the New Black.” (eMarketer, 2017).
Moreover, data gathered from a survey conducted by surveymonkey for SurveyMonkey shakedown with 500 American respondents, shows that viewers use streaming to watch original shows not available on cable or satellite (24%). A quarter of respondents say they watch older TV programs that are no longer airing current episodes and only 17% surveyed say they watch current new release movies.
2.5.5 Advertising
As the clinical professor of marketing at the New York University Stern School of Business, Scott Galloway, states: “Advertising is a tax on the poor”.
While the growth of subscriptions can be explained by many reasons, the frustration with the onslaught of advertising that we are subject to is certainly one of them. “Advertising has always been a “tax” on our attention” – states Bob Gilbreath. Before, the consumer had little choice but to watch the ads, because there was no way to skip them. Nowadays, there is more freedom and, when the consumer can do what he/she wants, they will avoid the “attention tax”.
A Hub Entertainment Research study found that consumers tend to embrace platforms that allow ad-skipping (Baumgartner, 2017).
25
3. RESEARCH APPROACH
According to Saunders, Lewis, and Thornhill (2009) there are three possible research approaches. Exploratory, descriptive and explanatory. Exploratory research is used when insufficient research has been performed on a topic and clarification is needed. This can be done through qualitative research, such as by reviewing existing literature, conducting focus groups or interviewing experts of the related field. The aim is to obtain new insights regarding the topic.
In the case of descriptive research, quantitative data is collected in order to establish a more detailed characterization of a phenomena. Surveys are often conducted to collect primary data. An explanatory approach is adopted when a topic is already studied thoroughly, but causal relationships between the variables still need to be established. The relationships that resulted from the descriptive research might be further examined through semi-structured or structured interviews. Experiments and simulations can also be employed in order to study cause-and-effect relationships. Hypotheses can be formulated and tested through data collection (Saunders et al., 2007).
Research on pay-TV’s modern consumer trends and the motivations for the transition to streaming platforms is a current theme. While there is a great amount of research made on the motivations of the different generations, there is no significant research on how the consumer’s decision power can influence the value attributed to pay-TV vs Streaming platforms. Consequently, for this particular study, a descriptive and explanatory approach is indicated.
By interpreting the information gathered in the Literature review and the insights from the focus groups, the author elaborated a survey. By analysing the data collected in the survey, the author will answer the three research questions.
3.1 Research instruments 3.1.1 Population and sample
A population is the set of all elements that have various elements in common, and that share the information needed by a researcher in order to solve a research problem (Malhotra, 2010).
26 The population of this study consists of international consumers of both genders and from all ages. Due to financial and time constraints, it was not possible to take a representative sample for the present study. Consequently, the chosen sampling method is a non-probabilistic convenience sample, which allows for quick and inexpensive sampling. Respondents are selected by virtue of their accessibility and close proximity to the researcher (Malhotra, 2010).
3.1.2 The Focus groups
As suggested by Breen (2006), the author chose to conduct a focus group instead of one-on-one interviews because focus group discussions are far more appropriate for the generation of new ideas formed within a social context (Decision makers and Non-decision makers), in contrast with one-to-one interviews, which are ought to probe individual experiences, encouraging self-reflection on issues that could be distorted if social pressure were placed on the individual.
The qualitative research was developed considering what was found in the Literature Review and with the goal of exploring more about what the consumer’s motivations are. Specifically, the goal of the focus groups was to get a clear picture of how both groups feel about the current pay-TV offer, their level of satisfaction, what they appreciate and what they dislike, their openness to new business models, their habits as consumers, their opinions on new technologies and trends and their feelings about streaming platforms.
Considering the author’s intent to focus on Generation X, Millennials, Generation Z and Baby boomers as the principal generations to study in this thesis, two focus groups were conducted. Focus group 1 (Non-decision makers) was organized with participants ranging from 18 to 24 years old (Millennials and Generation Z) that still live with someone that has the power to decide whether there is a Pay-TV service or not in their households.
Focus group 2 (Decision makers) was organized in order to explore the contemporary consumer’s tendencies and trends, with participants ranging from 42 to 71 years old (Generation X and Baby boomers).
The question structure was similar in both groups, covering the motivations discussed in section 2.6, The questions were elaborated with the goal of creating a healthy environment for
27 discussing between all participants, one where they would feel comfortable and willing to share their opinions and thoughts.
4. FOCUS GROUPS
4.1 Sample Representation (Appendix 1) 4.2 Insights from the focus group
Insights from the qualitative research indicate that only few participants from focus group 1 don’t subscribe to a Streaming platform. The ones who do, stated that they spend much more time watching content on such platforms rather than on pay-TV channels. In fact, the pay-TV channels’ viewing habits of this group’s participants translates to “zero”. Regarding respondents from focus group 2, only two were not subscribers of a streaming platform and the pay-TV viewing habits are higher. Nonetheless, all the ones who are subscribers stated that they spent more time watching content on streaming platforms than on pay-TV.
Motivations – 1. Price
Participants from focus group 1 think that pay-TV prices are expensive. In accordance, participants from focus group 2 also stated their dissatisfaction regarding the cost of pay-TV services.
2. Convenience
Participants from both focus groups stated that streaming platforms are more convenient than pay-TV channels.
Also, there was a general agreement on the difficulty to decide what to watch, as well as the time spent trying to find something to watch, on both platforms among participants from both focus groups.
3. General Satisfaction
Every participant from focus group 1 showed reluctance towards watching pay-Tv channels and one stated that they are not essential in his life. Interesting enough, although every participant felt the same, the feeling of reluctance grew from participant to participant by order of intervention.
28 Moreover, when discussing the possibility of only being a Streaming platform subscriber, putting aside a pay-TV subscription, participants from group 1 considered it impossible. Participants from focus group 2 also showed their dissatisfaction with pay-TV channels and a general preference for streaming platforms.
4. Content
An important insight given by the participants from group 2 was that they usually attribute the ability to provide valuable information to pay-TV channels and the ability to provide entertainment to streaming platforms. In fact, there was a clear conviction from focus group 1’s participants that they can be educated and informed individuals without access to pay-Tv channels, despite the relevance they still have. They think that their education was different and that they were used to get information from other sources besides pay-TV channels. Participants from focus group 2 described Streaming platforms as a good source of entertainment, at the same time as they lack as a valuable information source. Pay-TV channels, on the other hand, were described mainly as good providers of valuable information, at the same time as they lack as a valuable entertainment source.
5. Advertising
Participants from both focus groups showed high levels of reluctance with the comercial interruptions on pay-TV channels. On the other hand, participants showed a high level of satisfaction with the fact that Streaming platforms are, in their majority, ad-free.
4.2.1 Focus groups main conclusions
Findings from focus groups are in line with what was found in the Literature Review. Moreover, new insights regarding “Content”, namely the fact that participants attribute the ability to provide valuable information to pay-TV channels and the ability to provide entertainment to streaming platforms. Moreover, participants also stated that they can be educated and informed individuals without access to pay-Tv channels;
29
5. THE SURVEY
The Survey Questions are available in Appendix 30.
The survey was conducted to get a clearer picture of how consumers felt about pay-tv and Streaming platforms and what kind of influence can decision power and age have on such feelings. It was structured taking into account the data collected from the literature review and from the focus groups, in order to cover all the important factors.
Respondents were divided by Decision Power (having, or not, the power to decide whether they have pay-tv and Streaming platforms, just Pay-TV or just Streaming platforms in their households).
The sets of questions were similar for the two groups, which allows for a comparison between them regarding the same factors.
To establish an accurate measurement of the data it was assured that the questions were clear and correctly understood by respondents (Malhotra, 1999). Before putting the survey online, the author sent it to respondents from different ages and education level’s, to ensure that questions were understood. Moreover, the completion time was also tested.
5.1 Survey Sample Representation
In Appendix 2. you can see the Survey sample representation on Table 1.
The sample is composed of 184 inquired, being 60.3% female respondents and 39.7% male respondents. Ages range from 13 and 71, with a mean of 29.79 years old (SD=12.51).
Generation wise, the majority of the study’s respondents are young adults – 38% belong to generation Z, 38% to millennials, 17.9% to generation X and 6% to baby boomers.
Regarding the Decision-making power, 41.4% of the participants are DM (Decision Makers), from which 40.5% are women and 42.5% are men. Regarding the total sample, women that are DM represent 24.5% and men that are DM represent 16.9%.
Regarding age, DM’s age range stands between 21 and 71, with a mean of 39.83 and with an elevated discrepancy (SD = 13.98 years). NDM’s (Non-decision Makers) age range stands
30 between 13 and 33, with a mean of 22.73 and a low discrepancy (SD = 2.99 anos). Considering their age characteristics, it is fair to recognise that NDMs are suns, depending on their parents and still living with them.
Regarding generations, it verifies that only 15.7% of the participants who belong to generation Z and only 30% who belong to millennials are DM, while 100% of the participants who belong to generation X and baby boomers are DM.
Relative to subscriptions, the totality of participants has Pay-Tv in their households and 51.6% have Streaming platforms.
5.2 Survey Statistical Analysis Methodology
In the case of dependent quantitative variables (ex: hours), a parametric statistic of comparison of means was utilized, namely the t test for one sample to validate a determined value, the t test for independent samples to compare two independent groups (ex. DM vs. NDM), the t test for paired samples to compare two paired results (Hours week-day vs hours weekend day), and the one-way ANOVA test, together with the respective multiple comparison tests (Bonferroni ou Games-Howell) for comparing means between three or more independent groups (ex. Generation Z (6-23), Millennials (24-38), Generation X (39-53), Baby Boomers (≥ 54)).
In the case of dependent variables from the ordinal type with a five-point scale (ex. 1- Strongly disagree; 5- Strongly agree), they were treated as quantitative variables, because they present more than four different points.
When utilizing the parametric tests, the normality of distributions was assured by sampling through the application of the tests Shapiro-Wilk (n50) or Kolmogorov Smirnov (n>50). The inexistence of serious violations of normality was assumed when |skewness| < 3 and |Kurtose| < 7 or when the sample is of large dimensions (n>30) by evoking the central limit theorem. The homogeneity of variances was assured using the Levene’s test, utilizing the Welch correction when necessary.
31
5.3 Survey Insights 5.3.1 Research Question 1
- How does decision-making-power influence the consumers’ motivations regarding Pay-TV vs Streaming platforms?
Bearing in mind the findings from the Literature Review, the author decided to test respondent’s answers on 6 factors:
1. Price, which was explored as: Inexpensive vs Expensive
2. Convenience, which was explored as: Inconvenient vs Convenient
3. Advertising, which was explored as: No commercial interruptions vs Commercial Interruptions
4. Satisfaction, which was explored as: Dissatisfaction vs Satisfaction 5. Content
5.1 Information value, which was explored as: Provides valuable information vs Does not provide valuable information AND Main source of information vs Not the main source of information.
5.2 Entertainment value, which was explored as: Provides entertainment vs Does not provide entertainment.
1. Price
There are significant differences between DM and NDM considering pay-TV’s prices (t(182)p
=2.063; p=0.41). DM (M=3.82) consider pay-TV’s prices more expensive than NDM (M=3.62).
Regarding Streaming Platforms, there are no significant differences between DM (M=2.89) and NDM (M=2.79), because (p > 0.05) - see Appendix 3. Table 2.
32 Regarding the data acquired on Table 3., we see that DM consider that pay-TV services (M=3.82) are more expensive than Streaming platforms (M=2.89) - (t(75)= 6.970; p=0.000).
The same happens with NDM, who consider that Pay TV services (M=3.63) are more expensive than Streaming platforms (M=2.79) - (t(106)= 7.924; p=0.000).
In qualitative terms, it is important to notice that both DM’s and NDM’s opinion values are above the medium scale point (3) regarding pay-TV services prices and below the medium scale point (3) regarding Streaming platforms prices – see Appendix 18. Graphic 1.
2. Convenience
Regarding the data acquired on Table 4. (See appendix 4.) this test, we see significant differences between DM’s and NDM’s answers relative to the question “It takes me a lot of time to decide what to watch on pay-TV channels” (t(182)= -2.386; p=.018). NDM (M=3.12)
and DM (M=2.75).
Regarding the question “It takes me a lot of time to decide what to watch on Streaming platforms” DM e NDM do not present significant differences (p > 0.05).
Regarding the data acquired on Table 5., we can see that DM’s mean is 3.87 and that NDM’s mean is 3.96, which are both significantly superior than 3. This indicates that both groups agree with the affirmation. DM (t(38)= 7.098; p=.000) and NDM (t(55)= 9.782; p=.000).
Note: It is important to notice that DM (3.87) significantly considers Streaming platforms more convenient than pay-Tv channels (t(38)= 7.098; p=.000), as well NDM (3.96) (t(55)=
9.782; p=.000).
3. Advertising
From the data acquired on Table 6. (see Appendix 5.), we can see that both DM and NDM show high levels of depreciation regarding pay-TV’s commercial interruptions and high levels of appreciation regarding the fact that Streaming platforms don’t have commercial interruptions. Thus, there are no significant differences between both groups.
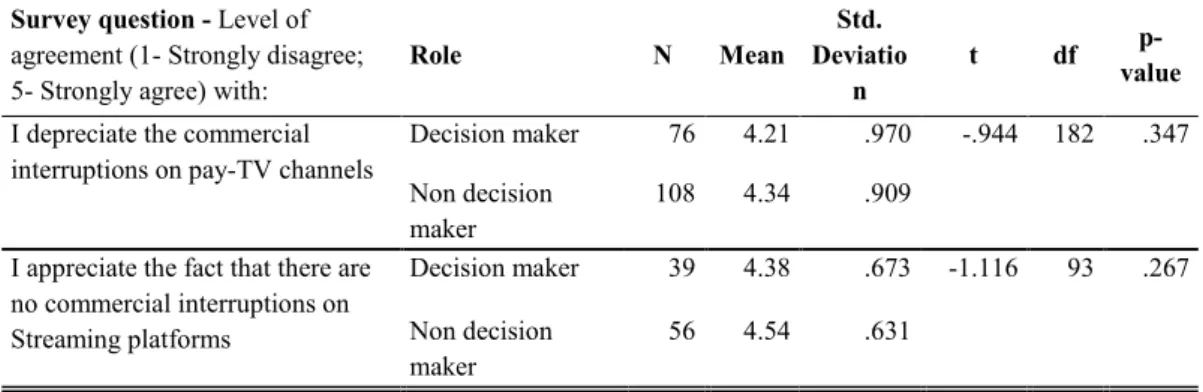
33 On Table 7., regarding the fact that pay-TV has commercial interruptions, we can see that DM’s mean is 4.21 (t(75)= 10.875; p=.000) and that NDM’s mean is 4.34 (t(107)= 15.357;
p=.000), which are both significantly superior than 3. This indicates that both groups depreciate such commercial interruptions.
Moreover, regarding the fact that Streaming platforms don’t have commercial interruptions, we can see that DM’s mean is 4.38 (t(38)= 12.841; p=.000) and that NDM’s mean is 4.54
(t(55)= 18.200; p=.000). This indicates that both groups appreciate the fact that Streaming
platforms don’t have commercial interruptions.
4. Satisfaction
On Table 8. (see Appendix 6.) we can see that there are no significant differences between DM and NDM regarding satisfaction (p > 0.05).
On Table 9. are presented the results from the validation test of satisfaction from DM and NDM regarding their current pay-TV service, namely if they superior to the medium level (3). Note: DM’s satisfaction with their current pay-TV service (M=3.33) is significantly superior to 3 (t(75)= 3.134; p=.002), as well as NDM’s (M=3.44) (t(107)= 5.088; p=.000).
With the goal of verifying if the dissatisfaction would be greater without pay-TV channels or Streaming platforms, to both DM and NDM, a paired t test was made.
On Table 10., regarding DM, the level of dissatisfaction facing the inexistence of pay-Tv channels (M=3.18) is not statistically different from the level of dissatisfaction facing the inexistence of Streaming platforms (M=3.56) (p > 0.05).
On the other hand, regarding NDM, the level of dissatisfaction facing the inexistence of Streaming platforms (M=3.75) is statistically superior to the level of dissatisfaction facing the inexistence of pay-TV channels (M=3.14) (t(55)= -2.940; p=.005).
34
5. Content
5.1 Information value
On Table 11. (see Appendix 7.), we can see that DM show a (M=3.67) of agreement with the statement “I can be a well-informed and cultured individual without pay-TV channels”, and NDM (M=3.99). The difference is statistically different (t(147)= -2.283; p=0.024) and it shows
that DM believe that the existence of pay-TV channels is relevant for them to be well-informed and cultured individuals with more strength than NDM.
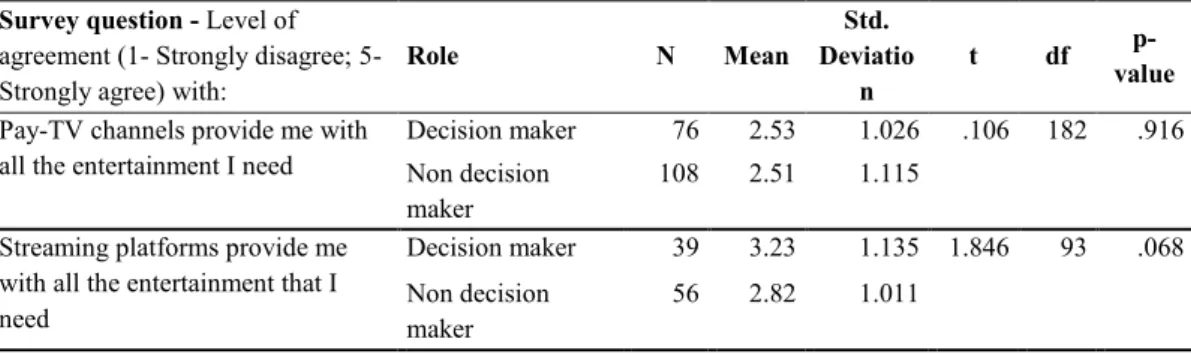
Trying to verify wish one of the information sources is considered to be the best provider of necessary information for the respondents, a comparison of the means was measured and the results are shown in Table 12.
We can see that there are no significant differences between DM and NDM regarding the level of agreement with the statements “Pay-TV channels provide me with all the information that I need” and “Streaming platforms provide me with all the information that I need”. See Appendix 20. – graphic 3.
5.2 Entertainment Value
On Table 13. (see Appendix 8.) we can see that there are no significant differences between the opinions of DM and NDM regarding the survey question (p > 0.05).
Trying to verify wish one of the entertainment sources is considered to be the best provider of necessary entertainment for the respondents, a comparison of the means was measured and the data is shown on Table 14.
The results show that DM consider Streaming platforms (M=3.23) to be better sources of entertainment than pay-TV channels (M=2.33) (t(38)= -3.650; p=0.001).
35 The same happens with NDM – Streaming platforms (M=2.82) vs Pay TV channels (M=2.41) (t(55)= -2.436; p=0.018).
In qualitative terms, it is important to notice that only DM’s opinion is superior to the medium level 3.
See Appendix 21. – graphic 4.
5.3.2 Research Question 2
- How does Age influence the value attributed to pay-TV vs Streaming platforms? 1. Price, which was explored as: Inexpensive vs Expensive
2. Convenience, which was explored as: Inconvenient vs Convenient
3. Advertising, which was explored as: No commercial interruptions vs Commercial Interruptions
4. Satisfaction, which was explored as: Dissatisfaction vs Satisfaction 5. Content
5.1 Information value, which was explored as: Provides valuable information vs Does not provide valuable information AND Main source of information vs Not the main source of information
5.2 Entertainment value, which was explored as: Provides entertainment vs Does not provide entertainment
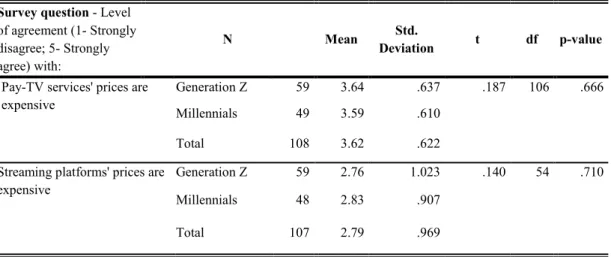
1. Price
As we can see on Table 15. (see Appendix 9.) regarding DM, there are no significant differences observed between the different generations (p > 0.05).
On Table 16., regarding NDM, we can see that there are no significant differences observed between the different generations.
36 See Appendix 22. – graphics 5 and 6.
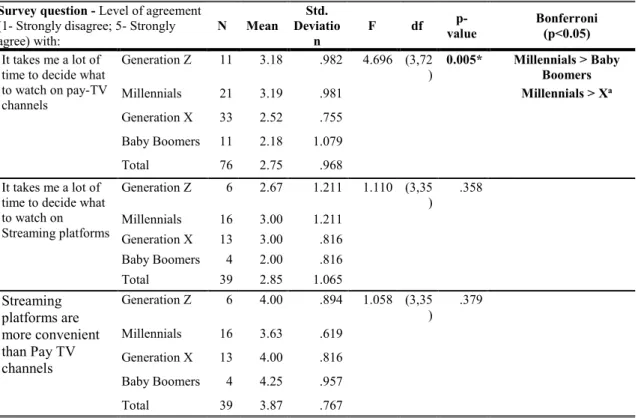
2. Convenience
On Table 17. (see Appendix 10.), regarding DM, significantly different levels of agreement between generations are observed relative to the statement “It takes me a lot of time to decide what to watch on pay-TV channels” (F(3,72)=4.696; p=.005). Millennials (M=3.19) present a
significantly superior level of agreement than Baby Boomers (M=2.18) and marginally superior than generation X (M=2.52).
Regarding the statement “It takes me a lot of time to decide what to watch on Streaming platforms” and “Streaming platforms are more convenient than Pay TV channels”, there are no significant differences.
Table 18. shows that, regarding NDM, there are no significant differences observed between
the different generations.
See Appendix 23. - graphics 7, 8 and 9.
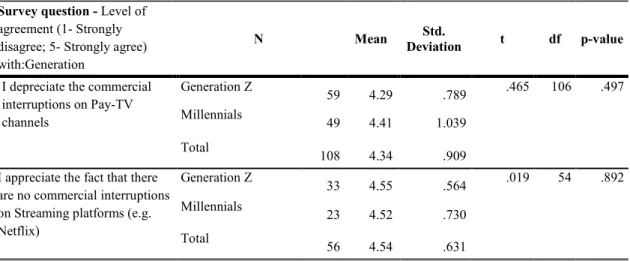
3. Advertising
On Table 19. (see Appendix 11.), regarding DM, we see that Baby boomers are the generation that reveals a greater level of dissatisfaction concerning the commercial interruptions on pay-TV channels (M=4.64), while Millennials are the ones who show the lowest level (M=4.05). Generation Z reveals the greatest level of satisfaction relative to the inexistence of commercial interruptions on Streaming platforms (M=4.83) and generation X the lowest (M=4.15).
Nonetheless, the present results do not show statistically significant differences between generations (p > 0.05).
On Table 20., regarding NDM, we can see that generation Z manifests a (M=4.29) and Millennials (M=4.41) regarding the commercial interruptions on pay-TV channels. Concerning Streaming platforms, generation Z shows a (M=4.55) and Millennials (M=4.52).
37 Nonetheless, the present results do not show statistically significant differences between generations (p > 0.05).
A homogeneity of dissatisfaction concerning the existence of commercial interruptions on pay-Tv channels is observed on both groups (DM and NDM), and of satisfaction concerning the inexistence of commercial interruptions on Streaming platforms.
See Appendix 24. – graphics 10 and 11.
4. Satisfaction
On Table 21. (see Appendix 12.), regarding DM, we see that generation Z is the generation that shows the greatest level of satisfaction with their current pay-TV service (M=3.91) and Millennials are the ones that show the lowest (M=3.10).
Nonetheless, the present results do not show statistically significant differences between generations (p > 0.05).
Respondents from Generation X are the ones that show the greatest level of dissatisfaction with the hypothetical situation of not having pay-TV channels (M=3.61), while Millennials show the lowest (M=2.67). The observed differences are significant (F(3,72)=3.989; p=.011).
Respondents belonging to the Baby boomer generation show the greatest level of dissatisfaction (M=4.00) with the statement “I would be unsatisfied if there were no Streaming platforms available”, while respondents belonging to generation X show the lowest (M=3.23).
Nonetheless, the present results do not show statistically significant differences between generations (p > 0.05).
Respondents belonging to the Baby boomer generation show the greatest level of satisfaction (M=4.00) regarding the statement “I would be satisfied if there were only Streaming platforms and no pay-TV channels”, while respondents belonging to generation X show the lowest (M=2.62).
38 Nonetheless, there are no significant differences between the four generations regarding their level of agreement with the statement “I would be satisfied if there were only Streaming platforms and no pay-TV channels” (p > 0.05).
On Table 22., regarding NDM, we see that there are no significant differences between the generations regarding their level of agreement with neither of the statements (p > 0.05). See Appendix 25. – graphics 12, 13, 14 and 15.
5. Content
5.1 Information Value
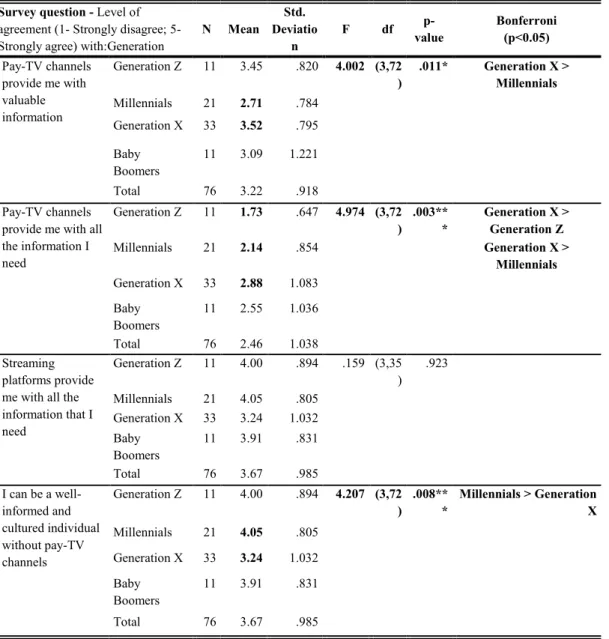
On Table 23. (see Appendix 13.), regarding DM, we see that there are significant differences between generations relative to their level of agreement with the statement “Pay-TV channels provide me with valuable information” (F(3,72)=4.002; p=0.011). Respondents from generation
X show greater levels of agreement (M=3.52) than Millennials (M=2.71).
Regarding the statement “Pay-TV channels provide me with all the information I need”, there are also significant differences (F(3,72)=4.974; p=0.003). Respondents from generation X
reveal greater levels of agreement (M=2.88) than Millennials (M=2.14) and respondents from generation Z (M=1.73).
Regarding the statement “Streaming platforms provide me with all the information that I need” there are no significant differences between generations (p > 0.05).
Regarding the statement “I can be a well-informed and cultured individual without pay-TV channels”, there are also significant differences (F(3,72)=4.207; p=0.008). Millennials show
greater levels of agreement (M=4.05) than respondents from generation X (M=3.24).
On Table 24., regarding NDM, we see that there are no significant differences between generations (p > 0.05).