CLINICAL ARTICLE
Risk factors associated with urinary incontinence in Portugal and the quality of life of affected women
Maria O. P. Amaral *, Emília C. Coutinho, Paula A. A. B. Nelas, Cláudia M. B. Chaves, João C. Duarte
Escola Superior de Saúde de Viseu, CI&DETS, Instituto Politécnico de Viseu, Viseu, Portugal
* Corresponding author: Maria Odete Pereira Amaral
Rua D. João Crisóstomo Gomes de Almeida, no. 102, 3500–843 Viseu, Portugal. Tel.: +351 232419100; fax: +351 232428343.
E-mail address: mopamaral@gmail.com
Keywords: Portugal; Quality of life; Risk factors; Urinary incontinence
Synopsis: Urinary incontinence is associated with multiple risk factors in women
ABSTRACT
Objective: To identify risk factors for urinary incontinence (UI) and assess the quality of life (QoL) of affected women.
Methods: A cross-sectional study was conducted of all women with UI who attended the urology and gynecology services of four hospitals in central Portugal between March and December 2012. Information was obtained from participants using the questionnaires assessing sociodemographic, obstetric, gynecologic, and lifestyle variables.
Results: Among 505 participants, 351 (69.5 %) had urgency UI, 107 (21.2%) stress UI, and 47 (9.3 %) mixed UI. Stress UI was associated with smoking, alcohol consumption, constipation, gravidity, parity, and vaginal infections (p<0.02 for all). Urgency UI was associated with age above 50 years, employment, smoking, and sitting for 2 hours or less per day (p≤0.02 for all). Mixed UI was associated with smoking and age 50 years or younger, smoking, sitting for 2 hours or less per day, and frequently carrying more than 3 kg in weight (p<0.001 for all). A negative impact on QoL was reported by 501 (99.2%) women. Compared with younger participants, women older than 50 years presented with more sleep/energy disturbances and performance limitations (p≤0.04 for all).
Conclusion: UI is associated with several risk factors and has a negative impact on QoL. Appropriate investigation regarding the factors associated with the types of UI should be performed to diminish its impact on QoL.
1. Introduction
Urinary incontinence (UI) is defined by the International Continence Society as “the complaint of any involuntary leakage of urine” or as “urine leakage seen during examination” [1]. This definition is suitable for epidemiological studies, but UI could be further defined as urgency, stress, or mixed UI, on the basis of a patient’s symptoms [2].
It is estimated that UI problems affect approximately 200 million people worldwide [3]. Although prevalent among elderly people, UI is not unique to this age group [4]. The prevalence of UI varies considerably, with values ranging from 18% to 42% of women and from 7% to 13% of men in two European studies [4,5]. The Portuguese National Institute of Health estimated that 342 353 individuals were experiencing UI in Portugal in 1995, including 92 513 men (2.6% of the male population) and 249 840 women (5.8%) [6]. According to the Portuguese Urology Association, women are affected the most by urinary leakage, with 33% of women and 16% of men older than 40 years being currently afflicted with UI symptoms [7]. Epidemiological studies conducted on UI show that the condition is two to three times more common in women [7]. Stress UI is the most prevalent type, especially in women aged between 45 and 65 years [8].
UI has a substantial impact on women’s physical and psychological well-being, socioeconomic status, and hygiene [9]. The effects on quality of life (QoL) have been variable in some studies [10], although most investigations have indicated a negative impact [11,12]. The effects on QoL could vary according to the type of UI [11,13].
Despite its prevalence and impact, this condition remains largely unrecognized, with women being underdiagnosed and undertreated [14]. Consequently, a high proportion of individuals do not benefit from the medical care that would resolve or alleviate their problem [14]. Despite the discomfort caused by UI, some individuals with this disorder do not seek medical care because of a belief that it is a normal physiological condition or embarrassment [15,16].
Epidemiological studies have shown an association between UI and several risk factors, including age, parity, mode of delivery, neonate birth weight, gravidity, menopause, overweight, obesity, and some medical comorbidities (particularly diabetes) [4,17,18]. Associations with other factors have been less consistent, with conflicting data on the possible role of education, hysterectomy, constipation, and smoking in the development of incontinence [4,18,19].
The aim of the present study was to investigate the factors increasing the risk of UI in the central region of Portugal. Additionally, the effects of UI on women’s QoL were investigated.
2. Materials and methods
As part of a cross-sectional study, the files of all women attending the urology and gynecology services of four hospitals in the central region of Portugal (Viseu, Covilhã, Guarda e Agrupamento de Centros de Saúde Dão Lafões II) between March 1st and December 31th, 2012, were consulted to identify women with UI. Women who had reported episodes of urinary leakage at least once a week for 3 months were contacted and asked to participate in the present study. Women were excluded if they were pregnant or breastfeeding, or had undergone gynecologic surgery at any point in their lives. The study was authorized by the ethics review
boards of the health centers and hospitals involved; the National Commission for Data Protection provided authorization (CNPD ref: 20.789.050). Informed consent was obtained from all included patients.
Information was obtained from participants using the King’s Health Questionnaire (KHQ) and the International Consultation on Incontinence Questionnaire Short Form (ICIQ-SF). Both questionnaires were administered through a face-to-face interview and assessed sociodemographic, obstetric, gynecologic, and lifestyle variables. The KHQ assesses QoL from the perspective of individuals affected by a disease. The KHQ used in the present study was validated for the Portuguese population, and specifically for the central region, by the University of Coimbra [20]. It was categorized into nine dimensions: general health perception, impact of incontinence, performance limitations, physical limitations, social limitations, personal limitations, emotional problems, sleep/energy disorders, and severity measures. The first part of the KHQ addresses the general perception of health and the impact of incontinence; the second part addresses the remaining six dimensions. The KHQ provides a score, ranging from 0–100, for each of its domains; the higher the score, the worse the QoL. Scores of 50 or below were deemed to indicate high QoL, 51–66 moderate QoL, and 66 or above poor QoL.
The ICIQ-SF scale assesses the impact of incontinence on the QoL of women with UI and has been validated for the Portuguese population [21]. The ICIQ-SF consists of four questions that assess the frequency (0–5 points), severity (0–6 points), and impact of UI (0–10 points) as well as the situations or causes leading to UI (0-7 points). The overall ICIQ-SF score is the sum of the scores in questions one, two and three, and ranges from 0–21. Higher values are associated with high levels of impact of UI. The impact on QoL was defined according to the score of question 3: a
score of 0 indicated no impact, 1–3 mild effects, 4–6 moderate effects, 7–9 severe effects, and 10 very severe effects.
The data were analyzed using the SPSS version 21.0 (IBM, Armonk, NY, USA). Crude odds ratios (ORs) with 95% confidence intervals (CIs) were used to measure the strength of association between variables. The Student t test was used to compare continuous variables. P<0.05 was considered statistically significant.
3. Results
A total of 505women participated. The mean age of the included patients was 53.34±11.58 years (range 29–75 years).Most lived in urban areas and were married or in a de facto union, but two-fifths of participants had attended only primary school (≤4 years of schooling) and more than half were not employed (Table 1). Four (0.8%) women had no previous deliveries.
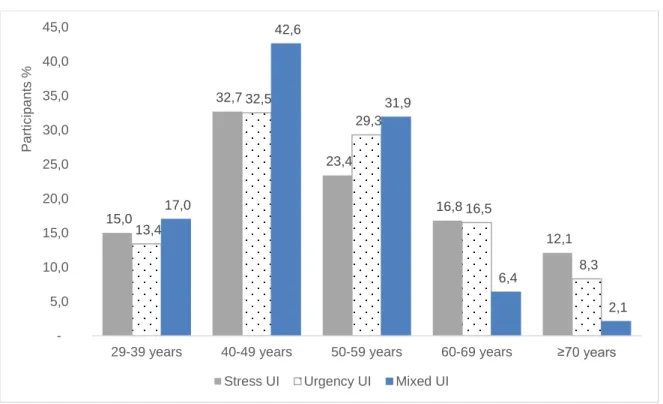
Overall, 351 (69.5%) were diagnosed with urgency UI, 107 (21.2%) with stress UI, and 47 (9,3%) had mixed UI. Generally, the proportion of women with urgency or mixed UI increased with age (Figure 1). Nevertheless, compared with women aged 50–59 years, the frequencies of urgency and mixed UI were lower among women aged 60–69 years, with a concurrent increase in stress UI (Figure 1). In all age groups, stress UI was the most prevalent type.
On average, women had experienced UI for 6.13 ± 6.24 years. When asked whether the beginning of urine leakage episodes marked a defined point in their lives, 123 (24.4%) responded affirmatively. Regarding hygiene measures, 417 (82.6%) women stated that they use absorbent pads; on average, they used 3.09 ± 1.84 pads in 24 hours.
Stress UI was associated with smoking, alcohol consumption, and defecating only every few days (Table 2). Urgency UI and mixed UI were associated with employment and smoking. The likelihood of urgency UI was reduced among women aged 50 years or younger or who spent more than 2 hours seated per day. Additionally, the likelihood of mixed UI was reduced among women aged 50 years or younger, who spent more than 2 hours a day seated, and who frequently carried more than 3 kg.
As for gynecologic and obstetric variables, stress UI was associated with gravidity, parity, and frequent vaginal infections (Table 3). Gravidity was also associated with mixed UI. No association was found between gynecologic and obstetric variables and urgency UI.
When questioned regarding their current health status on the KHQ, only 1 (0.2%) woman indicated that she viewed her current health status as very good; 75(14.9%), 336 (66.5%), 91 (18.0%), and 2 (0.4%) deemed it as good, normal, bad, and very bad, respectively. When assessing global QoL on the KHQ score) 211 (44.2%) women reported a poor QoL, whereas 175 (34.7%) and 91 (19.1%) indicated a high and moderate QoL, respectively. Overall, the 269 women older than 50 years reported a worse QoL (KHQ score 60.51 ± 21.91) than did the 236 aged 50 years or younger (56.14 ± 20.88; P=0.02). Regarding individual dimensions of the KHQ scale, compared with women aged 50 years or younger, women older than 50 years had a better health perception score (27.45 ± 29.19 vs 34.21 ± 23.37; p= 0.005), more limitations in performance (65.18 ± 28.65 vs 58.26 ± 27.40; p=0.006), more sleep/energy disturbances (47.89 ± 27.30 vs 42.54 ± 29.03; p=0.03), and fewer severity measures (59.36 ± 27.74 vs 64.51 ± 30.49; p=0.04). In the remaining
dimensions, the differences were not statistically significant. Regarding the impact of UI on QoL (ICIQ-SF), only 4 (0.8%) reported that the condition did not impact on their QoL, whereas 27(5.3%), 105(20.8%), 203 (40.2%), and 166 (32.9%) indicated a mild, moderate, serious, and very serious impact, respectively. Further, women with stress UI reported a higher impact than women with urgency UI (57.07 ± 53.21 vs 18.42 ± 18.14; P=0.003).
With regard to the impact of UI as a function of age, 94 (39.8%) women aged 50 years or younger indicated that UI had a very serious impact on their QoL, compared with 72 (26.8%) women aged older than 50 years (Figure 2). UI was deemed to have had a serious impact by 123 (45.7%) women aged older than 50 years, compared with 80(33.9%) women aged younger than 50 years.
4. Discussion
The present results indicate that UI has a negative impact on the QoL of women and that the different types of UI are associated with several sociodemographic, gynecologic, obstetric, and lifestyle variables.
Women affected by UI in the present study were aged 29–75 years. Women of all ages can be affected by UI, although the disorder is most common in middle-aged women because of the physiological changes associated with aging and lifestyle choices [8]. Additionally, it is possible that older women are less likely to discuss some health problems with others than are younger women, meaning they are less likely to obtain treatment.
Further, the proportions of women with urgency and mixed UI were highest among women aged 70 years or older. These observations could be attributed to physiological factors or cumulative effects associated with lifestyle; nevertheless, the
exact reasons remain unclear. UI might be associated with age-related abnormalities in neurological control, with obstruction or premature activation of the micturition reflex. Indeed, a study of 83 355 women aged 37–54 years reported that women aged 50–54 years had a higher risk of UI than did women younger than 40 years (OR 1.81; 95% CI 1.66–1.97) [22].
Previous studies [7,18,22,23] have identified several potential sociodemographic, gynecologic, and obstetric factors that are associated with UI, including age, ethnic origin, body mass index (BMI, calculated as weight in kilograms divided by the square of height in meters), parity, smoking, alcohol, coffee consumption, diabetes mellitus, hysterectomy, a family history of incontinence, urinary tract infections, and delivery of a neonate of weighing more than 4 kg. In agreement, the present study indicated an association between stress UI and smoking, alcohol consumption, constipation, gravidity, parity, and vaginal infections. Urgency UI was associated with age, employment status, smoking, and the number of hours spent sitting per day. Mixed UI was associated with age, employment status, smoking, number of hours spent sitting per day, the frequent carrying of heavy objects, and gravidity.
In a study conducted in China [23], the factors associated with UI were age, marital status, excess weight, income, education, residence, work (non-manual), lack of physical exercise, heart disease, nervous system disease, diabetes, constipation, alcohol drinking, smoking, consumption of high-fat foods, age at menopause, prolonged labor, respiratory disease, being a multigravida, urinary tract infections, and mode of delivery. A study in the USA [22], which included women aged 37– 54 years, showed that UI was associated with BMI (BMI 25–29: OR 1.52, 95% CI 1.43–1.62; BMI ≥30: OR 3.10, 95% CI 2.91–3.30), diabetes mellitus type 2 (OR 1.30; 95% CI 1.20–1.41), hysterectomy (OR 1.59; 95% CI 1.45–1.73), parity (1 child: OR
1.48, 95% CI 1.36–1.60; 2 children: OR 1.67, 95% CI 1.57–1.79; and ≥3 children: OR 1.69, 95% CI 1.58–1.82), and smoking (OR 1.34; 95% CI 1.25–1.45). The risk of mixed UI has been reported to be almost three times higher for obese women and twice as high for overweight women than for women with a BMI under 25; thus, a higher BMI is generally considered a risk factor for UI [24]. Indeed, a positive association between BMI and UI has been observed in other cross-sectional studies of middle-aged women. In the Women’s Health Australia project, among 14 070 women aged 45–50 years, obese women (BMI 30–40) had an increased risk (OR 2.05; 95% CI 1.70–2.46) of UI compared with women with a normal BMI (<20) [25]. Finally, in the present study, smoking was associated with all types of UI, despite not always being identified as such in previous studies [7].
In addition to the risk factors associated with UI, its effect on women’s QoL should also be addressed. In the current study, 44.2% of women reported a poor QoL. A literature review conducted in Turkey [26] indicated that women with UI reported having a poor to moderate QoL; indeed, only 0.8% stated that UI exerted no impact on their QoL, whereas 5.3%, 20.8%, 40.2%, and 32.9% reported a mild, moderate, serious, and very serious impact, respectively. In line with these findings, most epidemiological studies recognize that UI has a negative impact on women’s QoL [11,12,26]. A recent study conducted on a sample of 1050 women with a mean age of 48.80 ± 11.53 years [7] revealed that most women (95.5%) stated that UI had a negative impact on their QoL, whereas 36.3%, 28.6%, 26.9%, and 3.6% reported a slight, moderate, serious, and very serious impact, respectively.
Despite its interesting findings, the present study has some limitations. Because of its cross-sectional design, it was not possible to establish a cause and effect
relationship. Further, the sample size (n=505) did not produce statistically significant differences for some of the factors analyzed.
In conclusion, UI is an important public health issue triggered by a multitude of factors. It commonly occurs as mixed UI in association with distinct risk factors. UI affects a woman’s well-being and has a negative impact on her QoL. Thus, identifying the factors associated with the various types of UI is a key step to establishing causality and developing interventions for the prevention of UI and enhancement of QoL.
Acknowledgments
The present study was funded by the Portuguese Foundation for Science and Technology through the project PEst-OE/CED/UI4016/2014 and by the Center for Studies in Education, Technologies, and Health.
Conflict of interest
References
[1] Abrams P, Cardozo L, Fall M, Griffiths D, Rosier P, Ulmsten U, et al. The standardisation of terminology of lower urinary tract function: report from the Standardisation Sub-committee of the International Continence Society. Neurourol Urodyn 2002;21(2):167–78.
[2] Abrams P, Andersson KE, Brubaker L, Cardozo L, Cottenden A, Denis L, et al. 3rd International Consultation on Incontinence. Recommendations of the International Scientific Committee: Evaluation and Treatment of Urinary Incontinence, Pelvic Organ Prolapse and Faecal Incontinence. http://www.ics.org/Publications/ICI_3/v2.pdf/summary.pdf. Published 2005. Accessed June 15, 2014.
[3] World Health Organization Calls First International Consultation on Incontinence. Press Release, Geneva: WHO, 1998.
[4] Irwin DE, Milsom I, Hunskaar S, Reilly K, Kopp Z, Herschorn S, et al. Population-based survey of urinary incontinence, overactive bladder, and other lower urinary tract symptoms in five countries: results of the EPIC study. Eur Urol 2006;50(6):1306–15.
[5] Diokno AC, Estanol MV, Ibrahim IA, Balasubramaniam M. Prevalence of urinary incontinence in community dwelling men: a cross sectional nationwide epidemiological survey. Int Urol Nephrol 2007;39(1):129–36.
[6] Silva MJE. Sexual satisfaction and self-concept of women with urinary incontinence [master’s thesis]. Lisbon, Portugal: Faculdade de Medicina da Universidade de Lisboa; 2008.
[7] Sensoy N, Dogan N, Ozek B, Karaaslan L. Urinary incontinence in women: prevalence rates, risk factors and impact on quality of life. Pak J Med Sci 2013;29(3):818–22.
[8] Portuguese Association of Urology. Urinary incontinence. http://www.apurologia.pt/incontinencia/incontinencia_2013/Dossier_Imprensa_Incont inencia_Urinaria.pdf. Published 2013. Accessed July 18, 2014.
[9] Cerruto MA, D'Elia C, Aloisi A, Fabrello M, Artibani W. Prevalence, incidence and obstetric factors' impact on female urinary incontinence in Europe: a systematic review. Urol Int 2013;90(1):1–9.
[10] Minassian VA, Devore E, Hagan K, Grodstein F. Severity of urinary incontinence and effect on quality of life in women by incontinence type. Obstet Gynecol 2013;121(5):1083–90.
[11] Coyne KS, Kvasz M, Ireland AM, Milsom I, Kopp ZS, Chapple CR. Urinary incontinence and its relationship to mental health and health-related quality of life in men and women in Sweden, the United Kingdom, and the United States. Eur Urol 2012;61(1):88–95.
[12] Lasserre A, Pelat C, Guéroult V, Hanslik T, Chartier-Kastler E, Blanchon T, et al. Urinary incontinence in French women: prevalence, risk factors, and impact on quality of life. Eur Urol 2009;56(1):177–83.
[13] Frick AC, Huang AJ, Van den Eeden SK, Knight SK, Creasman JM, Yang J, et al. Mixed urinary incontinence: greater impact on quality of life. J Urol 2009;182(2):596–600.
[14] Silva P, Mateus P, Barros H. Prevalence and severity of urinary incontinence in women from Porto. Rev Epidemiol 1999;13(Supl 5):16–9.
[15] Guzelsoy M, Demirci H, Coban S, Belkiz Güngör B, Ustunyurt E, Isildak S. Impact of urinary incontinence on quality of life among residents living in Turkey. Urol J 2014;11(2):1447–51.
[16] Jaunin-Stalder N, Lagro-Janssen AL. Urinary incontinence: neither men nor women should be forgotten. Rev Med Suisse 2013;9(395):1535–7.
[17] Dolan LM, Hilton P. Obstetric risk factors and pelvic floor dysfunction 20 years after first delivery. Int Urogynecol J 2010;21(5):535–44.
[18] Menezes M, Pereira M, Hextall A. Predictors of female urinary incontinence at midlife and beyond. Maturitas 2010;65(2):167–71.
[19] Waetjen LE, Liao S, Johnson WO, Sampselle CM, Sternfield B, Harlow SD, et al. Factors associated with prevalent and incident urinary incontinence in a cohort of midlife women: a longitudinal analysis of data: study of women's health across the nation. Am J Epidemiol 2007;165(3):309–18.
[20] Gabriel C, Lopes A, Ferreira PL, Gonçalves R. King’s Health Questionnaire,
validation for the Portuguese population RIMAS.
http://www.uc.pt/org/ceisuc/RIMAS/Lista/Instrumentos/KHQ. Accessed July 15, 2014.
[21] Tamanini JT, Dambros M, D'Ancona CA, Palma PC, Rodrigues Netto N Jr. Validation of the "International Consultation on Incontinence Questionnaire -- Short Form" (ICIQ-SF) for Portuguese. Rev Saude Publica 2004;38(3):438–44.
[22] Danforth KN, Townsend MK, Lifford K, Curhan GC, Resnick NM, Grodstein F. Risk factors for urinary incontinence among middle-aged women. Am J Obstet Gynecol 2006;194(2):339–45.
[23] Liu B, Wang L, Huang SS, Wu Q, Wu DL. Prevalence and risk factors of urinary incontinence among Chinese women in Shanghai. Int J Clin Exp Med 2014;7(3):686–96.
[24] Hunskaar S, Arnold EP, Burgio K, Diokno AC, Herzog AR, Mallett VT. Epidemiology and natural history of urinary incontinence. Int Urogynecol J Pelvic Floor Dysfunct 2000;11(5):301–19.
[25] Chiarelli P, Brown W, McElduff P. Leaking urine: prevalence and associated factors in Australian women. Neurourol Urodyn 1999;18(6):567–77.
[26] Basak T, Kok G, Guvenc G. Prevalence, risk factors and quality of life in Turkish women with urinary incontinence: a synthesis of the literature. Int Nurs Rev 2013;60(4):448–60.
Figure legends
Fig.1. Type of UI according to age. Abbreviation: UI, urinary incontinence.
Fig. 2. Impact of urinary incontinence on women’s quality of life measured on the International Consultation on Incontinence Questionnaire Short Form, according to age.
15,0 32,7 23,4 16,8 12,1 13,4 32,5 29,3 16,5 8,3 17,0 42,6 31,9 6,4 2,1 5,0 10,0 15,0 20,0 25,0 30,0 35,0 40,0 45,0
29-39 years 40-49 years 50-59 years 60-69 years ≥70 years
Pa rti c ip a n ts %
Stress UI Urgency UI Mixed UI
1,4 7,2 18,2 33,9 39,8 0,7 3,7 23,0 45,7 26,8 0,8 5,3 20,8 40,2 32,9 0 5 10 15 20 25 30 35 40 45 50
Without impact Mild impact Moderate impact Serious impact Very serious
impact Pa rti c ip a n ts , %
Table 1 Demographic characteristics (n=505). Characteristics No. (%) Age, y 29-39 year 58 (11.5) 40-49 year 148 (29.3) 50-59 year 146 (28.9) 60-69 year 90 (17.8) 70-75 year 63 (12.5) Schooling Primary 202 (40.0) Secondary 233 (46.1) Higher education 70 (13.9) Marital status Single 19 (3.8) Married/civil union 423 (83.8) Divorced/separated 33 (6.5) Widow 30 (5.9) Area of residence Village 183 (36.2) Town 176 (34.9) City 146 (28.9) Employment status Employed 239 (47.3) Unemployed/retired 266 (52.7)
Table 2 Sociodemographic and lifestyle variables associated with UI.a
Stress UI (n=107) Urgency UI (n=351)
Mixed UI (n=47) Age, y
>50 Ref. Ref. Ref.
≤50 0.84 (0.55–1.26) 0.64(0.45–0.92)** 0.53(0.36–0.79)*
Academic qualifications
Higher education Ref. Ref. Ref.
Primary/secondary 1.66 (1.00–2.90) 1.00(0.59–1.69) 0.82(0.48–1.43) Marital status
Single, separated, divorced, or widowed
Ref. Ref. Ref.
Married/civil union 1.09 (0.62–1.88) 0.77 (0.47–1.24) 0.94(0.56–1.59) Area of residence
Urban Ref. Ref. Ref.
Rural 1.43 (0.92–2.22) 1.19 (0.82–1.73) 1.44(0.98–2.14)
Employment status
Unemployed/retired Ref. Ref. Ref.
Employed 0.68 (0.45–1.04) 1.67 (1.16–2.41)* 1.52(1.03–2.26)
Body mass index
18.5 BMI 24.9 Ref. Ref. Ref.
≥25.0 BMI 1.53 (1.00–2.35) 1.45 (0.97–2.16) 1.44(0.93–2.21)
Smoking
No Ref. Ref. Ref.
Yes 2.15 (1.26–3.68)** 2.79 (1.51–5.17)* 4.21(1.88–9.43)*
Participates in sports
No Ref. Ref. Ref.
Yes 0.85 (0.57–1.29) 0.92 (0.64–1.33) 0.84(0.57–1.24)
Alcohol consumption
No Ref. Ref. Ref.
Yes 2.43 (1.51–3.91)* 0.94 (0.60–1.45) 1.01(0.62–1.63)
Hours of sleep per day
>7 Ref. Ref. Ref.
≤7 0.92 (0.59–1.45) 1.16 (0.79–1.72) 1.14(0.75–1.74)
Defecation
Daily Ref. Ref. Ref.
>2 days 1.46 (1.01–2.30)* 1.14 (0.78–1.66) 1.15(0.77–1.73) Hours seated/day
≤2 Ref. Ref. Ref.
>2 1.34 (0.86–2.09) 0.64 (0.43–0.94)** 0.57(0.38–0.86)*
Frequently carry >3 kg in weight
No Ref. Ref. Ref.
Yes 0.76 (0.39–1.49) 0.60 (0.35–1.02) 0.47(0.27–0.80)*
Abbreviation: UI, urinary incontinence.
a
Values are given as odds ratio (95% confidence interval). * P<0.001; ** P=0.02
Table 3 Gynecologic and obstetric variables associated with UI.a
Stress UI (n=107) Urgency UI (n=351)
Mixed UI (n=47) Gravidity
<2 Ref. Ref. Ref.
≥2 2.48 (1.59–3.89)* 1.04 (0.68–1.58) 1.84 (1.12–
3.02)** Parity
<2 Ref. Ref. Ref.
≥2 2.24 (1.43–3.49)* 0.88 (0.59–1.34) 1.41 (0.88–2.24)
Neonate >4 kg in weight
No (371) Ref. Ref. Ref.
Yes (134) 1.35 (0.83–2.21) 1.15 (0.77–1.73) 0.93 (0.59–1.44)
Type of delivery
Normal (421) Ref. Ref. Ref.
Suction/forceps/cesarean (84)
0.85 (0.45–1.49) 1.14 (0.70–1.86) 0.95 (0.57–1.59) Frequent vaginal
infections***
No Ref. Ref. Ref.
Yes 1.79 (1.18–2.71)* 0.80 (0.56–1.16) 1.20 (0.81–1.80)
Abbreviation: UI, urinary incontinence.
a
Values are given as odds ratio (95% confidence interval). * P<0.001; ** P=0.02