The Determinants of Mutual Fund Performance:
A Cross-Country Study
∗
Miguel A. Ferreira
†NOVA School of Business and Economics
Aneel Keswani
Cass Business School
António F. Miguel
ISCTE-IUL
Sofia B. Ramos
ISCTE-IUL
This Version: January 2012
Abstract
We use a new data set to study the determinants of the performance of open-end actively managed equity mutual funds in 27 countries. We find that mutual funds underperform the market overall. The results show important differences in the deter-minants of fund performance in the U.S. and elsewhere in the world. The U.S. evidence of diminishing returns to scale is not an universal truth as the performance of funds located outside the U.S. and funds that invest overseas is not negatively affected by scale. Our findings suggest that the adverse scale effects in the U.S. are related to liq-uidity constraints faced by funds that, by virtue of their style, have to invest in small and domestic stocks. Country characteristics also explain fund performance. Funds lo-cated in countries with liquid stock markets and strong legal institutions display better performance.
JEL classification: G15; G18; G23
Keywords: Mutual funds; Performance; Economies of scale; Investor protection
∗We thank the editor, Burton Hollifield, an anonymous referee, Janis Berzins, Susan Christoffersen, Maria
do Céu Cortez, Nuno Fernandes, Wayne Ferson, Paulo Gama, Jenke Ter Horst, Massimo Massa, Pedro Matos, David Ng, Richard Payne, Jesper Rangvid, Henri Servaes, Clemens Sialm, Laura Starks, David Stolin and Russ Wermers; seminar participants at City University of London; and participants at the 2007 Western Finance Association Conference, 2007 Financial Management Association European Conference, 2007 Global Asset Management Conference at McGill, and 2008 ISCTE Annual Finance Conference for helpful comments. This research is supported by a grant from the Fundação para a Ciência e Tecnologia (PEst - OE/EGE/UI0315/2011).
†Corresponding author. Address: Faculdade de Economia, Campus de Campolide 1099-032 Lisboa,
1. Introduction
Mutual funds have come to play a dramatically increased role in financial markets in recent decades. As of the end of 2007, the world mutual fund industry managed financial assets exceeding $26 trillion (including over $12 trillion in stocks), more than four times the $6 trillion of assets managed at the end of 1996 (Investment Company Institute (2008)). The number of mutual funds has also grown dramatically, to more than 66,000 funds worldwide at the end of 2007 (including nearly 27,000 equity funds). Although the growth of the mutual fund industry started in the U.S., where the industry plays an extremely important role in financial markets, this trend has spread more recently to other countries around the world (Khorana, Servaes, and Tufano (2005)). The share of assets under management outside the U.S. grew from 38% in 1997 to 54% in 2007.
Investors are increasingly interested in mutual fund selection, demanding detailed mutual fund information and investment advice. Many authors have tried to explain the performance of mutual funds, which is a critical aspect in investor fund selection. Several fund charac-teristics have been analyzed as potential determinants of future fund performance, including fund size, age, fees and expenses, loads, turnover, flows, and returns.1 Most authors conclude
that mutual funds underperform the market, but some others find that managers display some skill. In particular, there is evidence of short-term persistence in funds’ performance and that money flows to past good performers. Investors display some fund selection ability as they tend to invest in funds with subsequent good performance (“smart money” effect). There is also evidence that fund performance worsens with fund size (Chen et al. (2004) and fees (Gil-Bazo and Ruiz-Verdu (2009)). Although the literature focuses on the U.S. mutual fund industry, several authors study fund performance in individual countries. Few, however, examine cross-country mutual fund performance.2
1See, for example, Jensen (1968), Grinblatt and Titman (1989), Ippolito (1989), Hendricks, Patel, and
Zeckhauser (1993), Brown and Goetzmann (1995), Malkiel (1995), Gruber (1996), Carhart (1997), Chevalier and Ellison (1997), Sirri and Tufano (1998), and Zheng (1999).
2See, for example, studies on Australia by Bird, Chin, and McCrae (1983); France by Dermine and
We study how the performance of equity mutual funds relates to fund characteristics and country characteristics around the world. To the best of our knowledge, we are the first to study mutual fund performance using a worldwide sample of funds. The sample consists of 16,316 open-end actively managed equity funds in 27 countries over 1997-2007. We focus on the sample of funds that invest in their local market (domestic funds), but we also perform some tests using funds that invest outside their local market or globally (international funds). We use the Carhart (1997) four-factor model to measure risk-adjusted performance, but we also consider several alternatives including benchmark-adjusted returns, market-adjusted returns, and the market model.
We study fund performance using an extensive list of fund characteristics, including fund and family size, age, fees and expenses, front-end and back-end loads, flows, past returns, management structure, and number of countries where a fund is sold. There are reasons to believe that there are important differences in the determinants of mutual fund performance between the U.S. and the rest of the world. U.S. funds are much larger than elsewhere in the world, and the U.S. fund industry is older and more developed. Our worldwide sample of mutual funds allows us to consider several country characteristics, such as economic development, financial development, quality of legal institutions and law enforcement, and mutual fund industry structure, as potential determinants of performance.
We first document that equity mutual funds around the world underperform on average by 20 basis points per quarter after fees and controlling for the Fama and French (1992) three factors and momentum. We find evidence of important differences in the determinants of mutual fund performance in the U.S. and elsewhere in the world. The most striking difference is related to the effects of scale. We find that small funds perform better than large only in the case of U.S. funds, as large non-U.S. funds perform better than smaller funds. The negative size effect in the U.S. is economically significant, as a one-standard Dahlquist, Engström, and Söderlind (2000); or the U.K. by Blake and Timmermann (1998). Grunbichler and Pleschiutschnig (1999) and Otten and Bams (2002) study European equity mutual funds, but their findings on performance are narrow because of both a small number of countries and funds.
deviation increase in fund size yields a 15 basis point decline in the next quarter’s fund return. The positive size effect outside the U.S. is also sizable. A one-standard deviation increase in fund size is associated with an increase in next quarter’s fund net return of 11 basis points. Additionally, fund size does not seem to hurt the performance of funds that invest overseas. We conclude that the U.S. evidence on diseconomies of scale (Chen et al. (2004)) is not a universal truth as non-U.S. funds and international funds do not seem to be affected by diminishing returns to scale.
Of course, U.S. funds are much larger on average than funds elsewhere in the world. The average U.S. fund is more than five times larger than the average non-U.S. fund.3
This fact, however, does not explain the asymmetric effect of scale on performance as U.S. funds of similar size to their non-U.S. counterparts also present a statistically significant negative relation between performance and lagged fund size. Our findings suggest that liquidity constraints play an important role in explaining the lack of scale-ability of fund investments as argued by Chen et al. (2004), Pollet and Wilson (2008), and Yan (2008). U.S. funds that, by virtue of their style, have to invest in small and illiquid stocks are the most affected by scale, while this is not the case for non-U.S. funds. Moreover, the performance of international funds is not negatively affected by scale even for those funds located in the U.S. It is important to note that U.S. international funds’ average total net assets (TNA) is similar to the U.S. domestic funds’ average TNA. This suggests that the availability of more investment opportunities in funds that invest overseas mitigates the adverse scale effects. In other words, international funds are not restricted geographically in investment opportunities as a fund grows, while domestic funds are restricted geographically.
These findings are informative about the relevance of the Berk and Green (2004) model around the world. The Berk and Green (2004) model assumes that funds operate in a decreasing return to scale environment, which means that fund flows harm rather than improve subsequent fund performance. Our findings that diminishing returns to scale may 3There are only nine non-U.S. funds among the top 100 domestic equity funds in terms of total net assets
not be present outside of the U.S. mutual fund industry suggest that fund flows may not eliminate performance persistence in the manner predicted by the Berk and Green (2004) model.
We also consider the effect of the size of the fund family on fund performance around the world. Many funds belong to large fund families and some of these families manage funds in several different countries (examples of top fund families are American Funds, Barclays, Fi-delity, and UBS). Controlling for fund size, we find that fund performance actually improves with the size of its fund family, as large fund families benefit from substantial economies in trading commissions and lending fees. Chen et al. (2004) find similar evidence for U.S. funds. We also test the hypothesis that organizational diseconomies, in particular hierarchy costs (Aghion and Tirole (1997) and Stein (2002)), erode fund performance. Large organizations with hierarchies are particularly inefficient in processing soft information, which is pivotal in the case of mutual funds, as managers may have a hard time convincing others to implement their ideas. Consistent with this view, we find evidence that solo-managed funds perform better than team-managed funds in a worldwide sample of funds, which is consistent with the U.S. evidence in Chen et al. (2004).
Other fund characteristics have a variety of effects on performance. Fund age is negatively related to fund performance in the sample of non-U.S. funds, but this relation is statistically insignificant in the sample of U.S. funds. This indicates that younger funds are better able to detect good investment opportunities outside the U.S. We also examine the effects on fund performance of past performance and flows. We find evidence of short-run persistence in fund performance, but only in the case of U.S. funds. The evidence on persistence is consistent with the U.S. evidence (e.g., Hendricks, Patel, and Zeckhauser (1993) and Grinblatt and Titman (1994)). Investors outside the U.S. seem to have some ability to select funds, as money flows to funds with good future performance. We find, however, that the “smart money” effect is statistically insignificant in the sample of U.S. funds. This is consistent with the U.S. evidence in Sapp and Tiwari (2004) that the “smart money” effect is explained by
momentum.
A unique feature of our study is that we can investigate the effect of country characteris-tics on fund performance. We find country characterischaracteris-tics to have predictive power beyond fund characteristics. There is a strong positive relation between the performance of mutual funds and a country’s level of financial development. In particular, funds perform better in countries with high trading activity and low trading costs. Finally, we find that funds domiciled in countries of common-law tradition perform better. Investor protection and law enforcement have a statistically significant and positive effect on fund performance. Our findings show that country-level investor protection is a critical determinant of the perfor-mance of the mutual fund industry across countries in addition to the size and fees of the industry (Khorana, Servaes, and Tufano (2005) and (2009)).
The remainder of the paper is organized as follows. Section 2 describes the data and the performance benchmarks. In Section 3 we present our empirical findings. Section 4 concludes.
2. Data and Methodology
In this section, we first describe our sample, then we describe the methods for computing abnormal performance and finally we present fund and country characteristics.
2.1. SAMPLE DESCRIPTION
Data on equity mutual funds come from the Lipper Hindsight database, which covers many countries worldwide in the 1997-2007 period. The database is survivorship bias-free, as it includes data on both active and defunct funds. Although multiple share classes are listed as separate funds in Lipper, they have the same holdings, the same manager, and the same returns before expenses and loads. We eliminate multiple classes of the same fund to avoid multiple counting of returns. We keep the share class that Lipper identifies as the primary
one. The initial sample includes 37,910 primary equity funds (both active and dead funds).4
We have checked the coverage of funds by Lipper with the aggregate statistics on mutual funds (European Fund and Asset Management Association (2008), EFAMA). Total numbers of equity funds reported by Lipper and the EFAMA are, respectively, 26,800 and 26,950 as of December 2007. Total net assets of equity funds (sum of all share classes) reported by Lipper and EFAMA are, respectively, $10.9 trillion and $12.5 trillion as of December 2007. Thus, our initial sample of equity funds covers 87% of the total net assets of worldwide equity funds. There is, however, some variation in coverage across countries. While Canada, Germany, Sweden, the U.K., and the U.S. have coverage above 90%, the coverage in Australia and France is roughly 60% and in Japan only 40%.5
We exclude off-shore funds (e.g., funds domiciled in Luxembourg or Dublin), closed-end funds, index-tracking funds, exchange-traded funds, and funds-of-funds. This gives a sample of 25,110 open-end actively managed equity funds from 34 countries. We require mutual funds to have data on total net assets (TNA), age, total expense ratios, front-end and back-end loads, flows, management team, the number of countries a fund is sold, and monthly total returns. We also require a fund to have at least two years of reported returns because we need to estimate fund factor loadings based on past fund returns. The final sample includes 16,316 funds in 27 countries (12,577 active funds and 3,739 dead funds as of December 2007). We believe this is the most comprehensive data set ever used to study mutual fund performance in terms of both number of funds and countries. The data set allows us to investigate the effect of both fund characteristics and country characteristics on performance.
The Lipper database provides information on a fund’s country of domicile and geographic investment focus. We use these data to classify funds in terms of their geographic investment 4The primary fund is typically the class with the highest total net assets (TNA). The primary class
represents more than 80% of the total assets across all share classes.
5There are 24,050 equity funds with a TNA of $10.2 trillion in Lipper if we exclude closed-end and
funds-of-funds. In this case our initial sample covers 82% of the TNA of equity funds worldwide. The EFAMA statistics are not entirely consistent across countries whether or not they include these type of funds.
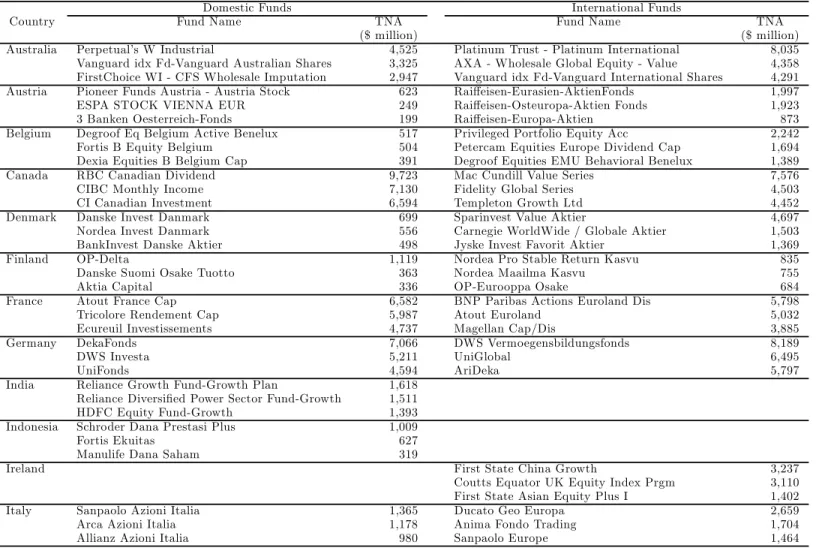
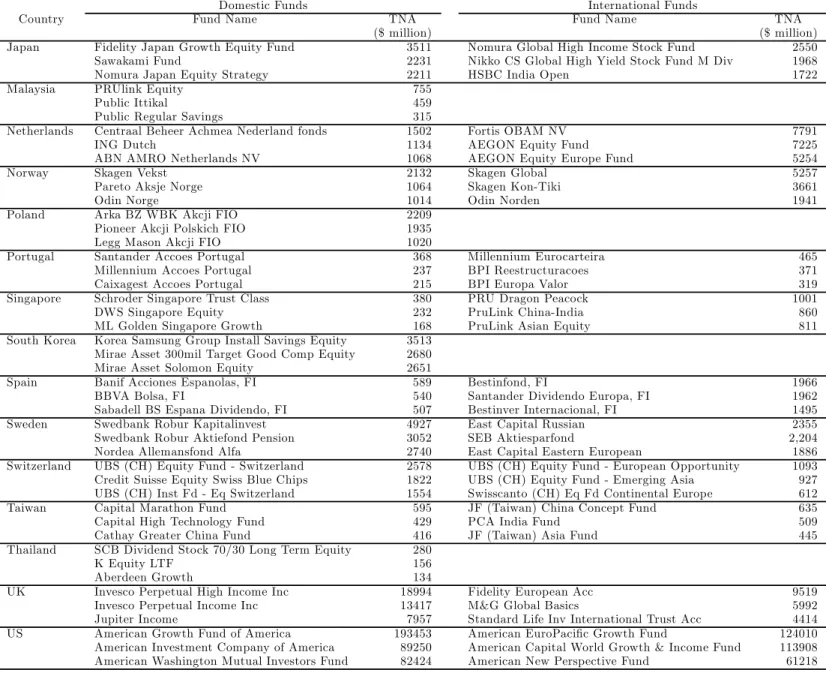
style: domestic funds (i.e., funds that invest in their domicile country) and international funds (i.e., funds that invest in countries or regions different from the one where they are domiciled, and funds that invest globally). We require a country to have more than ten funds to be included in the sample. The final sample covers 8,176 domestic funds and 8,140 international funds. Table A.1 in the Appendix lists the top three domestic and international funds by TNA in each country as of 2007.
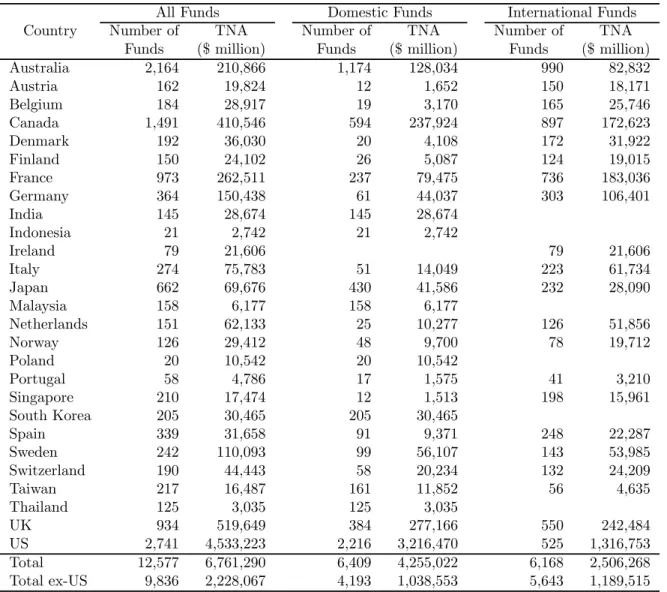
Table I presents the number and TNA of the sample of mutual funds by country as of 2007. TNA is given by the sum of all share classes when there are multiple share classes. There are a total of 12,577 equity funds in the sample in 2007, managing $6.7 trillion of assets. U.S. funds represent 67% of the sample in terms of TNA, but only 22% of the total number of funds. Other countries with a large number of funds are Australia and Canada, which account for 17% and 12% of the total number of funds.
A country’s weight in terms of number of funds is greater than its weight in terms of fund size for all countries except the U.S., indicating that on average non-U.S. mutual funds are much smaller than U.S. funds. The average fund in Europe is five times smaller than the average U.S. fund. This is also the case in Asia, where the average fund is nearly 17 times smaller than in the U.S. Overall, non-U.S. funds are more than seven times smaller than U.S. funds.
Table I also divides funds by geographic investment style. Domestic funds represent about half of the sample in terms of the number of funds and 63% in terms of TNA. Domestic funds are, on average, 1.6 times larger than international funds. The U.S. mutual fund industry is heavily weighted toward domestic funds, as they account for more than 80% of the number of the funds and more than 70% of the TNA in the U.S. International funds, however, are dominant in other countries like Australia, Canada, France, Germany, and the U.K.. For example, international funds in Australia, Canada, and France represent, respectively, 46%, 60%, and 76% of the number of funds and 39%, 42%, and 70% of the TNA. We conclude that U.S. investors prefer mutual funds that invest mainly in domestic stocks, while non-U.S.
investors exhibit less home bias as they invest a significant part of their stock portfolio in international funds.
2.2. MEASURING FUND PERFORMANCE
We estimate the mutual funds (risk-adjusted) performance using several benchmark models. Fama and French (1992) propose a three-factor model that improves average CAPM pricing errors by including size and book-to-market factors. Carhart (1997) proposes adding a factor that captures the Jegadeesh and Titman (1993) momentum anomaly. The four-factor model regression is given by:
= + 0+ 1 + 2 + 3 + (1)
where is the return in U.S. dollars of fund in excess of the one-month U.S. Treasury-bill
in month ; is the excess return in U.S. dollars on the market; (small minus big)
is the average return on the small-capitalization portfolio minus the average return on the large-capitalization portfolio; (high minus low) is the difference in return between
the portfolio with high book-to-market stocks and the portfolio with low book-to-market stocks; and (momentum) is the difference in return between the portfolio with the
past-12-month winners and the portfolio with the past-12-month losers.
The benchmark model in equation (1) nests several alternative benchmark models. The market model assumes 1 = 2 = 3 = 0 and market-adjusted returns further assume
that 0 = 1We also use benchmark-adjusted returns by taking the difference between the
fund return and its benchmark return as listed on Lipper. We present results using these alternatives in the robustness section.
We construct the monthly benchmark factors for each individual country using all stocks included in the Datastream/Worldscope database. The market return is computed using the value-weighted average return in U.S. dollars of all stocks in each country in each month. To form the size and book-to-market equity portfolios, we follow the procedure described in
Fama and French (1992).
We use monthly fund returns (net of expenses) denominated in U.S. dollars from July 1997 through December 2007 to estimate the factor models.6 We also present results using
gross returns in the robustness analysis. First, we estimate the time series regression of the monthly fund excess returns on the factor portfolios’ returns using the previous 36 months of data, every quarter (we require a minimum of 24 months of return data).7 We then subtract
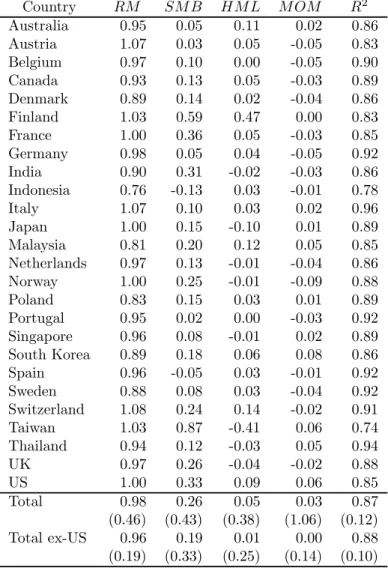
the expected return from the realized fund return to estimate the fund abnormal return in each quarter, or alpha, which is measured as a sum of an intercept of the model and the residual as in Carhart (1997). Alpha measures the manager’s contribution to performance due to stock selection or market timing. A positive (negative) alpha indicates that the fund overperforms (underperforms) the benchmark. Since we use three years of return data to estimate the factor model, our first estimate of a fund’s alpha is for the first quarter of 2000. Table II presents the average factor loadings for domestic funds by country and the associated 2 statistics from these regressions. We see that U.S. funds, on average, load more on SMB, HML and MOM than non-U.S. funds. So, U.S. funds play more small, value, and momentum stocks than non-U.S. funds.8 It is well known that the four factor model
works well in explaining the variation in U.S. mutual fund performance and our finding of an average 2 statistic for U.S. funds of 85% bears this out. Even though the four-factor
model was developed on U.S. data, its 2 outside the U.S. is even higher, at 88%. This
reassures us that the 4-factor model is an appropriate way to evaluate fund performance for our worldwide sample.
6Our primary findings are not affected when we use fund returns in local currency.
7There is look-ahead bias in our sample due to the exclusion of new funds that do not have enough
history for the regression analysis (see Brown at al. 1992).
8The comparatively high loading on for U.S. mutual funds might be explained by the historically
poor performance of the size factor outside the U.S. Indeed, across the countries in our sample the average fund loadings on across countries appear to line up with the magnitude of the average size premia.
2.3. FUND CHARACTERISTICS
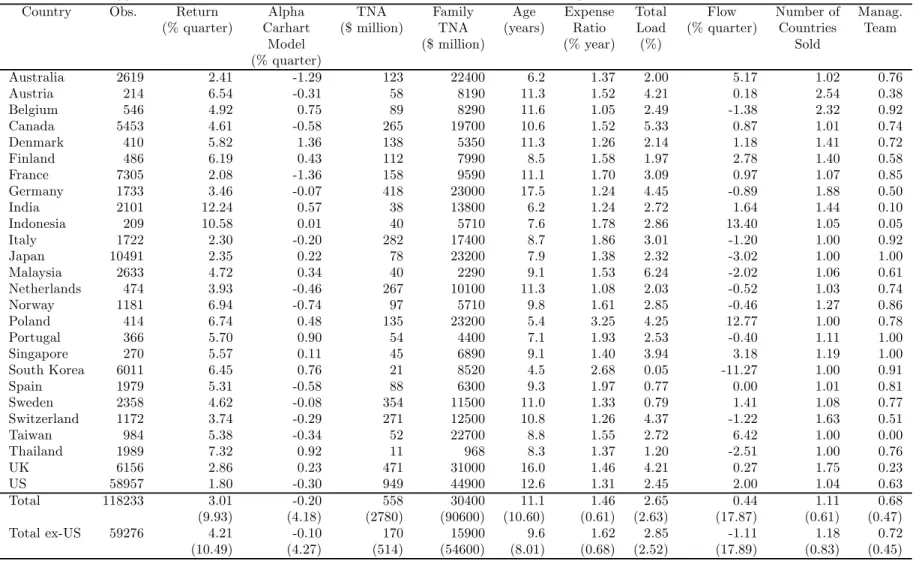
Table III reports averages of mutual fund returns and alphas for domestic funds by country. We winsorize returns and alphas at the bottom and top 1% level. The average fund return is 3.01% per quarter. We report average Carhart four-factor alphas. The fund alphas are negative for about half of the countries. The countries with the best performance are Den-mark, Thailand, and Portugal, while the countries with the worst performance are Norway, Australia, and France. U.S. funds are in the middle of the pack with an average alpha of -0.30% per quarter, which is consistent with the average alpha in Chen et al. (2004) for U.S. funds. Thus, there is evidence of underperformance in the worldwide mutual fund industry. The average alpha is -0.20% per quarter with a standard deviation of 4.18%. Overall, the figures here are consistent with other studies that find that fund managers do not have the ability to beat the market (or stay even with it) after fees (e.g., Malkiel (1995) and Gruber (1996)).
Table III also presents average fund characteristics by country. We winsorize the expense ratio, total loads, and flows at the bottom and top 1% level. Panel A of Table A.3 in the Appendix defines fund-level variables.
Fund size is measured by total net assets (TNA) in U.S. dollars. The U.S., the U.K., and Germany have the largest funds, while Thailand and South Korea have the smallest funds. U.S. funds have an average TNA of $949 million, followed by the U.K. with $471 million and Germany with $418 million. Overall, the average TNA in our sample of funds is $558 million. Outside the U.S., the average TNA of funds is only $170 million.
We also examine the effect on performance of the size of a fund’s family. Family size is measured as the sum of all equity funds under management by a particular company. We use the parent management company to calculate total equity assets under management. In the case of transnational fund companies we use the sum of all equity assets worldwide. Funds domiciled in the U.S., the U.K., Japan, Germany, Australia, and Canada are managed by the largest fund families. Interestingly, the average family fund size of funds domiciled in
Poland and Taiwan is also quite high, despite low individual fund size. This happens because funds in these two countries are part of large global fund families.
We use a host of other fund characteristics in our analysis of performance. The first characteristic is fund age as given by the fund launch date. The average fund age is about 11 years. Funds domiciled in Germany, Switzerland, the U.K., and the U.S. tend to be among the older ones. U.S. funds have an average age of 12.6 years.
The second characteristic is the total expense ratio, defined as total annual expenses as a fraction of TNA. In some countries where the expense ratio is not available we use the management fee. The average expense ratio is 1.46%. Expenses vary considerably across countries despite the global nature of the mutual fund industry. For example, average expense ratios are the lowest in Belgium (1.05%) and the Netherlands (1.08%), while they reach maximums of 3.25% in Poland and 2.68% in South Korea. U.S. funds present an average expense ratio of 1.30%, which is slightly higher than the ratio reported in other studies. The third characteristic is total loads defined as the sum of front-end and back-end loads. The average total load is 2.65%. Loads vary considerably across countries, U.S. funds present total loads similar to the overall average.
The fourth characteristic of interest is flows defined as the percentage growth in total assets under management (in local currency) between the beginning and the end of quarter , net of internal growth (assuming reinvestment of dividends and distributions):
=
− −1(1 + )
−1 (2)
where is total net assets in local currency of fund , and is fund return in local
currency. Funds have an average flow of 0.44% per quarter. The flows are positive in the majority of the countries (exceptions include, for example, Germany, Italy, Japan, and Switzerland).
tells us where fund investors are located. While in some countries like the U.S., funds are distributed only locally, in Europe it is common for a fund to be sold in more than in one country. The average number of countries where a fund is sold is 1.1 for domestic funds, but we can find some countries where it is common that a fund is sold in several countries (e.g., Austria, Belgium, Germany, Sweden, and the U.K.).
Finally, we consider management structure as a potential determinant of fund perfor-mance. Lipper provides a field listing names of managers in charge of a fund. We use a dummy variable (management team) that takes a value of one if the number of managers is greater than one or the fund is listed as team-managed or by the name of the management company, and zero if the fund is managed by a single manager. This variable identifies the organizational structure influencing the decision-making process of the fund, and it may help to explain fund performance. Funds tend to be managed by teams in countries such as Aus-tralia, Canada, France, and Japan. Management by teams is less common in Germany and the U.K.. In the U.S., 63% of the funds are managed by teams (or more than one person), which is consistent with figure reported in Massa, Reuter, and Zitzewitz (2010). Overall, 68% of the funds are managed by teams (or more than one person).
2.4. COUNTRY CHARACTERISTICS
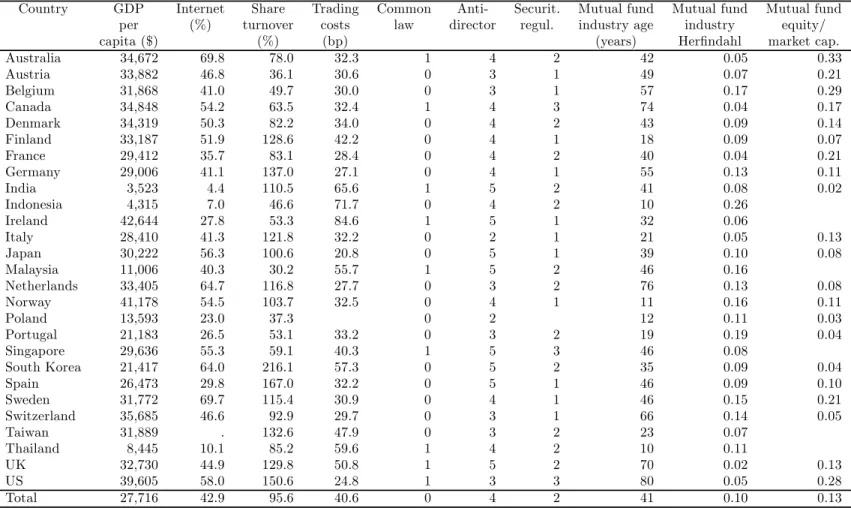
Our sample of equity mutual funds includes 27 countries. This large cross-section of coun-tries allows us to examine the role of the fund’s domicile country characteristics in explaining fund performance. To our knowledge, this feature is unique to our study of mutual fund per-formance around the world. We use several country-level variables as explanatory variables that are classified into five groups: economic development; financial development; investor protection and quality of legal institutions; mutual fund industry development and concen-tration. Table IV reports averages for the country-level variables. Panel B of Table A.3 in the Appendix presents the country-level variables definitions.
World Development Indicators (WDI) database as a measure of economic development. An additional measure of economic development is the ratio between number of internet users and the population of a particular country, taken from WDI. The intensity of internet usage is likely to be higher in countries with better informed investors and more sophisticated investors.
We use two proxies for level of stock market development and liquidity. First, the share turnover ratio, defined as the ratio of total value of stocks traded to market capitalization. This variable is from the WDI database. The second variable is country-level trading costs in basis points. We use the annual average transaction cost (including commissions, fees, and price impact) from the Global Universe Data-ElkinsMcSherry database. Countries with less developed markets are countries with higher trading costs (Malaysia, India, Thailand, South Korea, and Taiwan), while more developed markets like the U.S. and Japan have lower trading costs.
We consider three variables to proxy for investor protection and quality of legal institu-tions. The first proxy for investor protection is a dummy variable that equals one if the legal origin is common law, and zero if the legal origin is civil law. Common law systems provide better legal protection to investors than civil law systems (see La Porta et al. (1997)). In our sample we have nine countries with common law legal origin (Australia, Canada, India, Ire-land, Malaysia, Singapore, ThaiIre-land, the U.K., and the U.S.). The second proxy is an index of minority shareholder protection (anti-director rights) from Djankov et al. (2008). The final variable is securities regulation, the combination of disclosure requirements, liability standards, and public enforcement from La Porta, Lopez-de-Silanes, and Shleifer (2006).
Finally, we use variables to proxy for the level of a country’s mutual fund industry development and concentration. The level of development of the mutual fund industry is proxied by the age of industry measured in number of years since the first open-end fund was sold in the country as reported in Khorana, Servaes, and Tufano (2005). To measure industry concentration we use the Herfindahl Index, defined as the sum of the squared
market shares of portfolio management companies for equity funds in each country. The Herfindahl Index is a common indicator of the level of concentration within an industry. Higher values of the Herfindahl Index indicate higher industry concentration. Concentration is higher in Indonesia, Portugal, and Belgium, and lower in the U.K., Australia, Canada, France, and the U.S. We also use the relative mutual fund industry size as proxied by equity assets under management scaled by stock market capitalization (mutual fund equity/market capitalization) per country as an additional explanatory variable. The data on equity assets under management are obtained from EFAMA and stock market capitalizations are obtained from WDI.
3. Determinants of Fund Performance
We investigate the determinants of equity mutual fund performance. Following the large majority of the mutual fund literature, we focus the analysis on domestic mutual funds, but we also use international funds in some tests. We run separate regressions using U.S. and non-U.S. funds that allow us to compare the determinants of the performance of funds in the U.S. versus the rest of the world. All the regressions include time fixed effects (quarter dummies) to account for cross-sectional dependence, and t-statistics are clustered at the fund level to account for autocorrelation in fund performance. All explanatory variables are lagged one-quarter.
3.1. FUND CHARACTERISTICS
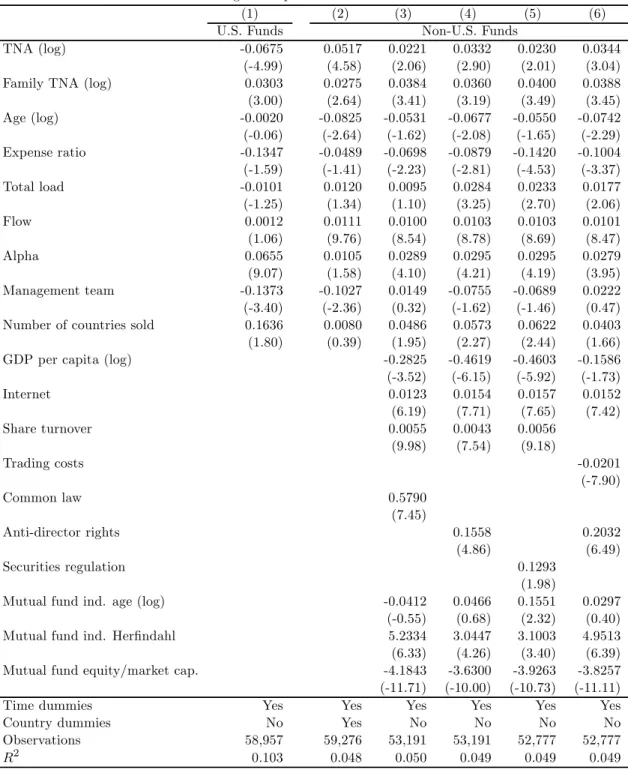
Table V reports results of performance regressions using the Carhart four-factor model al-phas as a measure of risk-adjusted performance. Later, we use alternative measures of per-formance. Column (1) presents estimates for U.S. funds. Column (2) presents estimates for non-U.S. funds using fund characteristics and country dummies as regressors. Columns (3)-(6) present estimates for non-U.S. funds using fund and country characteristics as regressors. We first discuss the effects of fund characteristics and then of country characteristics.
Fund Size. Mutual fund size has been one of the most studied variables in mutual fund research, and the relation between fund size and performance still puzzles academics and practitioners. Several studies try to answer questions such as: Does fund size affect investors’ fund selection ability? Is management skill more pronounced when a fund is small?
Large mutual funds present several advantages over small ones. First, larger funds are able to spread fixed expenses over a larger asset base, and have more resources for research. Managers of large funds can benefit from investment opportunities not available to smaller funds. Large funds are able to negotiate better spreads, as they have larger positions and trading volumes. Furthermore, brokerage commissions decline with the size of transactions (Brennan and Hughes (1991)).
Large funds, however, face some problems and management challenges, and the scale-ability of investments is a determinant of performance persistence (Gruber (1996) and Berk and Green (2004)). While small funds can concentrate on a few investment positions, when funds become large managers must continue to find good investment opportunities, and the effect of managerial skill becomes diluted implying diseconomies of scale. Cremers and Petajisto (2009) show that small funds are more active, while a significant fraction of large active funds are close to index funds. Moreover, larger mutual fund managers must neces-sarily trade larger volumes of stock, attracting the attention of other market participants and therefore suffering higher price impact costs. Chen et al. (2004) name this effect the liquidity constraints hypothesis.
Grinblatt and Titman (1989) and (1994) find mixed evidence on the relationship between fund returns and fund size. More recently, Chen et al. (2004) find that fund returns decline with lagged fund size. The results is most pronounced among funds that invest in small and illiquid stocks, suggesting that adverse scale effects are related to liquidity. They also suggest that in addition to liquidity, fund size erodes performance because of organizational diseconomies. Pollet and Wilson (2008) find that the cause of diminishing returns to scale for
mutual funds is the inability to scale an investment strategy related to liquidity constraints as the fund grows. They find that when a fund receives inflows it tends to scale up its positions instead of diversifying into new assets. Edelen, Evans, and Kadlec (2007) and Yan (2008) point out trading costs and liquidity as the primary source of diseconomies of scale for U.S. funds. Outside the U.S., Dahlquist, Engström, and Söderlind (2000) find that larger equity funds tend to perform more poorly than smaller equity funds in Sweden. Overall, evidence on the size-performance relation is not unanimous, but recent work seems to support the presence of diseconomies of scale.
Column (1) of Table V shows that fund size (TNA) is negatively related to fund perfor-mance in the sample of U.S. funds. The TNA coefficient is negative and statistically signif-icant for U.S. funds, -0.0675 with a t-statistic of -4.99. Thus, U.S. smaller funds perform better than larger funds. Since the standard deviation of log of TNA is 2.20, a one-standard deviation increase to fund size is associated with a decline in performance of 15 basis points per quarter. These effects are economically significant if we take into consideration the aver-age fund performance is near zero. This estimate of the diseconomies of scale to U.S. funds is very close to the one reported in Chen et al. (2004).
There are reasons to believe that the result might be different outside the U.S., because of the difference in size between U.S. funds and non-U.S. Indeed, the average fund is much bigger in the U.S. than outside the U.S., as we have documented earlier. The results in column (2) support a very different relation between performance and TNA for non-U.S. funds. Fund size has a positive and statistically significant effect (the coefficient is 0.0517 with a t-statistic of 4.58) on performance in the sample of non-U.S. funds. A one-standard deviation increase in fund size is associated with an increase in abnormal performance of 11 basis points per quarter. Larger non-U.S. funds seem to have better risk-adjusted performance than smaller funds. We further explore the reasons behind this asymmetry on the relation between fund performance and size in the next subsection. In particular, we test the hypothesis that economies of scale are exhausted after a fund approaches a certain size in fund assets, as
U.S. funds are much bigger than non-U.S. funds.
Fund Family Size. Economies of scale and scope can exist at the fund family level. Expenses like research and administrative expenses can be shared among funds. Larger fund families can use the same economic data and experts to interpret data across many funds, leading to economies of scope and higher returns. Large fund families also benefit from economies of scale from trading commissions and lending fees (Chen et al. (2004)). Khorana and Servaes (1999) in studying mutual fund starts find that large families and families that have more experience in opening funds in the past are more likely to open new funds. This is likely to happen because the cost of generating a new fund is lower for large companies, as they can benefit from economies of scale and scope. Chen et al. (2004) find that fund family size has a positive and statistically significant effect on performance, which they ascribe to family size capturing economies of scale.9
We find that fund family size has a positive and statistically significant effect on perfor-mance in the U.S. and elsewhere in the world (see Table V). Funds that perform better are more likely to be managed by a larger company as family size has a positive effect on fund abnormal performance. The effect of family size is statistically and economically significant, and it is of similar magnitude in the U.S. and outside the U.S. Since the standard deviation of log of family TNA is 2.51, a one-standard deviation increase in family size is associated with an improvement in performance of 8 basis points per quarter. This estimate of the economies of scale in fund families is similar to the one reported in Chen et al. (2004) for U.S. funds. We conclude that the positive effect of family size on performance is pervasive around the world.
Age. Fund age provides a measure of a fund’s longevity and its manager’s ability. The effect of age on performance can run in both directions. One might argue that younger mutual funds will be more agile and committed to achieve better performance to survive. 9Others suggest that larger families transfer performance from low-fee funds to high-fee funds, and they
are committed to create stars that generate inflows to the fund itself and to other funds in the family at the expense of more poorly performing funds (Nanda, Wang, and Zheng (2004) and Gaspar, Massa, and Matos (2006)).
On the other hand, youth may be a disadvantage, newer funds usually face higher costs and suffer from lack of experience during the start-up period. Because of their small size, newer mutual funds’ returns and ratings are also more vulnerable to manipulation. We find no relation between age and performance of U.S. mutual funds in column (1), which is consistent with the evidence in Chen et al. (2004) and others. In contrast, we find that newer funds seem to perform better than older funds outside the U.S. Using the point estimate in column (2), a one-standard deviation increase in fund age (log) is associated with a drop in performance of 6 basis points per quarter of non-U.S. funds.
Expenses. The relation between mutual fund returns and expenses (including manage-ment fees) provides a test of the value of active managemanage-ment. Mutual fund fees can be seen as the price that uninformed investors pay to managers to invest their money. Expenses vary considerably around the world. Khorana, Servaes, and Tufano (2009) find that large funds and families charge lower fees, while funds distributed in more countries charge higher fees. Furthermore, they find that fees are negatively related to investor protection. Empirical evidence on the relation between mutual fund performance and fees is mixed. In a sample of U.S. mutual funds, some authors find a negative relation of fees with net-fee performance (Carhart (1997)) and even before-fee performance (Gil-Bazo and Ruiz-Verdu (2009)), while others find no relationship between fees and performance (Chen et al. (2004)). Evidence for European funds also seems to support a negative relation between fees and performance (Dahlquist, Engström, and Söderlind (2000) and Otten and Bams (2002)). We find a nega-tive relation between the expense ratio and net-of-fees performance. This relation, however, is statistically insignificant for U.S. funds and only significant in some specifications for non-U.S. funds. Thus, there is not consistent evidence of a statistically significant negative relation between fees and performance.
Loads. Besides the expense ratio, funds commonly charge a load when investors purchase (front-end load) or sell (back-end load) shares of the fund. The main goal of the back-end load is to discourage redemptions. By making redemptions expensive, a mutual fund dissuades
investors from redeeming shares, and it is able to invest in a more risky portfolio to enhance performance. The empirical evidence confirms that loads do dissuade redemptions in open-ended funds, and that funds hold more cash when there is uncertainty about redemptions (Chordia (1996)). Authors find no relation between performance and loads (Chen et al. (2004)) or a negative relation (Carhart (1997) and Pollet and Wilson (2008)). We do not find a statistically significant relation between performance and loads in our sample of U.S. and non-U.S. funds.
Flows. According to the “smart money” hypothesis of Gruber (1996), investors can detect skilled managers and direct their money to them. Therefore, fund flows should have a positive correlation with future returns. Gruber (1996) and Zheng (1999) show that funds experiencing net inflows (in the last three months) perform significantly better than funds that experience outflows. However, Sapp and Tiwari (2004) argue that the “smart money” effect is explained by momentum. We find no evidence of a statistically significant relation between flows and subsequent performance in the sample of U.S. funds. Since we are using the Carhart (1997) model to measure performance, this is consistent with the Sapp and Tiwari (2004) argument. In contrast, we find that non-U.S. funds that receive more new money perform better subsequently than those that receive less new money. Flows of the previous period have a positive and statistically significant coefficient, indicating a “smart money” effect. Using the specification in column (2), a one-standard deviation increase in flows is associated with an improvement in subsequent performance of 20 basis points per quarter. The evidence here supports the idea that investors are able to detect skilled fund managers outside the U.S.
How robust are our smart money findings outside the U.S.? First, it should be recognised that as our performance measures are momentum adjusted in our smart money regressions that these results are not attributable to stock-level momentum. Second, it might be argued that serial correlation in flows might inflate our t-statistics on lagged flows thereby biasing us towards accepting the existence of smart money outside the U.S. Ferson, Sarkissian,
and Simin (2003) show that autocorrelation in independent variables in return regressions may lead to spurious inference when levels of first order autocorrelation in the independent variables are above 90% and when the 2 statistics in the regressions are less than 1%. For
our non-U.S. sample of funds, the average first order autocorrelation of flows across funds is 0.25. In addition, the goodness of fit statistics for our non-U.S. performance regressions in Table V are approximately 5%. Adding these findings to the fact that the t-statistics on lagged flows in our performance regressions are extremely high (between 8.5 and 10) this suggests that the incorrect inference problem suggested by Ferson, Sarkissian, and Simin (2003) may not be a problem in our dataset. Our subsequent smart money results using the Fama-MacBeth approach for the non-U.S. sample below also add credence to this. As the time dimension is essentially removed when using this technique, our findings that we still have a smart money effect outside the U.S. when using this approach suggest that our smart money findings are not due to the persistence of flows. Third, as we are controlling for lagged performance in these smart money regressions, differences in performance persistence across countries do not account for our findings.
Past Performance. There is ample evidence of performance persistence in U.S. mutual funds (Hendricks, Patel, and Zeckhauser (1993), Grinblatt and Titman (1994), Brown and Goetzmann (1995), and Carhart (1997)). This persistence seems to be stronger among the most poorly performing funds. Outside the U.S., Dahlquist, Engström, and Söderlind (2000) do not find performance persistence for a sample of Swedish funds, and Otten and Bams (2002) find performance persistence only for U.K. funds. We find evidence of persistence in U.S. funds. The effect of past performance on future performance of U.S. funds is eco-nomically meaningful. A one-standard deviation increase in past performance is associated with an increase in subsequent performance of 27 basis points per quarter in the sample of U.S. funds. Outside the U.S., persistence seems to be much weaker or even inexistent (the coefficient is statistically insignificant in column (2) when the regression includes country dummies).
Management Structure. While individual managers are free from group politics dif-ficulties, teams of decision-makers have more resources and connections, which can help to boost performance. Accordingly, funds managed by a team might perform better than funds managed by an individual manager. On the other hand, small funds can easily be run by a single manager, while a large fund usually cannot. Chen et al. (2004) suggest that larger funds experience organizational diseconomies, especially hierarchy costs, as funds deal mainly in soft-information. When a fund is co-managed, there is more competition to implement an idea and managers may end up expending too much effort to convince others to implement their ideas than they would if they controlled their own funds (Aghion and Tirole (1997) and Stein (2002)). Chen et al. (2004) provide some evidence that size erodes fund perfor-mance because of the interaction of liquidity and organizational diseconomies of scale. While team management may have become increasingly popular in the mutual fund industry, U.S. evidence shows that team-managed funds perform either no differently from (Bliss, Potter, and Schwarz (2008)) or more poorly (Chen et al. (2004) and Massa, Reuter, and Zitzewitz (2010)) than funds managed by a single manager. We find that funds managed by teams (or more than one individual) show significantly worse performance than funds managed by a single person. The difference in performance is also economically significant at roughly 14 basis points for U.S. funds and 11 basis points for non-U.S. funds using the specification in column (2).
Number of Countries Where a Fund is Sold. We also analyze whether the number of countries where a fund is sold helps to predict performance. There are two main reasons why the number of countries where a fund is distributed can affect performance. First, selling a fund in several countries should make the fund less sensitive to shocks in domestic flows. If investors’ flows from different countries are not perfectly correlated, distributing the fund in several countries makes the fund less cash flow volatile, reducing the cash position, and enhancing performance. Second, it is well known that top-performing funds can originate a substantial amount of inflows for a fund family (Nanda, Wang, and Zheng (2004)). Therefore,
fund families are likely to make star funds available in more countries in order to gain market share and increase revenues. We find that the coefficient of number of countries where a fund is sold is statistically insignificant for U.S. and non-U.S. funds (the effect is only significant when we include country-level variables as regressors instead of country dummies). Thus, there is weak evidence that funds distributed in several countries display better performance.
3.2. COUNTRY CHARACTERISTICS
We do not know of any study so far that documents the effects of country characteristics on fund performance. Our sample covering a large cross-section of countries allows estimation of the specifications using country-level variables (Table V, columns (3)-(6)). We do not include U.S. funds in these regressions as they would represent a large fraction of the sample, but we obtain similar results when we include them.
Economic Development. Economic development is associated with higher per capita income and better education and skills, as well as with more developed industries and more incentives for innovation and for new investments. Better financially educated and more sophisticated investors are likely to evaluate fund performance and follow it more closely, exerting some pressure on management for performance. Furthermore, managers are likely to be more skilled in more developed countries, as populations are better educated and have access to more learning opportunities. Developed countries also tend to attract high hu-man capital individuals. Christoffersen and Sarkissian (2009) find that hu-managers located in financial centers in the U.S. display better performance. Therefore, a country’s level of economic development might influence the performance of the mutual fund industry. We find no evidence that a country’s level of economic development as measured by GDP per capita is positively linked to fund performance. The relation is even negative and statisti-cally significant sometimes. We conclude that broad economic development is not positively associated with the performance of domestic mutual funds once we control for other aspects of a country’s level of development. In contrast, we find that the intensity of internet usage
has a positive and statistically significant coefficient. This finding is consistent with the idea that funds display better performance in countries where investors are better informed and better educated and money managers have better skills and greater access to learning opportunities.
Financial Development. A more developed financial market can have some advantages for fund performance because of higher liquidity and lower transaction costs. Trading costs are important in evaluating fund performance as they provide valuable information about the extent of deterioration in performance from active trading. Clearly, actively managed funds involve substantially higher trading costs (Kleim and Madhavan (1997)), and trading costs are also related to fund size. As funds become larger, they will necessarily trade larger volumes. Khorana, Servaes, and Tufano (2005) find that trading costs have a negative impact on the development of the mutual funds industry. We find strong evidence of a positive relation between trading activity and fund performance and a negative relation between trading costs and fund performance. A one-standard deviation increase in share turnover is associated with an improvement in performance of 38 basis points per quarter, while a one-standard deviation reduction in trading costs is associated with an improvement in performance of 26 basis points per quarter. Thus, the evidence indicates that the liquidity of the local stock market plays a prominent role in improving the performance of funds that invest in local stocks.
Investor Protection and Quality of Legal Institutions. Differences in laws and regulations can affect investor behavior. Investors will be reluctant to invest in markets where their rights are not properly protected. La Porta et al. (1997) note that countries with poor investor protection have significantly smaller debt and equity markets. They also observe that the quality of the legal system is important for the enforcement of contracts and also captures the government’s general attitude toward business. Accordingly, we expect to find that mutual fund performance is positively related to investor protection and the quality of a country’s legal institutions. We use three different variables to proxy for investor
protection and the quality of legal institutions. We first use a country’s legal origin, which has been linked to the quality of legal institutions and investor protection. The common law dummy variable has a positive and statistically significant coefficient in column (3). Thus, there is evidence that domestic mutual funds perform better when investor protection is stronger. The effect of legal origin is economically strong. Funds domiciled in countries with a common law legal origin outperform funds domiciled in countries with civil legal origin by 63 basis points per quarter. In columns (4)-(6), we use the anti-director rights index and the securities regulation index to capture other aspects of a country’s legal environment such as protection of minority shareholder interests and the quality of securities market regulations. In every case, we find evidence of a positive effect on fund performance. For example, an increase in the number of shareholder protection mechanisms from three to five enhances fund performance by approximately 60 basis points per quarter.
Mutual Fund Industry Development and Concentration. Mutual funds have been one of the fastest growing types of financial intermediary. This is a relatively recent trend in a significant number of countries vis-à-vis the U.S. The older the industry, the greater the investors’ experience, and the more investment there will be in mutual funds (Khorana, Servaes, and Tufano (2005)). Mutual fund managers will also be more experienced. We hypothesize that the older the industry, the more efficient the fund industry will be, and this may lead to better performance. We do not find empirical support for the hypothesis that older industries display better performance. In a competitive industry, mutual fund firms might feel pressure for their funds to perform well. One might also argue that in a more competitive industry it is harder to achieve abnormal performance. We find a positive relation between mutual fund industry concentration and the performance of domestic funds. Overall, we do not find evidence that industry development and lack of concentration enhance the performance of domestic funds.
Finally, we take into account the size of the equity mutual fund industry relative to the pool of underlying assets (proxied by equity assets under management scaled by stock
market capitalization per country). The coefficient on the relative mutual fund industry size (mutual fund equity/market capitalization) is negative and statistically significant. This is consistent with the notion that in countries where the relative equity mutual fund industry size is greater there are fewer unexploited arbitrage opportunities. It is worth noting that the coefficient on lagged fund TNA remains positive and statistically significant for non-U.S. funds after controlling for relative equity mutual fund industry size. This indicates that a less competitive capital allocation in the mutual fund industry is not responsible for the lack of diminishing returns to scale outside of the U.S.
What do these findings tell us about how fund growth affects fund performance outside the U.S.? When funds increase in size, the impact of that growth on their performance depends on a fund-level and an industry-level effect. If funds grow at the expense of their rivals so that relative industry size is unchanged, we need only worry about the fund-level effect. The coefficient on individual fund size tells us that growth is likely to lead to improved performance for small funds, and unlikely to do so for larger ones. However, if funds grow by bringing new money into the fund sector, thus increasing relative fund industry size, then the industry-level effect will also come into play. In this case, the impact of their growth on performance will depend on the relative magnitudes of the diminished arbitrage opportunities (the industry-level effect) versus the potential cost reductions from being a larger fund (the fund-level effect).
In summary, our research suggests that mutual fund performance is related to both fund and country characteristics. There is evidence that funds from larger fund families and solo-managed funds have higher risk-adjusted returns around the world. These findings are consistent with the evidence for U.S. funds. There are, however, important distinctions between the determinants of performance in the U.S. and elsewhere in the world. There is evidence of diseconomies of scale only in the U.S., while there is evidence of economies of scale outside the U.S. We find that the “smart money” effect is only present outside the U.S., while performance persistence is a characteristic specific of the U.S. fund industry. In
terms of country characteristics, local stock market liquidity, investor protection and law enforcement, and industry concentration have a positive effect on the performance of funds that invest in local stocks.
3.3. WHY ARE THERE DISECONOMIES OF SCALE IN THE U.S. MUTUAL FUND INDUSTRY?
We have documented the existence of diseconomies of scale in the U.S. mutual fund industry, while there is evidence of economies of scale outside the U.S. In this section, we aim to understand the reasons behind this asymmetry. We leave other differences in terms of return persistence and “smart money” effect for future research.
We test two main hypothesis to explain the asymmetry in the relation between perfor-mance and size between U.S. and non-U.S. domestic funds. A first hypothesis comes from the fact that U.S. funds are much larger than elsewhere in the world (the average U.S. do-mestic fund is more than five times larger than the average non-U.S. dodo-mestic fund in our sample; see Table III). The difference in size between U.S. and non-U.S. domiciled funds is striking if we look at the top 100 funds in terms of total net assets (TNA) at the end of 2007. There are only nine non-U.S. funds among the top 100 domestic funds. The largest fund in our sample is the American Growth Fund of America with a TNA of $194 billion, while the largest non-U.S. fund is the Invesco Perpetual High Income with a TNA of $19 billion and a rank of 26th.
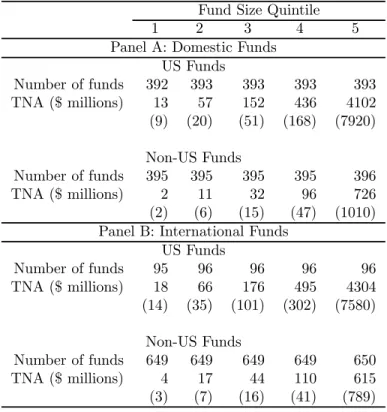
We sort mutual funds in each quarter based on the quintile rankings of their TNA. We perform the sort not only for domestic funds, but also for international funds as we use these funds in this section to better understand the asymmetry between the U.S. and the rest of the world in terms of the relation between fund performance and size. Table VI presents number of funds and mean TNA for each fund size quintile separately for domestic funds (Panel A) and international funds (Panel B) and within each of these groups separately for U.S. and non-U.S. funds. Notice that the size quintile rankings are solely based on funds within each
subgroup (e.g., U.S. domestic funds). In each quarter, there are on average about 400 U.S. and non-U.S. domestic funds in each fund size quintile. There is a substantial spread in TNA between the bottom and top size quintiles. Domestic funds in the bottom quintile have an average TNA of $13 million in the U.S., whereas the ones in the top quintile have an average TNA of over $4 billion. There is also a significant spread for non-U.S. domestic funds. Funds in the bottom quintile have an average TNA of $2 million and in the top quintile $726 million. We can also see that there is a dramatic difference between the average TNA of U.S. and non-U.S. funds across all quintiles. The U.S. fund size quintiles have an average TNA more than five times larger than the corresponding non-U.S. fund size quintiles. The fund size quintiles of international funds in Panel B shows no significant differences between the average TNAs of domestic and international funds in the U.S. as well as outside the U.S. Thus, domestic and international funds have comparable scale of operations.
A second hypothesis suggests that liquidity constraints play an important role in explain-ing the lack of scale-ability of fund investments in the U.S. mutual fund industry (Chen et al. (2004) and Pollet and Wilson (2008)). This hypothesis is supported by the fact that large U.S. domestic funds that have to invest, by virtue of their style, in small and illiquid stocks are the most affected by scale, and the inability to scale an investment strategy as the fund grows due liquidity constraints. This hypothesis is consistent with the arguments of Berk and Green (2004) that small funds can concentrate on a few investment positions, but when funds become large managers must continue to find good investment opportunities, and the effect of managerial skill becomes diluted. We have documented that U.S. domestic funds play more small and illiquid stock than funds located elsewhere in the world (see Table II). This could contribute to hurt performance as the scale of the fund increases. Thus, liquidity constraints are put forward as a plausible explanation to the different relation between fund performance and size in the U.S. and outside the U.S.
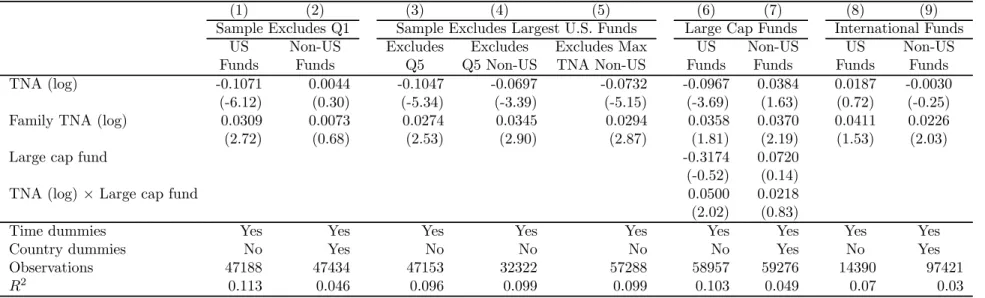
Table VII presents the results of the regression tests similar to the ones in Table V but designed to test our hypotheses. We focus the analysis on the fund size coefficient, but
the regressions in Table VII include the explanatory variables (coefficients not shown) used in Table V. In columns (1)-(5) we test the hypothesis that the asymmetry is explained by the fact that U.S. funds are much larger than non-U.S. funds. In columns (6) and (7) we test the liquidity constraints hypothesis. Finally, in columns (8)-(9) we use the sample of international funds as an experimental ground to test the hypotheses.
Columns (1) and (2) present the results for the samples of U.S. and non-U.S. domestic funds excluding funds in the bottom fund size quintile. Therefore, we focus the analysis in the subsamples of funds in fund size quintiles two through five. This subsample addresses the concern that there is a systematic upward bias in the reported returns of small funds (e.g., Elton, Gruber, and Blake (2001)). This bias is potentially problematic for the analysis of the relation between size and performance, especially given the U.S. evidence of diseconomies of scale. In column (1) the coefficient on TNA is negative and statistically significant in the sample of U.S. funds, which is consistent with the evidence for the sample of all funds. In column (2) we can see that the positive relation between fund performance and size outside the U.S. is explained by the funds in the bottom fund size quintile. Indeed, there is a statistically insignificant relation between fund performance and size when we exclude the non-U.S. funds in the bottom size quintile. It is important to note that even in this case we do not find evidence of diminishing returns to scale outside the U.S.
Columns (3)-(5) present results for the sample of U.S. domestic funds excluding the largest funds. The goal is to evaluate the relation between performance and size for a sample of U.S. funds that is comparable with non-U.S. funds in terms of size. We perform this test using three alternative procedures. In column (3) we estimate the performance regression using a subsample that excludes the funds in the top fund size quintile (i.e., subsample of funds in size quintiles one through four). In column (4) we estimate the performance regression using a subsample that excludes funds in the top fund size quintile but with the TNA breakpoint given by U.S. funds (i.e., subsample of funds with TNA below the TNA of the non-U.S. funds in the top fund quintile). In column (5) we restrict the sample of non-U.S. funds to
only contain funds with TNA below the TNA of the largest non-U.S. fund in each quarter. The results in columns (3)-(5) still show evidence of diseconomies of scale in the U.S. fund industry. Thus, the evidence does not support the hypothesis that diseconomies of scale are driven by the fact that U.S. funds are much larger than their non-U.S. counterparts.
In columns (6) and (7) we directly test the liquidity constraints hypothesis. We identify funds in our sample that invest more in large stocks (large cap fund) and funds that invest more in small stocks (small cap funds). We define a large cap fund dummy that takes the value of one if a fund is below the median factor loading, and takes the value of zero if a fund is above the median factor loading in each quarter. We define this dummy separately for U.S. and non-U.S. funds. We augment the regressions specification by including the large cap fund dummy and an interaction term (TNA × Large cap fund) that measures the difference between large cap and small cap funds in terms of the relation between performance and TNA. The liquidity hypothesis predicts the sign of the interaction term to be positive since in large cap funds there should be less of an adverse effect of fund size on performance than in small cap funds. The results in column (6) for U.S. funds support this hypothesis as the interaction term is positive and statistically significant. The TNA coefficient, which registers the effect of size on performance for small cap funds, is negative and statistically significant. In column (7) we can see that there is not similar evidence in the sample of non-U.S. funds. The interaction term is statistically insignificant for non-U.S. funds as they load less in small stocks and therefore they are not as much affected by liquidity constraints when they grow. We conclude that the evidence from our worldwide sample of funds supports the liquidity constraints hypothesis, which is consistent with the U.S. evidence in Chen et al. (2004).
It could be argued that the liquidity of U.S. small stocks might not be that low particularly when compared to the liquidity of the average stock from less liquid stock markets. How does the liquidity of U.S. small stocks compare to average stock liquidity across the countries in our sample? We address this question using two commonly used measures of liquidity
namely effective spreads and share turnover.
The Securities and Exchange Commission (2001) (SEC) stock exchange liquidity report presents effective trading spreads for small-cap stocks that trade on the NYSE and Nasdaq (defined to have a market capitalization of less than $200 million) using data from June 2000 (the start of our sample period).10 The study reports that small-cap stocks have
effective trading spreads of 0.85% for NYSE stocks and 1.67% for Nasdaq stocks. Jain (2003) presents statistics on effective trading spreads on stock markets around the world estimated at approximately the same time in 2000. Based on these figures, in our sample of countries, 15 countries have lower average effective trading spreads than U.S. small stocks traded on the NYSE and 26 countries have average effective trading spreads lower than U.S. small stocks traded on the Nasdaq. The countries with the higher average liquidity than U.S. small cap stocks also turn out to be the countries with the largest fund management industries. Even if we take the NYSE alone as our U.S. small stock liquidity benchmark, it turns out that 88% of fund assets under management (based on Table I) outside the U.S. come from countries where average liquidity is higher than U.S. small stock liquidity, which is explained by the fact that the largest fund industries outside the U.S. are also the most liquid.
As a cross-check we also compare the share turnover per country used in our regressions with the share turnover of U.S. small stocks. We again define “a small stock” as having a market capitalization of less than $200 million following the SEC definition above. Using CRSP share volume data, the average share turnover for U.S. small stocks during our sample period (2000-2007) is 94% per year. Comparing this figure with our share turnover figures for other countries in Table IV, we find that 12 countries have average share turnover that is higher than that of U.S. small stocks and that these 12 countries manage the majority of assets under management outside the U.S. based on the TNA data presented in Table I.
10Effective trading spreads are often argued to be more relevant than liquidity measures calculated from
quotes as they measure liquidity by calculating how far away transaction prices are from quoted mid-point prices.
These liquidity comparisons suggest that a substantial number of countries in our sample have higher liquidity than U.S. small stocks. These countries account for the lion’s share of assets under management of the non-U.S. mutual fund industry. Although there are some countries with lower liquidity than U.S. small stocks, these countries are the ones with the smallest mutual fund industries.
We next test the hypotheses using as a laboratory international funds. These funds face a diverse trading environment and investor clientele. In particular, liquidity constraints, which seem to be the reason for diminishing returns to scale observed in U.S. domestic funds, are likely to be less severe for international funds that can invest in a broader geographic region (or even anywhere in the world in the case of global funds). One particular acute liquidity constraint that can negatively affect fund performance is the lack of new investment oppor-tunities. When current investment opportunities have been fully exploited, fund managers need to “go down their list” to the next-best stock (Pollet and Wilson (2008)). We argue that this constraint is less severe in international funds. Thus, we expect to find weaker evidence of diseconomies of scale (or even no relation between fund performance and size) in the sample of international funds. Furthermore, international funds can provide new insights about the hypothesis that U.S. funds are too large. U.S. international funds’ average TNA is similar to the average U.S. domestic funds’ TNA, and this is also true across all fund size quintiles (see Table VI). If the reason behind the diminishing returns to scale in U.S. domestic funds is that they are too big, then we should also find evidence of diminishing returns to scale in U.S. international funds.
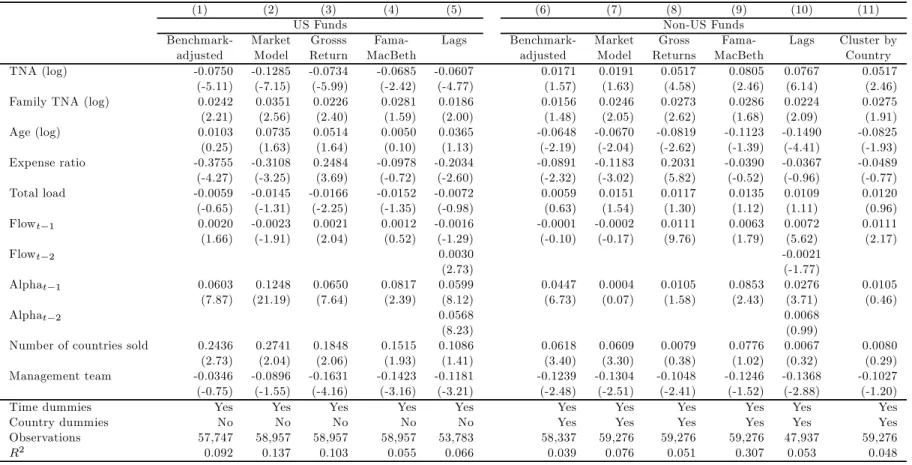
Columns (8) and (9) present the results of the international funds performance regressions for U.S.-domiciled funds and non-U.S.-domiciled funds. To examine the determinants of the performance of funds that invest overseas, we use both domestic and foreign benchmarks (Griffin (2002)). Thus, we expand the four-factor Carhart (1997) model to include foreign , and factors. The foreign factors are value-weighted averages of all