Sustainability 2020, 12, 4998; doi:10.3390/su12124998 www.mdpi.com/journal/sustainability Article
Breakfast Characterization and Consumption by
Low-Income Brazilians: Food Identity and
Regional Food
Janice Ramos de Sousa, Rita de Cássia C.A. Akutsu, Renata Puppin Zandonadi and Raquel B. A. Botelho *
Department of Nutrition, Faculty of Health Sciences, University of Brasilia, Brasilia 70910-900, Brazil; janice.rs@hotmail.com (J.R.d.S.); rita.akutsu@gmail.com (R.d.C.C.A.A.); renatapz@yahoo.com.br (R.P.Z.) * Correspondence: raquelbabotelho@gmail.com; Tel.: +55-61-981378620
Received: 15 April 2020: Accepted: 25 May 2020; Published: 18 June 2020
Abstract: The study aimed to evaluate the breakfast (BF) of the Brazilian low-income population,
analyzing cultural aspects, such as the habit of consuming regional foods and the BF food identity markers. This cross-sectional study used a sample of 1872 low-income Brazilians. For the food consumption analysis, three 24–hour dietary recalls were used. For the qualitative analysis of the BF, we used three classifications: standard, full, partial, and without BF. Also, BF was considered as regional when at least one regional food (contained in a predefined list of regional foods) was consumed. For the analysis of BF's food identity markers, we evaluated all food groups and their frequencies. Of the 5616 possible BF meals available for the three days of consumption, 17.3% were skipped, a low percentage. A total of 4642 BF examples were analyzed. Standard type BF was prevalent in all regions, and full BF was rarely consumed by participants. Women during the weekend skipped BF less often. Out of all five Brazilian regions, the ones with the highest consumption of regional foods were the Midwest (46.6%) and the South (45.9%). The highest frequency of consumed foods in BF were coffee with cow’s milk (or milk with coffee), added sugar, bread, and margarine, indicating that these are the identity markers of BF in the studied sample. Considering that the percentage of standard type BF was very high and that the consumption of added sugar and margarine was accentuated, actions to stimulate the intake of fresh fruits and foods in all meals are necessary, especially in the first meal of the day. There is a need for new proposals for actions and programs with the purpose of expanding access to healthy and adequate regional foods, especially to low-income families.
Keywords: breakfast; low-income; regional food; local system.
1. Introduction
Despite positive changes such as the access to food, availability of different products away from their origin, the availability of products to specific groups with food allergies, intolerance, or different eating behaviors, the lifestyle in industrialized societies has promoted unfavorable changes in eating behavior [1]. One of the main modifications concerns the disruption of meals, with breakfast (BF) being the most important meal. BF is considered as one of the most important meals of the day, as it is generally consumed before going to work/school and provides close to 20% of nutritional recommendations [2]. Breakfast consumption is an essential indicator of a healthy lifestyle and environment protection when using local food [3]. According to Travé [4], BF should include at least three primary groups: dairy, cereal, and fruit, respecting varying eating habits. Also, breakfast habits are related to socio-demographic characteristics and regions [3].
In Brazil, considering its size and the diversity of available foods (mainly fruits and vegetables), in all the regions, the quality of meals eaten is diverse. The country should prioritize the use of
regional foods (RF) with the incentive of local production, benefiting the population and the
environment [5,6] since RF is characterized by foods typical of a region and therefore provides
fundamental benefits to the environment and local culture [6–8]. In this context, income, prices, preferences, beliefs, cultural traditions, as well as geographical, environmental, social, and economic factors influence dietary consumption patterns [9]. Regional food culture and consumption reveal a population’s food identity and reflect their socioeconomic development, cultural transformation, and access to food ingredients [10]. Regional eating patterns are essential information for governments, local service providers, and communities. This information helps communities to understand their own food culture better, shaping several aspects of urban development, such as tourism marketing and place branding, and also potential health problems [10]. Regional food can be attractive due to its claim of being sustainable, comfort food, low in cost, and helpful for local producers [8,11]. Also, there is an attraction of customers to regional food that should be explored, besides being an international guide for healthy eating [6,12,13].
Among other activities, sustainable consumption is associated with eating local food [14,15], and the valorization of regional cuisines is increasing among some populations [14]. Brazilian studies and population surveys [16,17] have not explicitly focused on the consumption of regional foods, except for those that are part of the Brazilian basic food basket nationwide, like rice and beans [18], showing a lack of knowledge about the consumption of regional food in Brazil.
The Brazilian food culture is characterized by great cultural miscegenation (resulting from the multiple influences of the colonization process). Brazil does not have a unique food influence, but rather different food cultures in each of the five regions, with typical foods that are recognized as markers of food culture. The common denominator found for large meals in Brazil (lunch and dinner), across the country and in all social classes are rice and beans [19], but no studies are referring to the markers of breakfast food identity. Therefore, this study aimed to describe the BF of the low-income Brazilian population qualitatively, analyzing cultural aspects such as the habit of consuming regional foods and BF food identity markers. One of the strategies to increase food security is to use the maximum amount of available natural, human, and other resources of the local region.
2. Materials and Methods
This study is a cross-sectional study with data collected from users of Brazilian community restaurants (CRs), approved by the Ethics and Research Committee of the Faculty of Health of the University of Brasília (#037210). We chose the CRs since they are the primary source of food for low-income Brazilians for their main meals [20,21]. There we could assess information about low-low-income people in different cities and regions of the country, since the main meals are served at a low cost during the week. We estimated a simple random sample using survey select of the SAS 9.1.3 program. From 65 Brazilian CRs, the final sample was composed of 36 CRs. The number of CRs from each Brazilian region was proportional to the total number of CRs in each region. Therefore, we examined four CRs in the North, ten in the Northeast, one in the Midwest, six in the South, and 15 in the Southeast region. Figure 1 shows the localization of the CRs (blue and red) on the Brazilian map. In red, the ones participating in the study can be seen; in blue, the other existing CRs at the time of sampling are visible. After considering the total number of users of CRs in Brazil (55,350), we calculated the sample of users with a 3.5% error and a 95% confidence level, including 1,476 consumers as a minimum number for the final sample [22].
Figure 1. Localization of the Brazilian Community Restaurants (CR; blue and red color). The ones participating in the study are in red, the other existing Community Restaurants at the time of sampling are presented in blue. (North region: Rio Branco/AC; Manaus Alvorada/AM; Manaus Compensa/AM; Belém/PA; Midwest region: Estrutural/DF; Northeast region: Maceió/AL; Lauro de Freitas/BA; Paulo Afonso/BA; Juazeiro/BA; Imperatriz/MA; Bayeux/PB; Campina Grande/PB; Petrolina/PE; Parnaiba/PI; Terezina/PI; Southeast region: Bom Sucesso/RJ; Campo Grande/RJ; Meier/RJ; Petrópolis/RJ; Araraquara/SP; Atibaia/SP; Diadema/SP; Guarulhos/SP; Jandira/SP; Suzano/SP; Belo Horizonte 1/MG; Belo Horizonte 2/MG; Belo Horizonte 3/MG; Betim/MG; Poços de Calda/MG; South region: Caxias do Sul/RS; Porto Alegre/RS; Chapecó/SC; Joinvile/SC; Colombo/PR; Curitiba PR.
Breakfast intake was assessed through in-person interviews using three 24–hour dietary recalls. In each CR, consumers had to remember foods and drinks consumed for breakfast and their portions. It is essential to mention that these individuals do not consume BF at CRs. As indicated by participants, all of the individuals who consumed BF made it at home. We used the CR to assess data since it is one of the main places that low-income populations use to have two (lunch and dinner) of the three main meals of the day at a low cost. The participants were considered low-income as the majority receive up to 1 minimum wage, similar to the Brazilian low-income profile [23]. This could allow for verifying the need to extend the government’s CR program to BF meals. Dietitians conducted the interviews looking for details on food preparation. Each participant had to complete three 24–hour dietary recalls, with one from a weekend (Sunday) and two from weekdays (Monday and Tuesday). Researchers collected all data in the same week in each CR and on consecutive days because of the study's logistics and costs, since the same research team visited all CRs.
Consumers had to agree to participate by signing a written agreement, be over 18 years old, and eat more than three times a week at a CR. Selection occurred while consumers were in line waiting
to serve their lunches, the meal offered by the CRs. The first person in line was invited, then the 15th,
and this systematic design continued until the sample was completed [24]. If one person did not agree to participate, or he/she was not within the inclusion criteria, then the next person in line was invited. Pregnant women and consumers under 18 were not included because of their different nutrition requirements.
Since all the meals were available in each of the 24–hour dietary recalls, researchers defined BF as the first meal of the day [2] consumed from 4 am to 11:30 am (a cut-off point based on the time CRs
started to serve lunch and preliminary analysis of the recalls). BF could be a whole meal or a single item consumed in this period.
Besides socio-demographic variables (gender, age, education level, marital status, work status, and per capita income), we classified breakfast as being standard, full, partial, or skipped, as proposed by Alves and Boog [25]. For this classification, the portion size was not relevant, but the consumption or of different food groups was. The standard BF should supply calcium and energy from sources like milk and its products, bread, crackers, and cakes with or without side dishes. Full BF should contain calcium and energy, and be regulatory food (fruits/vegetables). A partial BF included any other food not listed in the full or standard breakfast described previously and skipped BF does not present food consumption [25].
A regional BF was defined as one that contains at least one regional food in a predefined list (Supplementary file S1). This list was prepared based on an extensive review of the literature in Brazilian regional food for each region [6,26–30]. It is worth mentioning that tea and ham were incorporated into Brazilian eating habits at the time of colonization and listed as natural foods of some Brazilian regions in the references. However, they did not originate in Brazil. In these references, tea appeared as a regional drink in the Midwest and South regions, and ham in the South region. Some dishes appeared in more than one region´s list because the colonization process occurred with the influence of people from cities along the coast to the interior of the country.
Since it is a study on the consumption of Brazilian regional foods, we included evaluation of the usual food groups eaten for BF in Brazil to identity food markers in BF. They were roots and tubers (cassava, sweet potatoes, yams), “cuscuz” (corn and rice), tapioca, regional cheeses such as Minas, Canastra, Colonial, and Coalho e Manteiga, honey/molasses and spreads (fruit, peanut, pumpkin, “doce de leite”), coffee (pure or with cows’ milk), teas, soda, juices, butter, margarine, mayo, sausages, added sugar, and sweeteners. All the groups were evaluated, without considering if the options were healthy or not. “Cuscuz” is a Brazilian dish prepared from traditional wheat couscous but made from corn flour or rice flour that were available in the country during the colonization period.
Organization and analysis of data occurred through the Statistical Package for the Social Sciences (SPSS®), version 20.0. The frequency of regional food consumed was established by individual consumption, by CR, and by the Brazilian region.
The data were described in terms of relative frequencies and summary measures such as mean and standard deviation. The assumptions of normality were checked by using the Shapiro-Wilk test. The statistical tests used were the chi-square and Kruskal-Wallis with Dunn as Post-hoc. The level of significance adopted was 5%.
3. Results
From the 2674 individuals that accepted to participate, three 24–hour dietary recalls were collected from 1872 respondents (30% of the sample were lost due to a lack of information about the three 24–hour dietary recalls). It is also important to mention that 2% of the invited individuals refused to participate in the study on the first day of data collection due to several possible motives (lack of time, feeling ashamed, and others). Differently from our previous study (n = 1547 participants) [31], this study presents more participants (n = 1872) because the researchers only needed complete three 24–hour dietary recalls to analyze data. Since we did not use body measures, more individuals agreed to participate.
Of the 5616 expected breakfasts, 974 (17.3%) were not consumed, with a total of 4642 BF meals analyzed. Consumers were predominantly composed of men (59.1%, n = 1,108) and individuals in the age group between 25 and 34 years old (19.9%, n = 374). The average age for men was 46 years old (± 17.6 years) and for women 45 years old (± 17.3 years). The most frequent level of education was Completed High school (33.1%, n = 620). Most interviewees (61.9%, n = 1160) reported themselves to be working. There was a predominance of stable unions (37.7%, n = 765), with the predominant average per capita income ranging from 0.5 to one minimum wage (MW) (41.5%, n = 706). Most participants live in the Southeast region (40.8%, n = 764), followed by the Northeast with 30.1% (n = 563).
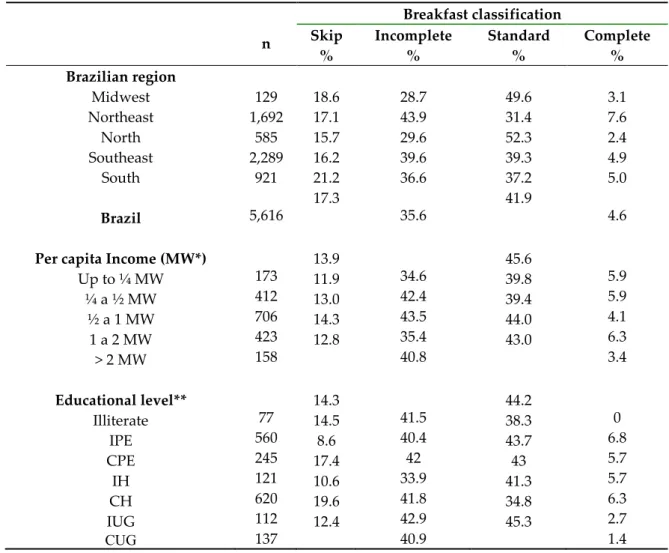
Table 1 shows the qualitative classification of the BF by geographic region, per capita income, and educational level describing the frequency of individuals who skip BF, as well as the frequency of the other BF classifications. There was a significant difference in the consumption profile for the three days (p = 0.000), by in the chi-square test.
Table 1. Distribution of qualitative classification of breakfast by Brazilian region, per capita income, and educational level.
n Breakfast classification Skip % Incomplete % Standard % Complete % Brazilian region Midwest 129 18.6 28.7 49.6 3.1 Northeast 1,692 17.1 43.9 31.4 7.6 North 585 15.7 29.6 52.3 2.4 Southeast 2,289 16.2 39.6 39.3 4.9 South 921 21.2 36.6 37.2 5.0 Brazil
Per capita Income (MW*)
Up to ¼ MW ¼ a ½ MW ½ a 1 MW 1 a 2 MW > 2 MW Educational level** Illiterate IPE CPE IH CH IUG CUG 5,616 173 412 706 423 158 77 560 245 121 620 112 137 17.3 13.9 11.9 13.0 14.3 12.8 14.3 14.5 8.6 17.4 10.6 19.6 12.4 35.6 34.6 42.4 43.5 35.4 40.8 41.5 40.4 42 33.9 41.8 42.9 40.9 41.9 45.6 39.8 39.4 44.0 43.0 44.2 38.3 43.7 43 41.3 34.8 45.3 4.6 5.9 5.9 4.1 6.3 3.4 0 6.8 5.7 5.7 6.3 2.7 1.4
* Minimum wage (MW): USD $175.86 per month. **IPE: Incomplete Primary Education; CPE: Completed Primary Education; IH: Incomplete high school; CH: Completed High School; TC: Technician course; IUG: Incomplete Under-graduate; CUG: Complete Under-graduate;
The analysis between regions showed that the highest percentage of partial BF occurred in the Northeast (43.9%, n = 743). The standard type of BF was widely consumed in all regions, except in the Northeast, with a predominance in the North (52.3%, n = 306) and Midwest (49.6%, n = 64). Consumption of full BF was low in all regions, with the highest frequency occurring in the Northeast (7.6%, n = 129).
There was a significant difference between the Brazilian regions (p <0 .05; Kruskal-Wallis) when analyzing the three days of BF consumption. We used the Kruskal-Wallis test with Dunn as post-hoc to evaluate proportions between regions. Participants from the North region consumed more BF than those from the Northeast (p = 0.000), South (p = 0.000), and Southeast (p = 0.020). The Midwest region was not different from the others in any of the three days of consumption (p = 0.755). Table 2 describes the comparative analysis of BF settings by gender and days of the week.
Table 2. Frequency distribution of BF qualitative classification by gender and day of the week.
BF classification n
Gender
Male (n=1,109) Female (n=763)
Sunday (%) Monday and Tuesday (%) Sunday (%) Monday and Tuesday (%)
Skip BF 974 14.1 21.2 10.7 17.4
Partial 1999 43.3 38.5 37.5 37.7
Standard 2359 37.7 34.7 45.3 40.0
Full 258 5.0 5.6 6.4 4.9
Total 5616 100 100 100 100
The BF skipping was lower on the weekend for both males and females.Table 2 also showed
that, regardless of the days of the week, females skipped less BF than males, perform more standard BF throughout the week, and full BF on Sundays (when they have more time) compared to men.
Regarding the offer of regional foods, Table 3 shows that Midwest and South Brazilian regions present the highest consumption of regional foods for breakfast. However, the difference among regions was not significant (p=0.919; Kruskal-Wallis). Our data showed that there is a significant difference (p = 0.000; chi-square) in the use of regional foods between Sundays and weekdays for all the regions.
Table 3. Frequency of breakfast consumption and eating regional food on weekdays and weekends per Brazilian region.
Brazilian Region Total of 24-hour recalls
Breakfast consumed (total) Regional Breakfast consumed
n % n % Midwest 129 105 81.4 49 46.6 Northeast 1692 1401 82.8 529 37.7 North 585 493 84.3 116 23.5 Southeast 2289 1918 83.8 671 34.9 South 921 725 78.7 333 45.9 Brazil 5616 4642 82.7 1698 37.8
Table 4. describes the frequency of consumption of foods in BF of the research participants, which were grouped as follows: drinks, cereals, or substitutes rich in complex carbohydrates, a complement of cereals/substitutes, fruits, added sugar/sweetener. There was a significant difference found by the Kruskal-Wallis test with Dunn as post hoc in the three days of consumption of food groups between the geographical regions.
Table 4. Frequency of the main food groups consumed for breakfast by the Brazilian regions.
Food Brazilian region % Midwest n=105 % Northeast n=1401 % North n=493 % Southeast n=1.918 % South n=725 Brazil n=4642 p Bev era ges Black coffee 16.3a 22.5a 12.8b 24.4c 20.5a 19.3 0.013 Cow’s milk 0.0a 5.3a 2.6a 5.6a 2.6a 3.2 0.072
Cow’s milk with cofee 30.2a 19.1b 54.9c 30.5a 34.2a 33.8 0.000
Cow’s milk with chocolate
4.7a 3.4a 3.1a 5.4a 3.6a 4.0 0.362 Cer eals an d similars Bread 44.2a 41.8a 53.8b 55.7b 54.1b 49.9 0.000
Cake and cookies 9.3a 12.8a 9.7a 11.7a 8.5a 10.4 0.468
Cassava, sweet popato, yam 0.0 a 2.5 a 1.0 a 0.4 a 0.7 a 0.9 0.122 *
“Cuscuz” (corn or rice) 4.2 a 10.5 a 2.4 a 0.5 a 0.1 a 3.5 0.122 *
Tapioca (cassava flour)
1.7 a 2.1 a 4.0 a 0.1 a 0.0 a 1.6 0.122 * Cer eals compl imen t Butter 9.3a 3.7b 11.3a 9.7a 2.6b 7.3 0.000 Margarine 9.3a 8.3a 20.5b 15.5b 16.6b 14.0 0.002
Cheese prato#/ mozzarela 8.0a 7.6a 4.0b 7.2a 9.5c 7.3 0.009 **
Cheese Minas## 0.7a 0.4a 0.0a 2.8 b 1.3c 1.0 0.009 **
Sausages/hams 16.3a 4.1b 1.5b 3.8b 9.1a 7.0 0.000
Fruit Jams (spreads) 0.0a 0.0a 0.0a 0.2a 8.2b 1.7 0.000
Fruits Fruits 7.0a 18.4b 7.2a 9.3a 10.7c 10.5 0.000
Added Sugar
Added sugar
30.2a 43.1a 54.4b 45.7ab 48.5ab 44.4 0.028
p < 0.05 showed significance; * p-value to cereal group; ** p-value for dairy products. #Queijo prato –
soft Brazilian cheese similar to Danbo Danish cheese; ##Cheese Minas – white fresh cheese from the
state of Minas Gerais Kruskal-Wallis with Dunn as post-hoc.
The consumption of the mixture of milk with coffee was higher than pure coffee in all Brazilian regions, except in the Northeast region. There was a significant difference in the consumption of milk with coffee between the North and the others (p < 0.05). There was also a significant difference in the Northeast when compared to the South and Southeast (p < 0.05). Regarding the consumption of pure coffee, there was a significant difference only in the North and the Southeast (p < 0.05).
Regarding the income, there was a significant difference only in the consumption of “sausages and hams” and cakes/cookies. Those who receive ≥ 2 MW consume more of these kinds of products than those who earn up to ¼ MW and up to 1 MW (p = 0.041, Kruskal-Wallis with Dunn).
About the use of added sugar or sweeteners in the BF beverages, the highest consumption was for sugar (44.4%), and it showed a significant difference between the North and Northeast (p = 0.031) and Midwest (p = 0.047). The North region had the highest frequency of added sugar consumption (54.4%, n = 195), while the Northeast (43.1%, n = 564) and the Midwest (30.2%, n = 43) have the lowest consumption among all Brazilian regions.
4. Discussion
Our previous study [31] aimed to evaluate the nutritional quality of the breakfast consumed by the low-income Brazilian population. Regarding the nutritional quality of Brazilian BF, the energy contribution of the macronutrients to the total energetic value (TEV) was in line with the associated recommendations [32], with a low fiber intake prevailing. However, neither our previous study nor other studies evaluated the food identity markers of the low-income Brazilians’ BF, or their ingestion of regional food in BF, as an aspect involving local sustainability. In this context, this study uses data of low-income Brazilian populations’ BF, analyzing cultural elements, such as the habit of consuming regional foods and BF food identity markers. Also, this study classified the type of BF and the
frequency of skipping BF. This informationcan help the Brazilian government to verify the need to
extend the CR program to BF meals, as well as helping local producers to offer more regional food to their communities. By analyzing BF patterns, public policies could be more focused on the population's needs. Nutrition Educational strategies should include not only the nutrient aspects but also food groups, food choices, and cultural habits [33].
Our study focused on low-income people since they are the majority in Brazil [23], and studies have shown that low-income Brazilians eat less fruits and vegetables. Brazil has a wide variety of regional fruits and vegetables available in parks and backyards that are not valued by this specific population. Also, studies show that people with low incomes look for more industrialized food as a way of demonstrating status differences. Many low-cost industrialized products were developed to be high in sugar and sodium, changing the consumption patterns of this population over over the years.
Our data show that most of the participants consume BF (Table 1), indicating this meal as one of the most important meals of the day. Only 17.3% of participants skipped breakfast, data below the percentages presented in other studies in Brazil and worldwide. In Brazil, a study analyzed data of 21,003 adults aged between 20 to 59 years old from the Brazilian National Dietary Survey 2008–2009 and showed a skipping BF prevalence of 33.1% [34]. A survey of Chinese medical students, for example, showed a prevalence of skipping of BF that ranged from 23.5% to 41.7% [35]. Out of 236 adolescents that studied in Malaysia, only 50% consumed a first daily meal [36]. Ratner et al. [37] surveyed 6823 university students in Chile and found a percentage of 47% skipping BF. In Egypt, of the 891 adolescents studied, only 28% ate this meal [38]. In Brazil, a study [39] with university students from Santa Catarina, found a 19.6% BF skipping percentage, close to that found in the present study. Although BF skipping is more common in adolescents worldwide [2], it is also common among adults. Alves and Boog [25] confirmed this statement by researching 100 students from São Paulo aged between 19 and 39 years old, whose percentage of BF skipping was 30%. Some studies showed a skipping prevalence that is lower than our findings. A Spanish national study with
1,655 adults showed that 3.6% of adults skipped BF, and 14.1% only ate BF sometimes [40]. A National Adult Nutrition Survey conducted among the adult Irish participants (n = 1403) showed that about 1% of the individuals invited to the study do not consume BF, and 6% (n = 83) are irregular breakfast consumers [41].
A recent study by Marchioni et al. [42], aiming to characterize BF patterns and verify the prevalence and factors associated with BF skipping with adolescents from São Paulo (n = 795), found a prevalence of BF omission of 38%, which was higher among females. The decline in BF consumption has been associated with changes in the contemporary lifestyle of the Brazilian population, such as the increase in the number of individuals living alone, the lack of time to eat meals, and the peculiarities in the consumption of different dishes by family members [2]. There is also evidence that the skipping of BF is associated with low levels of education [35,43] and socioeconomic status [35,44]. However, in the present study, this behavior was not confirmed because no significant differences were found between users when income (p=0.162) and education (p=0.58) were considered (Table 1). This is probably due to the predominance of low-income and low-education users among the sampled group, a fact expected because they are beneficiaries of a government program (Community restaurants program) whose objective is to serve food to a low-income Brazilian population [21]. These results show that other factors other than socioeconomic level and education are influencing the habit of not eating BF in the studied sample.
A review study [45] showed that the reasons that lead people to skip BF varied among factors such as age, gender, profession, type of work, cultural customs, including lack of a morning appetite, and attempts to control body weight. Thus, many variables influence BF skipping, but all consider the place, culture, and socio-demographic characteristics in which the individual is located [35,43]. It is also necessary to consider the level of economic development in the region, which in turn consists of different rates of technological development and different levels of social, cultural, and historical development [46].
The standard BF was widely consumed in all regions, except in the Northeast. Consumption of full BF was low in all Brazilian regions, with the highest frequency in the Northeast (7.6%, n = 129). The predominance of standard BF was also demonstrated in the study by Alves and Boog [25] (using the same classification criteria), which showed that 37% of the evaluated individuals performed the standard BF. Higher consumption of standard BF confirms the low intake of fibers evaluated in our previous study [23].
Table 2 showed that BF skipping was lower on the weekend for both genders, indicating that, possibly, a lack of time during weekdays affects the possibility of eating BF [47,48]. Table 2 also showed that, regardless of the day of the week, women skip less BF, consumed more standard BF on weekdays, and consumed more full BF on Sundays (when they have more time) compared to men [49,50]. The qualitative classification model of BF adopted in the present study allowed us to compare our results with those of other authors that used the same method [25,51]. However, it has some limitations, since the model considers only milk and dairy products as a source of calcium, and disregards other dietary sources of this nutrient. Also, the percentage of full BF could be higher if other sources of protein were considered in the model. Combinations of foods classified as full BF may not represent a healthy meal. For example, consumption in a meal involving cake, “dulce de leche”, and banana, would offer a large amount of added sugar, interfering with the suitability of macronutrients.
After analyzing the consumption of meals for the three days by region, we found that the Midwest and South participants had the highest intake of regional food in BF. The North and Southeast regions showed lower values (Table 3), without significant differences among all the regions.
The Midwest region (where the Brazilian capital is placed—Brasília/the Federal District) has been referred to as a receiving region for immigrants from other Brazilian regions, which is why it has the second-highest rate of urbanization in Brazil [52,53]. The Federal District has been responsible for attracting people who migrate to this region in search of improvements in their quality of life, bringing their eating habits and customs. The colonization of the Midwest region occurred later than
other regions in Brazil because of the difficulties of accessing this area and its distance from the coast. This process probably justifies the higher percentage of regional food for BF in the Midwest region. Being away from your place of birth makes people try to make up for the distance by consuming foods that remind them of their place of origin.
Culturally, the South region has different foods from other Brazilian regions, as it has received more considerable influence from several European colonist countries [27], forming a specific social and cultural group in Brazil [54]. The second-highest percentage average of regional BF found in the present study may be indicating that this is a conservative population for its traditions, including food. Both processes identified that the Midwest and the South can be analyzed using the concept of habitus proposed by Bourdieu, in which the taste is socially formed. It is from a habitus, the principle that generates classifiable practices [55], that the individual chooses typical daily practices and situations that tend to be socially associated. Understanding the habitus as a set of predispositions to do one thing and not another, the tendency is that individuals who share a particular habitus make similar choices and have similar opinions regarding tastes [27].
In the Southeast region, there is a low presence of regional food intake for BF (Table 3). São Paulo, the most populous and wealthiest city in the country [56], is considered as the meeting point of several international cuisines (Portuguese, Italian, Lebanese, Arabic, and Japanese), and possibly for this reason why its residents consume more international food than regional Brazilian food. Another possible explanation is related to the lack of time available to prepare regional dishes early in the day, favoring a more practical and quicker alternative, such as consuming coffee, milk, bread, and butter/margarine.
The lowest percentage of regional food for BF in the North region (23.5%, n = 116) (Table 3) was also mentioned in the study conducted by Chaves et al. [28] analyzing the use of regional food in school menus of Brazilian public education. The study highlighted that in the South region, 86% of the menus included at least one regional dish per week, while in the North region, this percentage was 38% [28].
The consumption of regional food in BF in the North region is a contradiction with the characteristics of living conditions in the region [57]. A study evaluated the effects of social transfers and the labor market on income distribution in the South and Northern regions of Brazil and stated that, although the North region has shown a decline in the level of extreme poverty, its population still lives in precarious conditions in many parts of the region. This situation should encourage the population to produce fruit and vegetables in backyards, to raise small edible animals, or to search for low-cost local foods. Thus, meals (including BF) would be improved regarding nutrients.
Most of the individuals participating in the present research who consumed regional foods ate only one regional food in the same meal. The frequencies found for the consumption of at least one regional food, regardless of the type of food, were 27.1% (n = 460), 22.3% (n = 379), and 25.2% (n = 428) for the first, second, and third days, respectively. Few participants consumed two regional foods in the same BF: 5.6% (n = 95), 3.6% (n = 61), 4.1% (n = 70) for the three days, respectively. The consumption of three or more regional foods in the same meal was even lower in the three days of consumption. After analyzing this by region, the same behavior was observed.
The analysis of the three days of regional food consumption showed that, for gender, age, and income range, there was no significant difference. There was a difference only for schooling (p = 0.005,
x2 = 20.334), in which the illiterate consumed a smaller number of regional foods when compared to
those with a higher level of education.
Our data showed that there is a significant difference (p = 0.000) in the consumption of regional foods between Sunday and weekdays, as demonstrated by other studies regarding other meals [58,59]. A study investigated the eating habits of women in Minas Gerais (Southeast region) [58] and demonstrated that 90.1% of the women said that weekend meals were different from weekday meals. The main motives were more time to prepare meals, consumption of foods different from those consumed during the week, and the possibility of meeting the family [58].
Among the food consumption studies in Brazil, few address dietary differences regarding regional characteristics. They generally focus on the calories and nutrient intake and its association
with socioeconomic factors. Also, they demonstrate that the list of products purchased by Brazilians has been changing, in which healthy foods have been replaced by industrialized foods, harming the consumption of regional foods through local production [26,31,60–63].
The Food Guide for the Brazilian Population [64] considers that food and culinary preparations, which result from particular ways of eating, constitute an important part of a society's culture and are strongly related to people's identity and sense of social belonging, as well as local sustainability. Hofelmann and Momm [65] corroborate this statement when they mention that the foods that make up the BF also vary according to the culture, as in other meals. These statements are confirmed by our findings, with a significant difference between regions regarding regional foods’ consumption, despite the non-interference of the variable per capita income.
Food is a powerful marker of cultural identity, as the choice of food represents a way to express preferences, identities, cultural meanings, and local food production [66]. Food can mark a territory, serving as an identity marker linked to a network of meanings associated with a nation, territory, or region. Thus, the food identity marker is a unifying emblem that represents what is typical [67].
Milk with coffee was the most consumed beverage, except for in the Northeast, in which pure coffee was more often consumed. The combination of milk and coffee originated in Germany [68] and spread throughout the world, is similar to the consumption of pure coffee, which is currently one of the most consumed beverages in the world [69]. Despite the absence of recommendations in national guides regarding coffee consumption, the combination of milk and coffee is particularly common during breakfast, after lunch, and with afternoon snacks [70]. The Brazilian Food Guide [64] presents examples of breakfasts from the five Brazilian regions and all income classes, from all age groups and urban and rural areas. In all cases, coffee with milk is a constant presence in the first meal of the day. This combination considers the importance of the protein content of milk and the cultural value of coffee in Brazilian´s diet, as well as its stimulant effect.
Also, the sustainability of agriculture is increasing as a topic of debate in Brazil, including for the production of coffee. Challenges such as the need to generate and distribute income for all rural families, at the limit of the capacity for environmental support, without compromising the conditions of a dignified life for future generations, have become urgent [71,72]. In this context, agriculture should be developed to make domestic supply compatible and to guarantee the food security of the Brazilian nation, with competitive and sovereign integration into the international economy, within the food system. To add value to agricultural products, agro-industrialization and/or the enhancement of regional, cultural, and ecological attributes of the production process can be worked on, as well as labor aspects. Brazil is a world leader in the production and export of coffee and second place in the consumption of this product. Coffee growing is of relevant importance both in the generation of work and income in the field in terms of sustainability, contributing to socio-economic aspects and environmental impacts [71,72].
In the context of the consumption of vegetables in BF, cassava is still present as a substitute for bread in some regions [73]. However, cassava is no longer the marker of food identity among Brazilians because it was replaced by bread, which presented higher consumption than roots and tubers, “cuscuz”, and tapioca preparations, in all regions. The region that most consumed roots and tubers was the Northeast (2.5%, n = 35), but was very low when compared to bread (49.9%, n = 699). “Cuscuz” consumption was higher in the Northeast (10.5%, n = 147) when compared to other regions, and tapioca in the North (4.3%, n = 5). Even with the highest consumption of “cuscuz” and tapioca in the Northeast and North, respectively, bread is today one of the most critical food identity markers for BF, not only because of its frequency of consumption but also because of its variety. Among bread additions (butter, margarine, mayonnaise, honey, cheeses, sausages, curd, and jams), margarine was the most consumed, with a significant difference in the Northeast region compared to the South, and Southeast to the South. Butter had a significant difference in its consumption in the South and the Northeast and Southeast (Table 4).
For some authors [67,74], certain fruits have cultural marker status in Brazil because they are widely consumed, and are recognized as markers of a healthy eating pattern [75]. Considering that Brazil is the third-largest fruit producer in the world, with a production of 40 million tons per year
[76], there should be no obstacles for fruits to represent a marker of cultural identity in Brazil. However, the consumption of fruits and natural juices was similar to cakes and cookies (10.5%; and10.4%, respectively). In the present study, there was a significant difference regarding the consumption of fruits from the Northeast region with the North, South, and Southeast (Table 4)) regions. The Northeast region consumed almost two times more fruit than the Southeast and South regions, and more than two times the amount consumed in the North. The higher consumption of fruits in the Northeast BF was not expected since studies [60,77] described the low consumption of fruits by this population. However, it is necessary to emphasize that such research refers to the total daily intake, without distinguishing between the meal of consumption.
For the use of added sugar or sweetener in BF beverages, the highest frequency of consumption was for added sugar (44.4%). The North region had the highest frequency of sugar consumption (54.4%, n = 195), while the Northeast (43.1%, n = 564) and the Midwest (30.2%, n = 43) had the lowest. Botelho et al. [24] showed that the addition of sugar in liquids during the day represents 1/3 of the total sugar intake in a low-income population, and there was no statistical difference among regions. The reference to added sugars and sweeteners in Brazilian research is largely overlooked in studies regarding breakfast. It suggests that studies focusing on the BF need to be more detailed, ensuring data accuracy, as the use of added sugar and sweetener can interfere in the quality of the diet and can constitute a cultural eating habit, in addition to having important nutritional implications.
Our data showed that the markers of food identity for BF of the studied population are coffee with milk (or milk with coffee), bread, margarine, and added sugar. The data also shows the need for actions to stimulate the consumption of regional foods, fruits, and fresh foods in the BF, such as cassava, sweet potatoes, and yams, to the point that they are considered new identity markers in the country, which would represent a healthier pattern. Also, their consumption could stimulate local food production, impacting on socioeconomic, and environmental aspects.
As a potential limitation of our study, since these data are part of a broader study that evaluated other aspects of the CRs, we could not leave our research team for a week in each city to have two non-consecutive days of 24–hour recall plus the weekend to perform the data collection. We needed to start in each CR on Mondays to get information about the weekend and then two more days in the same CR for the two weekdays. In Brazil, distances are significant between cities and regions (Figure 1), making it difficult to stay in the same place for an extended period and collect data in all the five Brazilian regions.
5. Conclusions
The percentage of BF skipping among low-income Brazilians is not high, especially on weekends and among females. The results showed a predominance of the standard meal in all Brazilian regions and a low percentage of full BF. The consumption of regional foods for BF was small, being higher in the Midwest and South regions, and higher on the weekends, demonstrating that the use of local food resources is happening in an insignificant way in the Brazilian regions. Given the percentage of regional food consumption, it is possible to consider that the main food identity markers of the BF meal are milk with coffee (or coffee with milk), added sugar, and bread with margarine. Fruits and vegetables had a low consumption percentage, and sausages/hams were more prevalent as regional foods. Of the five regions, three presented ham as one of the leading regional foods consumed, demonstrating the higher consumption of industrialized products instead of fresh foods. It is necessary to increase actions to encourage the consumption of fruits and vegetables for BF, such as cassava, sweet potatoes, and yams, to the point that they represent new markers of food identity in the country. Also, fruits and vegetables will contribute to a complete BF with more fibers, vitamins, and minerals. Actions to stimulate the BF and the consumption of regional foods can be essential strategies for complying with the National Policy on Food and Nutritional Security. The consumption of food grown in the region, in addition to contributing to the generation of jobs and a better distribution of income, would reduce costs and bring better nutritional quality to the foods consumed by the population.
Supplementary Materials: The following are available online at www.mdpi.com/2071-1050/12/12/4998/s1, Table S1: Regional foods (dishes, fruits, and vegetables) from the Brazilian Regions.
Author Contributions: Conceptualization, R.C.C.A.A., R.B.A.B, and J.R.S.; methodology, R.C.C.A.A., R.B.A.B, and J.R.S.; validation, R.B.A.B, R.C.C.A.A. and J.R.S.; formal analysis, R.C.C.A.A., R.B.A.B, R.P.Z. and J.R.S.; validation, R.B.A.B, R.P.Z., R.C.C.A.A. and J.R.S.; investigation, R.C.C.A.A. and J.R.S.; resources, R.B.A.B., R.C.C.A.A., and J.R.S.; writing—original draft preparation, R.B.A.B, R.P.Z., R.C.C.A.A., and J.R.S.; writing— review, and editing, R.B.A.B, R.P.Z., R.C.C.A.A., and A.S.F; visualization, R.B.A.B, R.P.Z., R.C.C.A.A., and J.R.S.; supervision, R.B.A.B, R.P.Z., R.C.C.A.A.; project administration, R.B.A.B, R.C.C.A.A., and J.R.S. All authors have read and agreed to the published version of the manuscript.
Funding: University of Brasilia (DPI/DIRPE) and the Ministério do Desenvolvimento e Combate à Fome (grant number 005/2009 MDS-UnB).
Acknowledgments: University of Brasília DPI/DIRPE.
Conflicts of Interest: The authors declare no conflict of interest.
References
1. Berti, G.; Mulligan, C. Competitiveness of Small Farms and Innovative Food Supply Chains: The Role of Food Hubs in Creating Sustainable Regional and Local Food Systems. Sustainability 2016, 8, 616, doi:10.3390/su8070616.
2. Trancoso, S.C.; Cavalli, S.B.; Proença, R.P. da C. Café da manhã: Caracterização, consumo e importância para a saúde. Rev. Nutr. 2010, 23, 859–869, doi:10.1590/S1415-52732010000500016.
3. Hallström, L.; Vereecken, C.A.; Ruiz, J.R.; Patterson, E.; Gilbert, C.C.; Catasta, G.; Díaz, L.E.; Gómez-Martínez, S.; González Gross, M.; Gottrand, F.; et al. Breakfast habits and factors influencing food choices at breakfast in relation to socio-demographic and family factors among European adolescents. The HELENA Study. Appetite 2011, 56, 649–657, doi:10.1016/j.appet.2011.02.019.
4. Durá Travé, T. Análisis nutricional del desayuno y almuerzo en una población universitaria. Nutr. Hosp. 2013, 28, 1291–1299, doi:10.3305/nh.2013.28.4.6479.
5. Fajans, J. Regional food and the tourist imagination in Brazil. Appetite 2006, 47, 389, doi:10.1016/j.appet.2006.08.020.
6. Brasil Alimentos Regionais Brasileiros, 2nd ed.; Ministério da Saúde: Brasília, Brazil, 2015; ISBN 978-85-334-2145-5.
7. Torres, J.M.M.; la Fuente, G.M.C. La cocina tradicional regional como un elemento de identidad y desarrollo local: El caso de San Pedro El Saucito, Sonora, México. Estud. Soc. (Hermosillo, Son.) 2009, 17, 181– 204.
8. Ginani, V.C.; Araújo, W.M.C.; Zandonadi, R.P.; Botelho, R.B.A. Identifier of Regional Food Presence (IRFP): A New Perspective to Evaluate Sustainable Menus. Sustainability 2020, 12, 3992, doi:10.3390/su12103992. 9. World Health Organization Global and regional food consumption patterns and trends. In Diet, Nutrition
and Prevention od Chronic Diseases; WHO/FAO: Geneva, Switzerland, 2003.
10. Zhu, J.; Xu, Y.; Fang, Z.; Shaw, S.-L.; Liu, X. Geographic Prevalence and Mix of Regional Cuisines in Chinese Cities. ISPRS Int. J. Geo-Information 2018, 7, 183, doi:10.3390/ijgi7050183.
11. Mittal, A.; Krejci, C.C.; Craven, T.J. Logistics Best Practices for Regional Food Systems: A Review.
Sustainability 2018, 10, 168.
12. FAO and WHO Sustainable Healthy Diets – Guiding Principles, 1st ed.; Ed. FAO and WHO; Rome, Italy, 2019; Volume 1; ISBN 978-92-5-131875-1.
13. Roseman, M.G.; Mathe-Soulek, K.; Higgins, J.A. Relationships among grocery nutrition label users and consumers’ attitudes and behavior toward restaurant menu labeling. Appetite 2013, 71, 274–278, doi:10.1016/j.appet.2013.08.019.
14. Bryła, P. Regional Ethnocentrism on the Food Market as a Pattern of Sustainable Consumption.
Sustainability 2019, 11, 6408, doi:10.3390/su11226408.
15. Hatjiathanassiadou, M.; Souza, S.R.G. de; Nogueira, J.P.; Oliveira, L. de M.; Strasburg, V.J.; Rolim, P.M.; Seabra, L.M.J. Environmental Impacts of University Restaurant Menus: A Case Study in Brazil.
Sustainability 2019, 11, 5157, doi:10.3390/su11195157.
16. Brasil, Pesquisa de Orçamentos Familiares 2008-2009; IBGE: Brazil, Rio de Janieor; 2011; Volume 39; ISBN 9788524042225.
17. Brazil. Vigitel Brasil 2018: Vigilância de Fatores de Risco e Proteção para Doenças Crônicas por Inquerito Telefônico; Ministério da Saúde: Brasília, Brazil, 2019.
18. Lazzeri, G.; Ahluwalia, N.; Niclasen, B.; Pammolli, A.; Vereecken, C.; Rasmussen, M.; Pedersen, T.P.; Kelly, C. Trends from 2002 to 2010 in Daily Breakfast Consumption and its Socio-Demographic Correlates in Adolescents across 31 Countries Participating in the HBSC Study. PLoS ONE 2016, 11, e0151052, doi:10.1371/journal.pone.0151052.
19. Maciel, M.E. Uma Cozinha à Brasileira. Estud. Históricos 2004, 33, 25–39.
20. Godoy, K.C.; Sávio, K.E.O.; Akutsu, R. de C.; Gubert, M.B.; Botelho, R.B.A.; Godoy, K.C.; Sávio, K.E.O.; Akutsu, R. de C.; Gubert, M.B.; Botelho, R.B.A. Perfil e situação de insegurança alimentar dos usuários dos Restaurantes Populares no Brasil. Cad. Saude Publica 2014, 30, 1239–1249, doi:10.1590/0102-311X00084013. 21. Brasil Manual-Programa Restaurante Popular; Ministério do Desenvolvimento Social e Combate à Fome:
Brasília, Brazil, 2004; p. 71;.
22. Dattalo, P. Determining Sample Size: Balancing Power, Precision, and Practicality; Oxford University Press: Oxford, England, 2007;.
23. Ibge. Instituto Brasileiro de Geografia e Estatística Síntese de Indicadores Sociais: Uma Análise das Condições de
Vida da População Brasileira: 2017; IBGE: Rio de Janeiro, Brazil, 2017; ISBN 9788524044403.
24. Botelho, R.B.A.; Akutsu, R. de C.; Zandonadi, R.P.; Botelho, R.B.A.; Akutsu, R. de C.; Zandonadi, R.P. Low-Income Population Sugar (Sucrose) Intake: A Cross-Sectional Study among Adults Assisted by a Brazilian Food Assistance Program. Nutrients 2019, 11, 798, doi:10.3390/nu11040798.
25. Alves, H.J.; Boog, M.C.F. Food behavior in student residence halls: A setting for health promotion. Rev.
Saude Publica 2007, 41, 197–204, doi:10.1590/S0034-89102007000200005.
26. Ginani, V.C. Avaliação da Qualidade Nutricional, Sensorial e Cultural de Cardápios Populares, Ph.D. Thesis, University of Brasilia, Brasília, Brazil, 2011.
27. Araújo, W.M.C.; Botelho, R.B.A.; Araújo, H.M.; Zandonadi, R.P. Da Alimentação à Gastronomia, 1st ed.; UnB: Brasília, Brazil, 2005; ISBN 9788523008185.
28. Chaves, L.G.; Mendes, P.N.R.; Brito, R.R. de; Botelho, R.B.A. O programa nacional de alimentação escolar como promotor de hábitos alimentares regionais. Rev. Nutr. 2009, 22, 857–866, doi:10.1590/S1415-52732009000600007.
29. Fisberg, M.; Wehba, J.; Cozzolino, S.M.F. Um, dois, Feijão com Arroz : A Alimentação no Brasil de Norte a sul; Atheneu: São Paulo, Brazil, 2002; ISBN 8573795336.
30. Philippi, S.T. Tabela de Composição de Alimentos: Suporte para Decisão Nutricional eBook: Sonia Tucunduva Philippi: Amazon.com.br: Loja Kindle. Available online: https://www.amazon.com.br/Tabela-
Composição-Alimentos-Suporte-Nutricional-ebook/dp/B00ZPP80DY?tag=goog0ef-20&smid=A18CNA8NWQSYHH (accessed on 11 February2019).
31. de Sousa, J.R.; Botelho, R.B.A.; Akutsu, R. de C. C. A.; Zandonadi, R.P. Nutritional Quality of Breakfast Consumed by the Low-Income Population in Brazil: A Nationwide Cross-Sectional Survey. Nutrients 2019,
11, 1418, doi:10.3390/nu11061418.
32. World Health Organization. DIET, NUTRITION AND THE PREVENTION OF CHRONIC DISEASES; WHO: Geneva; Switzerland 2003; ISBN 0512-3054, pp. 1-160.
33. Brazil. Guia Alimentar Para a População Brasileira; Ministério da Saúde: Brasília, Brazil, 2014; Volume 2. 34. Baltar, V.T.; Cunha, D.B.; Santos, R.D.O.; Marchioni, D.M.; Sichieri, R. Breakfast patterns and their
association with body mass index in Brazilian adults. Cad. Saude Publica 2018, 34, doi:10.1590/0102-311X00111917.
35. Sun, J.; Yi, H.; Liu, Z.; Wu, Y.; Bian, J.; Wu, Y.; Eshita, Y.; Li, G.; Zhang, Q.; Yang, Y. Factors associated with skipping breakfast among Inner Mongolia Medical students in China. BMC Public Health 2013, 13, 42, doi:10.1186/1471-2458-13-42.
36. Nurul-Fadhilah, A.; Teo, P.S.; Huybrechts, I.; Foo, L.H. Infrequent Breakfast Consumption Is Associated with Higher Body Adiposity and Abdominal Obesity in Malaysian School-Aged Adolescents. PLoS ONE 2013, 8, e59297, doi:10.1371/journal.pone.0059297.
37. Ratner, R.; Hernández, P.; Martel, J.; Atalah, E. Calidad de la alimentación y estado nutricional en estudiantes universitarios de 11 regiones de Chile.e. Rev. Médica Chile 2012, 140, 1571–1579.
38. El-Gilany, A.-H.; Elkhawaga, G. Socioeconomic determinants of eating pattern of adolescent students in Mansoura, Egypt. Pan Afr. Med. J. 2012, 13.
nutricional de universitárias ingressantes em Florianópolis, SC. Rev. Bras. Cineantropometria e Desempenho
Hum. 2013, 15, 326–337, doi:10.5007/1980-0037.2013v15n3p326.
40. Navia, B.; López-Sobaler, A.M.; Villalobos, T.; Aranceta-Bartrina, J.; Gil, Á.; González-Gross, M.; Serra-Majem, L.; Varela-Moreiras, G.; Ortega, R.M. Breakfast habits and differences regarding abdominal obesity in a cross-sectional study in Spanish adults: The ANIBES study. PLoS ONE 2017, 12, e0188828, doi:10.1371/journal.pone.0188828.
41. Uzhova, I.; Mullally, D.; Peñalvo, J.L.; Gibney, E.R. Regularity of breakfast consumption and diet: Insights from national adult nutrition survey. Nutrients 2018, 10, doi:10.3390/nu10111578.
42. Marchioni, D.M.L.; Gorgulho, B.M.; Teixeira, J.A.; Verly, E.; Fisberg, R.M. Prevalência de omissão do café da manhã e seus fatores associados em adolescentes de São Paulo: Estudo ISA-Capital. Nutrire 2015, 40, 10– 20, doi:10.4322/2316-7874.032414.
43. Freitas, P.P. de; Mendonça, R. de D.; Lopes, A.C.S. Factors associated with breakfasting in users of a public health service. Rev. Nutr. 2013, 26, 195–203, doi:10.1590/S1415-52732013000200007.
44. Hulshof, K.F.A.M.; Brussaard, J.H.; Kruizinga, A.G.; Telman, J.; Löwik, M.R.H. Socio-economic status, dietary intake and 10 y trends: The Dutch National Food Consumption Survey. Eur. J. Clin. Nutr. 2003, 57, 128–137, doi:10.1038/sj.ejcn.1601503.
45. Affinita, A.; Catalani, L.; Cecchetto, G.; De Lorenzo, G.; Dilillo, D.; Donegani, G.; Fransos, L.; Lucidi, F.; Mameli, C.; Manna, E.; et al. Breakfast: A multidisciplinary approach. Ital. J. Pediatr. 2013, 39, 44, doi:10.1186/1824-7288-39-44.
46. Rossi Casali, G.F.; da Silva, O.M.; Carvalho, F.M.A. Sistema regional de inovação: Estudo das regiões Brasileiras. Rev. Econ. Contemp. 2010, 14, 515–550, doi:10.1590/S1415-98482010000300004.
47. Levitsky, D.A.; Pacanowski, C.R. Effect of skipping breakfast on subsequent energy intake. Physiol. Behav. 2013, 119, 9–16, doi:10.1016/j.physbeh.2013.05.006.
48. Choi, J.; Zhao, J. Consumers’ behaviors when eating out: Does eating out change consumers’ intention to eat healthily? Br. Food J. 2014, 116, 494–509, doi:10.1108/BFJ-06-2012-0136.
49. Bertolini, D.N.P.; Simonetti, J.P. The male genre and health care: The experience of men at a health center.
Esc. Anna Nery-Rev. Enferm. 2014, 18, 722–727, doi:10.5935/1414-8145.20140103.
50. Borges, L.M.; Seidl, E.M.F. Percepções e comportamentos de cuidados com a saúde entre homens idosos.
Psicol. Ciência e Profissão 2012, 32, 66–81, doi:10.1590/s1414-98932012000100006.
51. Gambardella, A.M.D.; Frutuoso, M.F.P.; Franch, C. Prática alimentar de adolescentes. Rev. Nutr. 1999, 12, 55–63, doi:10.1590/s1415-52731999000100005.
52. IBGE Síntese de Indicadores Sociais –SIS. Available online:
https://www.ibge.gov.br/estatisticas/sociais/saude/9221-sintese-de-indicadores-sociais.html?=&t=o-que-e (accessed on 15 April 2020).
53. IBGE Brasil em Síntese, Distrito Federal, Panorama. Cidades Available online: https://cidades.ibge.gov.br/brasil/df/brasilia/panorama (accessed on 4 October 2019).
54. Cerdan, C. Valorizaçâo dos produtos de origem e do patrimônio dos territórios rurais no sul do Brasil: Contribuição para o desenvolvimento territorial sustentável. Política Soc. 2009, 8, 277–300, doi:10.5007/2175-7984.2009v8n14p277.
55. Bourdieu, P. La Distinction Critique Sociale du Jugement PIERRE BOURDIEU; Enciclopaedia Universalis: France, Paris, 1979.
56. Neto, R. da M. S.; de Menezes, T.A. Level and trend of inequality of family expenditures in Brazil: An analysis for the metropolitan areas in period 1996–2003. Estud. Econ. 2010, 40, 341–372, doi:10.1590/S0101-41612010000200004.
57. Coelho, A.B.; Aguiar, D.R.D. de; Fernandes, E.A. Padrão de consumo de alimentos no Brasil. Rev. Econ. e
Sociol. Rural 2009, 47, 335–362, doi:10.1590/S0103-20032009000200002.
58. Lelis, C.T.; Teixeira, K.M.D.; Silva, N.M. da A inserção feminina no mercado de trabalho e suas implicações para os hábitos alimentares da mulher e de sua família. Saúde em Debate 2012, 36, 523–532, doi:10.1590/s0103-11042012000400004.
59. Ferreira, P.M.; Papini, S.J.; Corrente, J.E. Diversity of eating patterns in older adults: A new scenario? Rev.
Nutr. 2014, 27, 67–79, doi:10.1590/1415-52732014000100007.
60. Levy, R.B.; Claro, R.M.; Bandoni, D.H.; Mondini, L.; Monteiro, C.A. Availability of added sugars in Brazil: Distribution, food sources and time trends. Rev. Bras. Epidemiol. 2012, 15, 3–12.
V.S.; Vasconcelos, F. de A. G.; Souza, A. de M.; Barufaldi, L.A.; et al. ERICA: Intake of macro and micronutrients of Brazilian adolescents. Rev. Saude Publica 2016, 50, doi:10.1590/s01518-8787.2016050006698. 62. De Carvalho, A.P.; De Oliveira, V.B.; Dos Santos, L.C. Hábitos alimentares e práticas de educação nutricional:atenção a crianças de uma escola municipal de BeloHorizonte, Minas Gerais Food habits and nutritional education practices: Warning for children of a municipal school of Belo Horizonte, Minas Gerais. Pediatria (Santiago) 2007, 32, 20–27.
63. Carrijo, A. de P.; Botelho, R.B.A.; Akutsu, R. de C. C. de A.; Zandonadi, R.P.; Carrijo, A. de P.; Botelho, R.B.A.; Akutsu, R. de C. C. de A.; Zandonadi, R.P. Is What Low-Income Brazilians Are Eating in Popular Restaurants Contributing to Promote Their Health? Nutrients 2018, 10, 414, doi:10.3390/nu10040414. 64. Brasil Guia alimentar para a população brasileira Promovendo a Alimentação Saudável Available online:
http://dab.saude.gov.br/portaldab/biblioteca.php?conteudo=publicacoes/guia_alimentar2014 (accessed on 28 July 2017).
65. Höfelmann, D.A.; Momm, N. Café da manhã: Omissão e fatores associados em escolares de Itajaí, Santa Catarina, Brasil. Nutrire 2014, 39, 40–55, doi:10.4322/nutrire.2014.005.
66. Sobal, J.; Bisogni, C.A.; Devine, C.M.; Margaret, J. A conceptual model of the food choice process over the life course. In The Psychology of Food Choice; Cabi: , Ithaca, New York, 2006; pp. 1–18.
67. Maciel, M.E. Olhares Antropológicos sobre a Alimentação Identidade Cultural e Alimentação; Fiocruz, Ed.; Scielo: Rio de Janeiro, Brazil, 2005; ISBN 85- 7541-055-5.
68. Pacheco, J.G.; Sérgio, O.; Lima, R.; Paulo, P.; Filho, F. CAFÉ: (RE)CONQUISTA DOS MERCADOS; BNDES, Brazil,Rio de Janeiro, 1999.
69. Arruda, A.C.; Minim, V.P.R.; Ferreira, M.A.M.; Minim, L.A.; Da Silva, N.M.; Soares, C.F. Coffee consumption and non-consumption justifications and motivations. Ciência e Tecnol. Aliment. 2009, 29, 754– 763.
70. Antunes, M.M.L.; Sichieri, R.; Salles-Costa, R. Food intake among children under three years of age in an area with high food insecurity. Cad. Saude Publica 2010, 26, 1642–1650, doi:10.1590/S0102-311X2010000800017.
71. Siqueira, H.M.; Souza, P.M. Organic system and the family coffee production of Caparaó, state of Espírito Santo, Brazil: Alternative for socioeconomic sustainability? Custos e Agronegócio 2011, 8, 57–83.
72. Hajjar, R.; Newton, P.; Adshead, D.; Bogaerts, M.; Maguire-Rajpaul, V.A.; Pinto, L.F.G.; Mcdermott, C.L.; Milder, J.C.; Wollenberg, E.; Agrawal, A. Scaling up sustainability in commodity agriculture: Transferability of governance mechanisms across the coffee and cattle sectors in Brazil. J. Clean. Prod. 2019,
206, 132.
73. Monteiro, L.S.; Souza, A. de M.; Hassan, B.K.; Estima, C.C.P.; Sichieri, R.; Pereira, R.A. Breakfast eating among Brazilian adolescents: Analysis of the National Dietary Survey 2008–2009. Rev. Nutr. 2017, 30, 463– 476, doi:10.1590/1678-98652017000400006.
74. Da Silva, H.A.; Murrieta, R.S.S. Mandioca, a rainha do Brasil? Ascensão e queda da manihot esculenta no estado de São Paulo. Bol. do Mus. Para. Emilio GoeldiCiencias Hum. 2014, 9, 37–60, doi:10.1590/S1981-81222014000100004.
75. Jaime, P.C.; Stopa, S.R.; Oliveira, T.P.; Vieira, M.L.; Szwarcwald, C.L.; Malta, D.C. Prevalência e distribuição sociodemográfica de marcadores de alimentação saudável, Pesquisa Nacional de Saúde, Brasil 2013.
Epidemiol. e Serviços Saúde 2015, 24, 267–276, doi:10.5123/s1679-49742015000200009.
76. Fachinello, J.C.; Pasa, M. da S.; Schmtiz, J.D.; Betemps, D.L. Situação e perspectivas da fruticultura de clima temperado no Brasil. Rev. Bras. Frutic. 2011, 33, 109–120, doi:10.1590/S0100-29452011000500014.
77. Souza, A. de M.; Pereira, R.A.; Yokoo, E.M.; Levy, R.B.; Sichieri, R. Alimentos mais consumidos no Brasil: Inquérito Nacional de Alimentação 2008-2009. Rev. Saude Publica 2013, 47, 190s–199s, doi:10.1590/S0034-89102013000700005.
© 2020 by the authors. Licensee MDPI, Basel, Switzerland. This article is an open access article distributed under the terms and conditions of the Creative Commons Attribution (CC BY) license (http://creativecommons.org/licenses/by/4.0/).