Faculdade de Engenharia da Universidade do Porto
Conversational AI: Automated Visualization of
Complex Analytic Answers from Bots
Bruno Pereira de Morais
Mestrado Integrado em Engenharia Eletrotécnica e de Computadores Major Automação
Supervisor: Henrique Lopes Cardoso
i
Resumo
Num mundo que recolhe mais informação do que nunca, a capacidade de compreender rapidamente grandes quantidades de dados de alta dimensionalidade é uma tarefa importante, mas complexa. Para enfrentar este desafio, a Critical Software está a desenvolver o Ansa, uma plataforma e assistente conversacional e de pesquisa. Uma das características mais importantes deste tipo de assistente para análise de dados é a sua capacidade de gerar automaticamente representações visuais perspicazes a partir da informação colecionada para dar resposta à pergunta do utilizador. Isto requer um sistema capaz de decidir que informação apresentar, qual o tipo de visualização adequado e como utilizar a informação da forma mais apropriada nos devidos parâmetros da visualização. Para tal, este trabalho apresenta uma solução baseada em case-based reasoning (CBR). O CBR, ou raciocínio baseado em casos, pretende resolver novos problemas recorrendo a informação relativa à resolução de casos prévios, e adaptando a sua forma de resolução para a nova situação. Baseando-se em casos de sucesso verificados, o sistema de CBR desenvolvido consegue decidir como organizar uma representação visual de dados apropriada sem a necessidade de conhecimento aprofundado ou regras definidas. É também capaz de aprender através do feedback do utilizador e ajustar a sua base de conhecimento conformemente. No seu funcionamento, o sistema compara o novo problema, os dados para os quais deve gerar uma visualização, com os seus casos conhecidos, determinando qual deles é o mais semelhante. O caso selecionado é recuperado da base de casos e a sua solução (constituída pelo tipo de gráfico ideal e pelo uso apropriado dos atributos em eixos ou séries) é adaptada de forma a ser aplicada no problema atual. Sendo determinada a visualização ideal para o novo problema, o feedback do utilizador dita se esta deve ser adicionada à base de conhecimento ou se o sistema deve apresentar uma visualização diferente.
O sistema apresenta resultados promissores, com elevada precisão e desempenho. A sua capacidade de apresentar bons resultados, aprender por experiências passadas, adaptabilidade a futuros tipos de visualização e fácil manutenção motivam a continuação da experimentação com esta técnica.
iii
Abstract
In a world that collects more information than ever before, quickly making sense of complex high-dimensional data is an important but intricate task. To tackle this challenge, Critical Software is developing Ansa, a conversational and search assistant platform. One of the most important features of this kind of data analytics assistant is its ability to automatically generate insightful visual representations from the relevant data resulting from the user’s query. This requires a system able to decide which information to display, which visualization type to use, and how to arrange the data in the most fitting parameters. To solve this automatic visualization challenge, this work presents a case-based reasoning (CBR) approach. Case-based reasoning aims to solve new problems by recalling previously solved ones and adapting their solution. By relying on verified successful cases, the developed CBR system is able to decide appropriate visualizations for the input data without the need for data visualization expertise or specific rules. It is also able to learn from the user’s feedback, adjusting its knowledge base accordingly. In its operation, the system compares the received data to its known cases to determine which is the most similar one. The selected case is then retrieved from the knowledge base and its solution (composed by the selected chart type and attribute use) is adapted in order to solve the current problem. Once a visualization arrangement is selected, user feedback dictates if it should be added to the knowledge base or if a different solution should be presented. The system shows promising results, with great accuracy and performance. Its ability to provide good results, learn from previous experiences, adaptability to future visualization types and easy maintenance motivate further experimentation with this technique.
v
Acknowledgements
Gostaria de agradecer ao Professor Henrique Lopes Cardoso e ao Eng. Paulo Gomes pela sua contribuição na realização deste documento. Agradeço também a toda a equipa do Ansa, não só pela aprendizagem e disponibilidade, mas também pela excelente integração que me proporcionou durante a realização desta dissertação.
Deixo também um grande agradecimento à minha família mais próxima, por sempre garantir que nada me faltava e que tinha ao meu dispor todas as ferramentas para o sucesso. Obrigado pela vossa presença, dedicação e também pela vossa paciência. Quero também deixar um agradecimento especial à Sarinha, por todo o apoio, preocupação, amor e carinho, sempre. Obrigado por me fazeres tão sortudo.
Por fim, agradeço a todos os amigos que tornaram o meu percurso pela Faculdade de Engenharia um período inesquecível. Sejam Extraordinários, Clube das Minis, BEST Porto, camaradas de ataque aos exames ou simplesmente boa malta que tive o gosto de ir conhecendo. É também graças a vocês que tudo isto compensou.
vii
Contents
Chapter 1: Introduction ... 1
1.1 Motivation and Goals ... 1
1.2 Solution and Approach ... 2
1.3 Structure ... 2
Chapter 2: Ansa Platform ... 3
2.1 System Operation ... 3 2.2 Rule-Based System ... 6 Chapter 3: Background ... 9 3.1 Visualization ... 10 3.1.1 Concepts ... 12 3.1.2 Evaluation ... 15
3.2 Automatic Visualization Projects and Techniques ... 16
3.3 Case-Based Reasoning ... 18 3.3.1 Case ... 19 3.3.2 CBR Cycle ... 20 3.3.3 Case-Base Organization ... 21 3.3.4 Similarity Measure ... 22 3.3.5 Adaptation ... 22 3.3.6 Advantages ... 22 3.3.7 Pitfalls ... 23
Chapter 4: Proposed Approach ... 25
4.1 Development Methodology ... 25 4.2 Use Case ... 26 4.3 Requirements ... 27 4.3.1 Functional ... 28 4.3.2 Technological ... 28 4.3.3 Performance... 28 4.4 Architecture ... 29 4.4.1 Ansa ... 29
4.4.2 Ansa’s Visualization Rule-Based System ... 29
4.4.3 Proposed Architecture ... 30
4.5 Modules ... 30
4.5.1 Case-Base Ranking Module ... 30
4.5.2 Solution Generation Module ... 31
4.5.3 Feedback Management Module ... 31
Chapter 5: Development ... 33
5.1 Development Environment ... 33
5.1.1 JavaScript and Vue.js ... 33
viii CONTENTS
5.2 Case-Based Reasoning Solution ... 35
5.2.1 Case Representation ... 35
5.2.2 Case Retrieval ... 37
5.2.3 Reuse ... 38
5.2.4 Revision... 39
5.2.5 Retention ... 40
Chapter 6: Tests and Results ... 41
6.1 Performance ... 41
6.1.1 General Response Time ... 41
6.1.2 Influence of Problem Case Attributes ... 42
6.1.3 Influence of the Case-Base Size ... 42
6.2 Accuracy and Sensitivity ... 43
6.3 Results Discussion ... 47
6.3.1 Performance ... 47
6.3.2 Accuracy and Sensibility ... 47
6.3.3 Final Remarks ... 49 Chapter 7: Conclusions ... 53 7.1 Future Work... 54 7.1.1 Current Improvements ... 54 7.1.2 Experimentation ... 54 7.1.3 Ansa ... 56 References ... 57 Appendix ... 61
Appendix A – Resultset from the query “2016 revenue by month” ... 62
Appendix B – “Employees by unit” Resultset ... 63
Appendix C – “Volume by country by quarter” Case in JSON ... 64
Appendix D – Simplified Array Representation of the “Volume by country by quarter” Case ... 65
ix
List of Figures
2.1: Ansa Front Page ... 3
2.2: Detailed View of "Country" ... 4
2.3: "What is my total sales volume?" Output ... 5
2.4: "What were the sales by quarter by product in Germany in 2016?" Output ... 5
2.5: Bar Chart Output Example ... 6
2.6: Pie Chart Output Example ... 6
2.7: Pie Chart with Mouse Hovering ... 6
3.1: Visualization Example from Ansa ... 10
3.2: Bar Chart Example ... 13
3.3: Stacked Bar Chart Example... 13
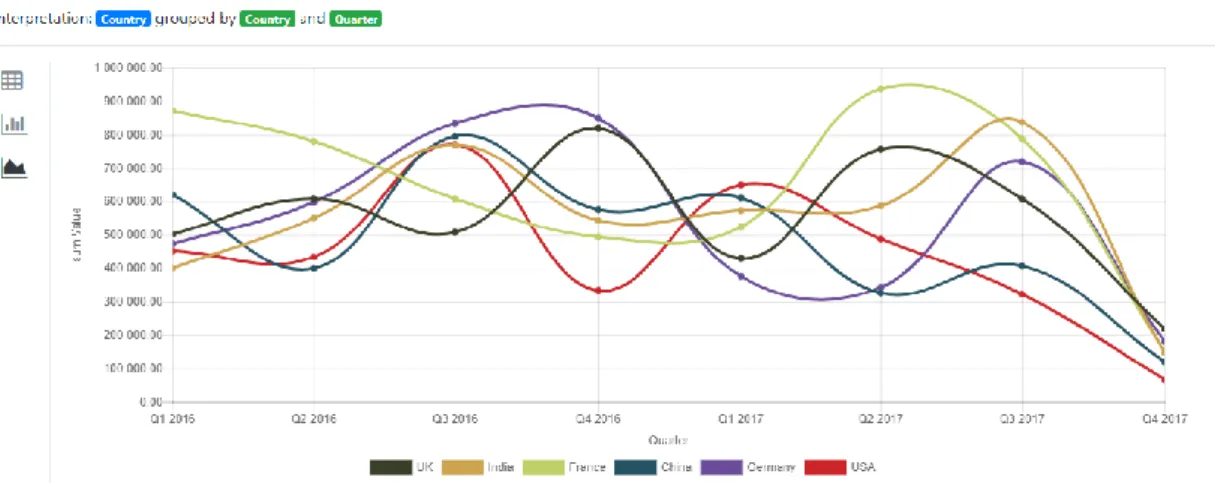
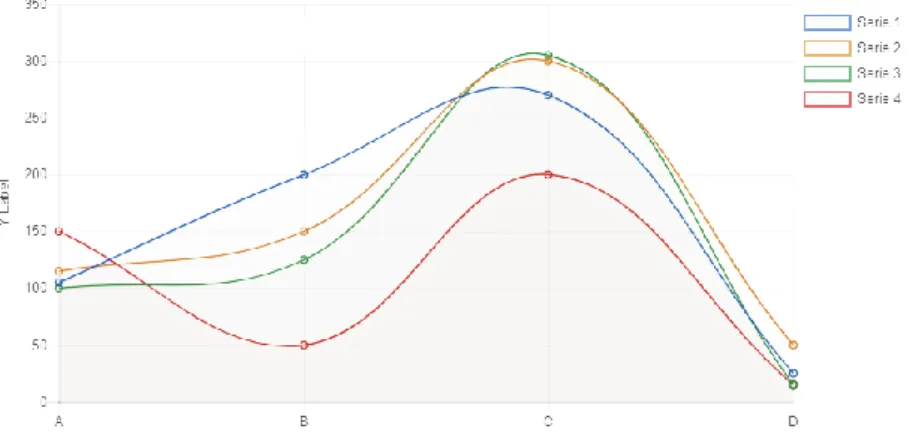
3.4: Line Chart Example... 13
3.5: Pie Chart Example ... 14
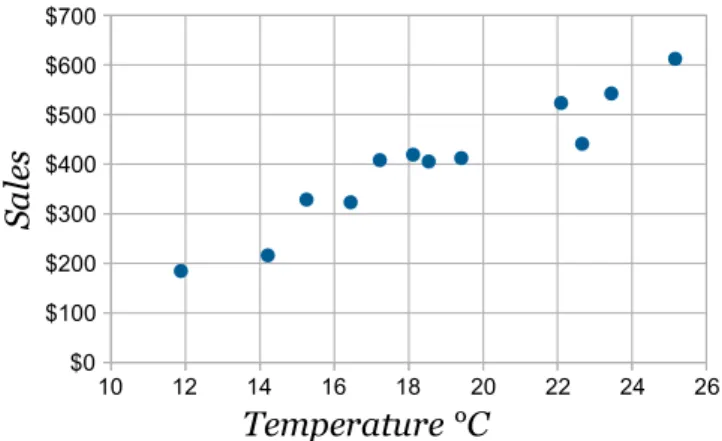
3.6: Scatter Plot Example ... 14
3.7: Histogram Example ... 15
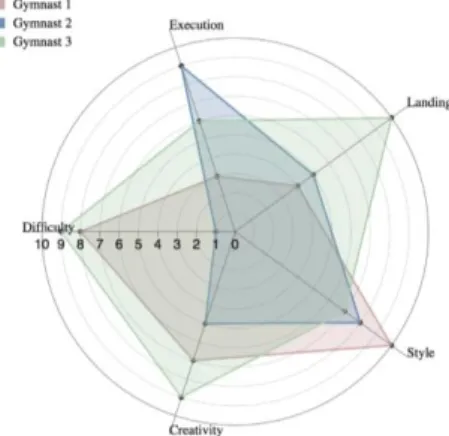
3.8: Radar Chart Example ... 15
3.9: Case-based Reasoning Cycle [24] ... 20
4.1: General Scrum Workflow [35] ... 26
4.2: Visual Representation Generation Flow ... 27
4.3: Ansa's Visualization Rule-Based System ... 30
4.4: Modules Overview ... 30
4.5: Case-Base Ranking Module ... 31
4.6: Solution Generation Module ... 31
4.7: Feedback Management Module ... 32
5.1: Typical Framework and Library Control Flow ... 34
6.1: RBS Proposed Chart for "Employees by Title" Query ... 50
xi
List of Tables
4.1: Functional Requirements ... 28 4.2: Technological Requirements ... 28 4.3: Performance Requirements ... 29 6.1: Test Environment ... 416.2: General Performance Test ... 42
6.3: Influence of Number of Problem Case Attributes in System Performance ... 42
6.4: Influence of Number of Case-Base Cases in System Performance ... 43
6.5: Possible ChartType Scores ... 45
6.6: Possible AxisUse Score ... 45
6.7: Individual Weight Tests ... 46
xiii
Acronyms
AI Artificial Intelligence
API Application Programming Interface
CBR Case-Based Reasoning
HTTP HyperText Transfer Protocol
IDE Integrated Development Environment
JS JavaScript
NLP Natural-Language Processing
1
Chapter 1
Introduction
We live in a time when data is generated at an unprecedented rate [1]. The amount of information generated in the business world is quickly becoming overwhelming to interpret, yet it is crucial for management decisions. Quickly making sense of such complex high-dimensional data, originating from numerous sources and presenting itself in various formats, is an important but intricate task. To tackle this challenge, Critical Software is developing Ansa, a conversational and search assistant platform intended to change the way companies interact with their data.
Virtual personal assistants are a common presence nowadays, providing a wide variety of services which increases by the day. However, some complex tasks are yet to be addressed by them, namely data analysis.
1.1 Motivation and Goals
The ambition behind Ansa is to develop a flexible solution, ready for adoption in different business areas, that allows its users to do analytical questions and queries in natural language for their data, such as “what are my top five customers in USA?”, “What were my TV sales in Japan last year?” or “Show me my sales volume throughout 2016”, and get the most appropriate response for their analysis. One of the important components in this kind of analytics assistant or chatbot is the way it shows its answers. Especially, the analytical answers that are best presented in a visual way, requiring clean, perceptive and adaptable graphical representations.
Selecting the most appropriate visualization to represent the data requested by the user presents itself as a vital challenge. Most people are not familiar with the graphical design principles needed to arrange data into graphical representations that support their reasoning process or communicate their analytical results to others [2]. As such, the system’s ability to automatically provide insightful visual representations is one of its most value-defining features. Thus, the goal of this dissertation is to create a system able to adapt itself to user’s preferences and types of data, and create such visualizations. It is also important that this system does not require complex maintenance and can be used in Ansa’s future when more visualization types are added.
2 INTRODUCTION
1.2 Solution and Approach
To face this challenge, this dissertation presents a case-based reasoning (CBR) approach. Given the information retrieved by the user’s query, the developed solution is able to decide which of Ansa’s visualization types to use and how to arrange the data attributes in different axes and/or series. This system, inspired by human reasoning, uses information from previous experiences (called cases) to understand and solve new problems. After determining which of the known cases is most similar to the new problem, the system compares the features of both and, having matched the case’s features to the problem’s features, it adapts the case solution in order to solve the new problem. It is also able to learn from user feedback, generate different solutions and it is easily adaptable to new graphical solutions which might be implemented in Ansa’s future. Developing such a solution requires answering some important questions. It is necessary, for instance, to determine what constitutes a good visualization and what key information defines the problem. For the success of the system, stored cases should hold the most relevant problem features and avoid unnecessary information. It is also critical to determine how to properly compare the cases to each other, as well as how previous experiences can be adapted to solve new problems successfully.
To allow for free experimentation, this solution has been developed separately from Ansa’s system, although access was granted to use its test databases, perform tests and analyse its back-end and front-end responses.
1.3 Structure
This document starts with an analysis of Ansa, in Chapter 2, explaining the typical uses of the system and the kinds of response it provides. There is also a section on rule-based systems, the methodology currently in use for selecting its visual representations. Chapter 3 presents the background knowledge for the developed work, covering general topics related to visualization as well as presenting an overview on projects related to Ansa and its goals. It ends with a detailed study of case-based reasoning, the focus of this work, covering its cycle, each of the main steps as well as its advantages and pitfalls. In Chapter 4 the proposed approach is presented. It starts by detailing the development methodology, followed by an example use case and the project requirements defined by the team. Afterwards the system’s architecture is described, as well as the modules that compose it.
Chapter 5 presents the developed work, from its environment to the implementation of each of the main CBR factors and stages.
In Chapter 6, system tests are described, evaluating its performance and accuracy. These tests are followed by the results discussion, where the outcomes of each type of test are analysed.
Lastly, Chapter 7 presents a conclusion on the developed system as well as a comprehensive reflection on the following steps and experiments to take to improve the current implementation.
3
Chapter 2
Ansa Platform
In this chapter an overview of Ansa’s system is presented, showing its user interface, functionalities and methodology for selecting visual responses.
2.1 System Operation
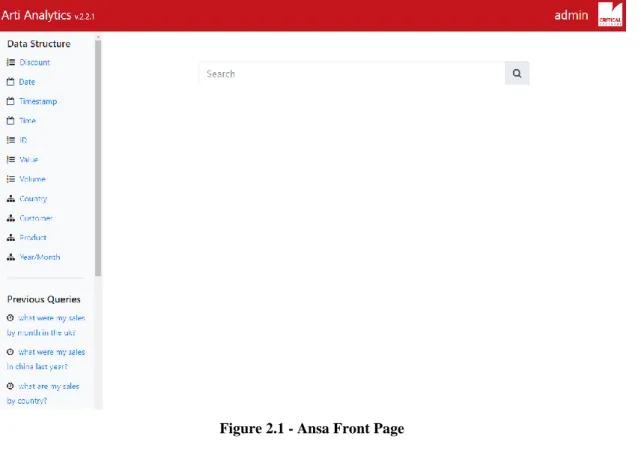
Ansa is a web-app, thus the user accesses it via web browser. After asking the user for login information, the current Ansa prototype reveals a clean page, highlighting its main tool, the search box, as seen in Figure 2.1.
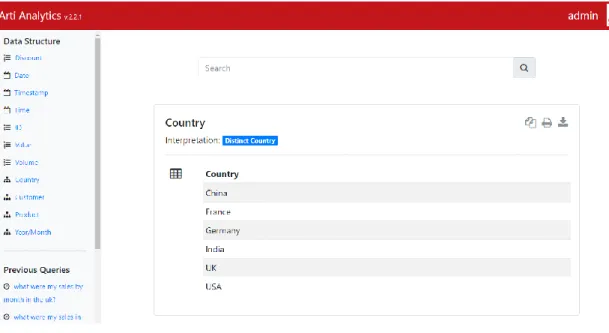
4 ANSA PLATFORM On the left panel it is possible to see the kind of information available in the database Ansa is running on. In this example a sales database is being used, which simulates the data of a generic business with products, customers and sales. Clicking each of these entities provides a detailed view of its content. This kind of result is presented as a simple table, as shows Figure 2.2. This “Data Structure” panel ensures the user keeps in mind the information he/she is working with, making it easier to create good queries for different kinds of analysis. Below it, the “Previous Queries” panel displays the history of previous queries input by the user.
Figure 2.2 - Detailed View of "Country"
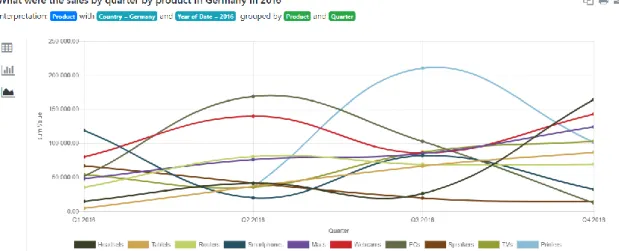
Ansa answers questions in different formats. In some cases, as seen in Figure 2.2, it returns a table to the user. For simple questions like “What is my total sales volume?”, the answer may be a single number (Figure 2.3), while more complex questions, such as “What were the sales by quarter by product in Germany in 2016?”, are best answered with a chart (Figure 2.4). For each query the system displays its interpretation, which is useful for understanding how it recognizes natural language and for debugging purposes. After retrieving the relevant data from the database, it is processed and fed to the visualization system, which determines the most relevant visualization to use. Whenever the system detects it is possible to display the information in other formats it includes the corresponding mock-ups on the left vertical bar. In the case of Figure 2.4, it is also possible to display the answer as a bar chart or in simple table format, yet the system displays the line chart first because it assumes it is the best representation for the query input.
With the purpose of having a better visualization of the platforms’ responses, the following output examples in this paper will contain only the answer box, ignoring the header and sidebar.
System Operation 5
Figure 2.3 - "What is my total sales volume?" Output
Figure 2.4 - "What were the sales by quarter by product in Germany in 2016?" Output
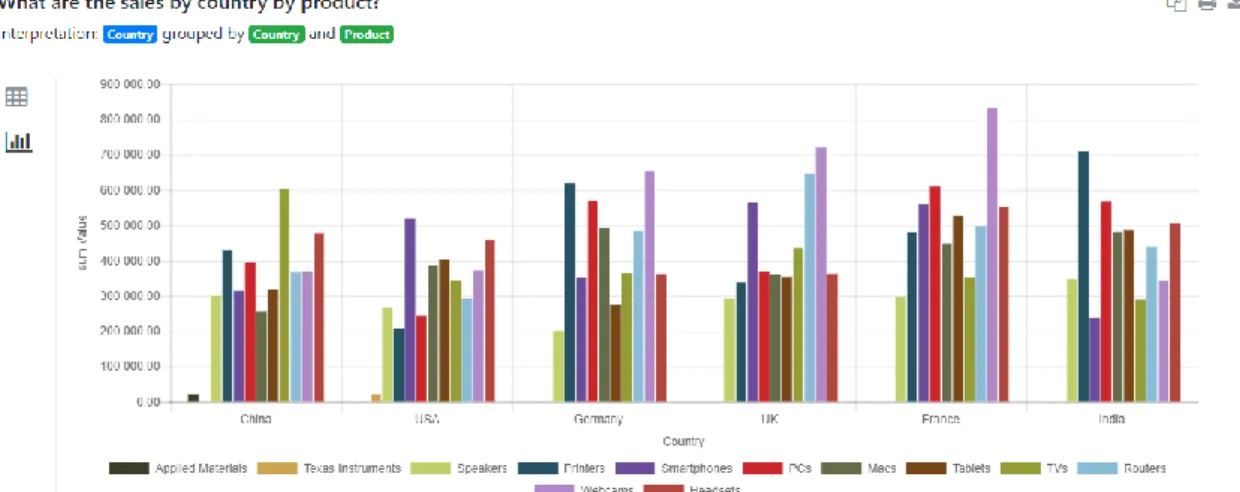
One of Ansa’s development goals is to be able to provide the most insightful output for the user’s query. Since most answers will be complex and the platform is expected to be usable in different databases without requiring a tailored set up, there must be a flexible solution for analysing the data and transforming it into the most useful kind of visual representation, with the most fitting parameters. Besides line charts (Figure 2.4) the other kinds of visualization currently implemented in Ansa are bar charts (Figure 2.5) and pie charts (Figure 2.6).
Independently of the visualization type, hovering over an area or data point of interest provides detailed information about it. In Figure 2.7 the mouse was hovering the Male section of the pie chart, revealing the total count of male employees.
6 ANSA PLATFORM
Figure 2.5 - Bar Chart Output Example
Figure 2.6 - Pie Chart Output Example Figure 2.7 - Pie Chart with Mouse Hovering
2.2 Rule-Based System
The implementation of automatic visualization in Ansa is currently done using a rule-based system (RBS), meaning each chart representation shown by the system is the result of a set of rules put together for that specific kind of query outcome and chart type. Upon receiving and processing the query results, the different parameters must fall within one of the predesigned rules for chart selection and creation, where the corresponding actions are applied for determining which columns of the resulting table (referred to as
attributes), should be used as the X-axis, the Y-axis and the Series of the chart response.
This process is described in greater detail in Section 4.4.2.
A typical advantage of rule-based systems is that, when the domain is narrow enough and well understood, experts are able to express their knowledge in the form of rules for problem solving [3]. In this case, by creating a substantial set of rules, which consist of a series of IF-THEN statements, it is possible to produce accurate. Rules are a natural form of expressing knowledge in a domain and these usually provide a uniform structure, where each rule is an independent piece of knowledge, resulting in a modular system.
Rule-Based System 7
This is the kind of approach currently used in Ansa for determining data visualizations. It is a common solution which has shown good results for other problems [2][4][5] and has proved to be extremely effective in the right conditions, using the right set of rules. However, there are some inconveniences that must be considered [3][5]:
• Infinite chaining: Rule-based systems must be crafted carefully to avoid infinite loops.
• Possibility of contradictions: As the knowledge base (rules set) increases, its modification can get increasingly difficult. Introducing new knowledge to solve a specific problem (e.g., adding a new rule) may cause unexpected contradictions with the previous rules. Equally, if an existing rule is to be changed, the way it affects the remaining ones must be carefully studied to avoid unplanned consequences.
• Opaque relations between rules: Although individual rules are relatively simple and self-documented, their logical interactions within large rule sets may be hard to grasp, making it difficult to observe how individual rules serve the overall strategy of the system.
• Complex domains: Some domains are of such complexity that solving them with a RBS would require tens of thousands of rules (e.g., using a rule-based system to deal with air traffic control).
• Inefficient search strategy: For large rule sets efficiency is a challenge. Since the inference engine searches through all the rules during each cycle, this can result in a slow exhaustive process. This way, extensive rule-based systems can be unsuitable for real-time operations or applications where the user expects a fast response.
• Inability to learn: In general, rule-based systems do not have an ability to learn from experience. Unlike a human expert, who knows when to deviate from the rules or how to learn from a new successful or failed experience, an expert rule-based system can not automatically modify its knowledge base, or adjust existing rules or add new ones. The knowledge engineer is still responsible for manually revising and maintaining the system.
• Dependency on domain expertise: In order to provide good results there must be a very solid understanding of the domain in which the system is operating. Even if there is an extensive rule list, it is not enough to create a good result if the domain is not well understood or properly represented.
Some of these RBS characteristics are not desired for a system that intends to be a flexible tool adaptable to various kinds of users with different use cases and purposes, such as Ansa. Currently, the implemented rule-based system is capable of providing good visual representations for most types of data that it has been programmed to deal with, but the inability to learn means it may be dependable on adjustments for other kinds of data or visualization settings that may come up in the future, removing from the table what would be a very interesting feature to have in this kind of system. Moreover, the dependency on domain expertise is another disadvantage, as determining the most appropriate data visualization for all kinds of data is not a task for which there is a strong underlying understanding [6].
8 ANSA PLATFORM Motivated by these challenges, the Ansa team was set to experiment with a different approach. Previous experiences with case-based reasoning in other systems drove the team to try the technique for the problem of selecting the best data visualization and its parameters for a given data response. That decision resulted in the proposal of this dissertation.
9
Chapter 3
Background
The past few years have been marked by the rapid development of computer hardware and software [7]. This noticeable growth in computing power has enabled us to collect and store data at higher rates and scales than ever before. Often the information is of such magnitude that simply reading through it is not enough to understand it. In the words of S. J. Walker [8, p. 1], “We’re in an age where numbers no longer incite awe, since they’ve
become loosened from the mooring of human scale and cognition. What does it mean when we are informed that Google produced more than 24 petabytes of data per day, or that the world sends 400 million tweets a day? Such numbers neither impress nor disappoint any more”.
Being able to fully understand the information at one’s disposal is a great challenge which can provide vital insights. It is often necessary to make crucial decisions based on collected data. To help us do so, the fast accumulation of data has incited the demand for developing strategies to display high volumes of data in a comprehensible way. To achieve it, many techniques were developed, collectively known as data visualization. A visualization does not have to include all the available information on what it intends to represent, but it must be based on it or its characteristics. What motivates data visualization is that it allows displaying large volumes of data in a compact, yet comprehensible manner. Data visualization as a practice can be traced back to early times, when man first learned how to draw [7]. Findings, such as some of the drawings in Lascaux’s cave system, estimated to be 17,300 years old, show what is believed to be maps of stars and constellations [9]. Yet, throughout the course of history, data visualization has been an unpopular topic with few developments. In the seventeenth century, René Descartes contributed to it with a critical development, the invention of the Cartesian coordinate system, which allowed data to be visualized using two dimensions (or even more if points are given different sizes, colours, symbols, etc.), revolutionizing mathematics at its time. At the end of the eighteenth century, modern signs of data visualization became apparent as people started using the Cartesian coordinate system to display line graphs.
Over the last decades, developments in informatics have caused a rapid growth in interest and progress of the data visualization field, along with the development of better hardware and software able to render complex imagery. Today, data visualization is considered to be a branch of modern descriptive statistics, involving the development and study of techniques that convert raw data into imagery [7].
10 BACKGROUND In the following sections, important aspects of data visualization will be discussed. This is followed by an analysis of projects related to Ansa and their approaches, as well as an in-depth study of case-based reasoning, this thesis’ technique of focus.
3.1 Visualization
Throughout the years the meaning of visualization has shifted. According to the Shorter Oxford English Dictionary [10] from 1972, it used to mean constructing a visual image
in the mind, while nowadays this is a secondary meaning, giving way to its current main
definition, the representation of an object, situation, or set of information as a chart or
other image [11]. It is clear through this example that visualization is evolving, and so is
its role in society. We acquire more information through vision than through all of the other senses combined [12], and in a world where we gather more data than ever before, there is an undeniable motivation to use and improve the current data visualization techniques. One of the greatest benefits of data visualization is the great quantity of information that can be rapidly interpreted if it is properly presented.
Figure 3.1 – Visualization Example from Ansa
A good visualization, as described by E. Tufte on the topic of graphical excellence [13, p. 48], should give the viewer “the greatest number of ideas in the shortest time with the
least ink in the smallest space”. These ideas should be communicated with clarity,
precision and efficiency, while truthfully representing the data. Some of the advantages of a good visualization are [12]:
• Providing the ability to comprehend great amounts of data;
• Providing the perception of emergent properties that were not anticipated. The perception of a meaningful pattern can often be the basis of a new insight; • Enabling problems with the data itself to become apparent. A visualization
commonly reveals information not only about the data itself, but about the way it is collected. With an appropriate visualization, errors and artefacts in the data often stand out, making visualizations a valuable tool for quality control.
• Facilitating the understanding of large-scale and small-scale features of the data. It can be especially valuable in providing the perception of patterns linking local features.
Visualization 11
While there is not a master formula for creating a visual representation, there are some relevant points to be regarded. Ware [12] has presented the process of data visualization as four interconnected stages: The collection of data and its storage; the pre-processing designed to transform the data into understandable pieces; the data processing and display, through algorithms that turn the information into a visual representation; and the perceiver of the visualization, presumably the human perceptual and cognitive system. His assumption is that once the best way to visualize data for a particular task is defined, it is possible to construct algorithms to create the appropriate visualizations.
In his literature, R. Mazza [6] divided the procedure to create a visual representation in five steps:
• Defining the problem: It is recommended that time is spent with the potential users of the representation, to identify their effective needs and how they operate. This is necessary to define what needs to be represented, how it should be represented, and, also important, why it needs to be represented. The visualization may be needed to communicate with a particular target, for finding new information, or possibly to prove a hypothesis. It is necessary to bear in mind the human factors specific to the target audience of the application and their cognitive and perceptive abilities. This will influence the choice of which visual models to use, to allow users to better understand the information.
• Examining the nature of the data to represent: It is possible to divide data in three main categories. It can be quantitative (e.g., a list of integers or real numbers), ordinal (of a non-numeric nature, but which has its own intrinsic order, such as the days of the week), or categorical (data that has no intrinsic order, such as the names of people or cities). Each of these types of data may require a different kind of processing and mapping.
• Determining the number of attributes of the data: The kind of visual representation used is strongly related to the number of attributes (also called dimensions) of the data. Attributes can be dependent or independent. Dependent attributes are the ones that vary, and therefore the ones for which there is an interest in analysing (e.g., when examining a product’s sales over time, the sales would be a dependent attribute, while the time measure would be independent). • Creating data structures: These can be linear (data is codified in linear
structures such as vectors, tables, etc.), temporal (data that changes in time), spatial or geographical (data with a physical correspondence), hierarchical (data relative to entities organized on hierarchy), and network structures (data that describes relationships between entities).
• Determining the type of interaction: As a final step, the desired type of interaction should be determined. Depending on the purposes of the visualization, it may be static (e.g., an image printed on paper or represented on a computer screen but not modifiable by the user), transformable (when the user can control the process of modification and transformation of data, such as varying parameters of data entry, varying the extremes of the values of some attributes, or choosing a different mapping for view creation), or manipulable (the user can control and modify parameters that regulate the generation of the views, like zooming on a detail or rotating an image represented in 3D).
12 BACKGROUND
3.1.1 Concepts
It is important to establish a solid understanding of some fundamental concepts on the topic of visualization, as they will be the basis for following the challenges and proposed solutions of this thesis.
Chart
In the context of data visualization, a chart is a graphical representation of data, in which the data is represented by symbols, such as bars in a bar chart, lines in a line chart, or slices in a pie chart [14]. There are several kinds of chart and while each of them has its own characteristics, they share the same purpose of achieving the goals mentioned in the previous section. As C. Woods [15, p. 26] put it, “charts can express more on one page
than is sometimes expressed in several chapters of writing”.
The selection of which chart type to use depends on the data that needs to be displayed. For example, data that presents percentages in different groups (such as "satisfied”, “not satisfied” and “unsure") is often displayed in a pie chart, but may be more easily and accurately understood when presented in a bar chart [16]. On the other hand, data that represents numbers that change over time (e.g., a company’s sales from 2015 to 2017) might be best shown as a line chart. In some cases, the reason for retrieving the data itself may influence the best chart type to choose, or the specific chart parameters to use. Generally, the most relevant elements that make up a chart are:
• Item: An item, also called data point, is a single element in a chart (e.g., a single bar in a bar chart, a single point in a scatter plot, a slice from a pie chart).
• Axes: References for visualizing the data. The amount of axes necessary for a chart depends on the dimensions of the data being represented. Each axis will normally have a scale, denoted by periodic graduations and accompanied by numerical or categorical indications.
• Values: The set of measurements for each axis of an item (in a simple chart with two axes, these could be the typical X and Y values).
• Series: A collection of measurements. Generally, a set of data is called a series. The line connecting the data points in a line chart, for instance, represents a data series. If the same line chart has several lines, that would mean there are several series being displayed, using the same axes as reference.
• Labels: An important part of any chart which simplifies the process of understanding what is being displayed. Typically, there is a title along with the chart and each axis will also have a label displayed outside or beside it, briefly describing the dimension represented.
Chart Types
Chart configuration is one of the main areas of study of this project. In this section an overview of the most common chart types and their characteristics is presented.
Visualization 13 Bar Chart
The bar chart (Figure 3.2) presents data with rectangular bars with lengths proportional to the values they represent. One axis of the chart shows the specific categories being compared while the other axis represents the corresponding values. Variations of this chart may use the bars horizontally or vertically, and the different series may be grouped in clusters side by side or stacked on top of each other, as shown in Figure 3.3, allowing for different kinds of analysis of the same data.
Figure 3.2 - Bar Chart Example Figure 3.3 - Stacked Bar Chart Example
Line
Line charts (Figure 3.4) are similar to bar charts, but the data being displayed is continuous. The data points are connected either by a straight or a smoothed line to represent the data variation. It is also possible to stack the lines, as was done with the bar chart bars in Figure 3.3.
Figure 3.4 - Line Chart Example Pie
Differently from the previous chart types, the pie chart (Figure 3.5) only has one axis. It is a circular graphic which is divided into slices that illustrate the numerical proportion of the data. It is widely used but also criticized for being difficult to compare different sections of a given pie chart, or to compare data across different pie charts [13]. Often, there may be some extra indications to help with these issues, such as displaying the actual value or corresponding percentage in each slice.
14 BACKGROUND Common variations of the pie chart include the doughnut chart, which has a blank centre, allowing for additional information to be displayed, the exploded pie chart, where one or more sectors are highlighted by being separated from the rest of the circle, and the polar area diagram, where sectors have equal angles and differ rather in how far each one extends from the centre of the circle.
Figure 3.5 - Pie Chart Example Scatter Plot
The scatter plot (Figure 3.6) consists in the display of data points in a grid and is useful to reveal relationships between the variables being analysed.
Figure 3.6 - Scatter Plot Example Histogram
A histogram (Figure 3.7) is a plot that demonstrates the underlying frequency distribution of a set of continuous data. This enables the inspection of the data for its distribution (e.g., normal distribution), outliers, skewness, etc. [17]. In this chart, the data is arranged into intervals, called bins, dividing the range of values in equal parts and displaying the frequency of the data in each of the bins. Unlike bar charts, histograms are only used to plot the frequency of occurrences in continuous data, therefore there are no gaps between the bars (although some bars might be absent, indicating no frequency of occurrence). In contrast, bar charts may be used for a great number of other types of variables, including ordinal and nominal data sets, which makes them more adaptable.
Visualization 15 Radar
Radar charts (Figure 3.8), also known as spider charts, consist on the representation of three or more variables represented on axes starting from the same point. The relative position and angle of each axis is typically uninformative. It is a useful technique for analysing which datasets are most similar and to find outliers in the data.
Figure 3.7 - Histogram Example Figure 3.8 - Radar Chart Example
3.1.2 Evaluation
At the start of this chapter we discussed what constitutes good visualizations. This, however, might not be enough to know how to evaluate them. Choosing the appropriate chart type for a given data is not a trivial task. Not only there is not a particular set of rules, but also it seems that the proper chart type to use may depend on who will be using the data. Two users faced with the same visual representation might express completely different and contrasting judgments. Experience, prior knowledge, and perceptive and cognitive ability differ from person to person, which can result in diverging opinions [6]. For example, some might say pie charts are bad for visualizing data. Tufte goes as far as labelling them as dumb in The Visual Display of Quantitative Information [13], based on it leaving the viewer with the uneasy and uncertain task of estimating and comparing areas or angles in order to take conclusions. According to him, even a simple table will almost always be a better option. Yet, it is an undeniably popular chart type that can often be found in business and media.
As such, it is necessary to define some metrics to assist in the task of evaluating the visualization system. According to Mazza [6], the main objectives of study in the evaluation process are:
• Functionality: Does the visual representation provide all of the functionalities requested by the user and identified during the requirements definition stage? • Effectiveness: Does the visual representation provide the users with a better
knowledge of the data than the traditional non-visual methods would provide? In particular, does the use of visual representations allow the users to have more useful and precise information on the data than other tools? Or, is there additional information that is made available exclusively by the visual representations?
16 BACKGROUND • Efficiency: Can the visual representation provide the users with information more
rapidly than other tools?
• Usability: Is the interaction with the graphical interface simple and intuitive enough for the user?
• Usefulness: In what way, and in what context, is the information provided by the graphical representation useful to the user?
Depending on the type of application and the resources available for the evaluation process, it is possible to only evaluate a subset of these parameters. For example, in some cases it might be enough to evaluate the functionality, usability and effectiveness of a representation, assuming the usefulness is intrinsic in the desire to implement this feature and that efficiency is not a critical factor for success or, possibly, it is not yet a concern at a given development stage.
Since methodologies specific for evaluating systems of visual representations do not exist, techniques from human computer interaction have been adopted [6], which can essentially be subdivided into analytic methods and empirical methods.
Analytic evaluation methods are mainly based on cognitive and behavioural studies. They are carried out by experts who use the system to verify if it is compliant with a series of predetermined heuristics. An evaluator may also define a series of use cases and simulate the user’s behaviour attempting to perform predetermined tasks, identifying possible problems that could originate from each of them.
Empirical methods make use of experiments using working prototypes of the system and its final users. The experiments may be quantitative, using controlled experiments, or qualitative, using interviews with the users, taking note of direct observations, creating focus groups, etc.
3.2 Automatic Visualization Projects and Techniques
Generating visual representations from user’s data is an ambition shared across different
projects. Some examples backed by powerful companies are IBM’s Watson Analytics1
and Microsoft’s Power BI2, both of which include the possibility of interacting with the
system using natural language. Just as Ansa, they intend to be used across different sectors and enable users without data analysis expertise to examine their data, discover relationships, test correlations and look for any kind of insight of their interest. These projects, however, do not go into detail on their implementation of automatic data visualization.
An early approach to this challenge, carried out by Jock Mackinlay [18], attempted the development of an application-independent presentation tool that would automatically design effective graphical presentations of relational information. According to the research, the main problems faced were the encoding of graphic design criteria in a way that could be used by the tool and the generation of a wide selection of designs to represent various types of data. Once provided with the data for representation, the system
1 https://www.ibm.com/watson-analytics 2 https://powerbi.microsoft.com/
Automatic Visualization Projects and Techniques 17
used a divide-and-conquer style algorithm, with three steps: partition, selection and composition. Each step involved choices to create composite designs. When this was not the case, backtracking was used to generate different solutions. The logic program developed included about 200 logic programming rules, making it a relatively complex solution.
Show Me [2], a project integrated in a commercial visual analysis system called Tableau3, relies on the user specifying which data or data transformation (e.g., the values sum) should be used as columns and rows, and uses an internal ranking for chart types based on their popularity and difficulty of interpretation. For its response, the data is analysed and a set of rules determines which chart types can be used, from which the best ranked one is selected. The rules are mainly based on the data type and number of attributes. There is also a set of chart types that is not ranked and not proposed by the system, but may be selected by the user if more visualization alternatives are requested. In total this system includes 14 types of visualization, some of which are very specialized for particular types of data, meaning they are highly ranked yet rarely used as the conditions for their application are rarely satisfied (an example was the Gantt chart).
Articulate [19] intended to tackle the same challenge and also included NLP processes.
In this system, the user’s query is examined to identify what kind of analysis is being requested (relationship, comparison, composition or distribution). From then on, a set of rules related mainly to the type and number of variables determines which of the visualization options should be used, similar to what is done in Ansa.
DataTone [20] goes further than Articulate, enabling the users to follow up on their query,
adjusting the output visualization accordingly. From the user query and its output, DataTone creates what it calls visual specifications to generate the appropriate visualizations. The system creates more than one visualization for the problem and provides the one it considers the best, while retaining information on the ambiguities encountered in the process. To deal with such uncertainties, this response is presented along with widgets which allow the user to intervene and adjust it as they see fit, correcting the decisions made by the system.
The Natural Language Driven Data Visualization project (NL4DV) intended to create a toolkit to provide developers and designers of visualization systems with high-level functions for using natural language query interfaces as extensions to their existing systems or build visualization systems entirely driven by natural language [21]. Its main modules consisted of a query processor, an attribute extractor, a task identifier and a visualization recommendation engine. The attribute extractor uses information from the query processor to identify the data attributes mentioned in the user’s input, while the task identifier generates a list of tasks implicitly or explicitly stated in the input query. It recognizes 10 types of task (retrieve value, filter, compute derived value, find extremum, sort, determine range, characterize distribution, find anomalies, cluster, and correlate). Provided with the recognized attributes and tasks, the visualization recommender module selects the chart type and how to use the attributes. While the method used is not explicitly specified, it is also presumably a rule-based system.
Several approaches in this field of study are focused in the challenges related to processing natural language and fetching and preparing the most relevant data, rather than
18 BACKGROUND in the generation of the visual representation itself, which tends to be a variation of a RBS with different degrees of complexity. However, some experiments with case-based reasoning can also be found in literature.
The work of Michelle Zhou and Min Chen [22], from the IBM T. J. Watson Research Centre, was the first to attempt this approach. Motivated by the skill-dependent and time-consuming task of creating effective visual presentations, they developed a case-based visualization generation algorithm, which uses a database of existing graphic examples to automatically create visual presentations for new user requests. This work achieved good results, presenting more versatile design suggestions than a standard rule-based approach does according to their tests based on user feedback. The documentation puts an emphasis on three unique features: the adequacy-guided case retrieval method, which consists of a similarity metric with a set of adequacy evaluation criteria to retrieve the top-matched usable case; the case-base organization, which enhances case retrieval speeds by organizing cases into hierarchical clusters based on their similarity distances and by using dynamically selected cluster representatives; and an adaptation technique, which creates a solution based on multiple cases.
In “Creating Visualizations: A Case-Based Reasoning Perspective” [23], Freyne and Smyth attempted a simpler approach. They intended to assist users of a web based visualization system in producing better visualizations by recommending visualizations that had been previously used for datasets similar to their own. Their approach was limited: there was a reduced number of case features and the system’s response would only suggest the best chart type to use, not indicating how to organize the data attributes into axes and series, for example. Yet, the system performed very well in practice, outperforming the remaining techniques in their tests, which were based on random selections, popularity, or exact matching of the input.
3.3 Case-Based Reasoning
Case-based reasoning is a problem-solving technique. Its most defining feature is that rather than relying uniquely on general knowledge of a problem domain, or making associations along generalized relationships between problem descriptors and conclusions to find the solution for a problem, CBR is able to use the specific knowledge of previously experienced, concrete problem situations, referred to as cases. A new problem is solved by finding a similar past case and reusing it in the new problem’s situation. A second important feature is that CBR is an approach to incremental, sustained learning, since each new experience is retained every time a problem has been solved, making it immediately available for future problems [24]. As the system solves new problems, its case-base (the collection of known problems with verified solutions) grows, resulting in better proposed solutions for the problems to come.
It is common to find this kind of reasoning in day-to-day situations [25]. Ordering a meal at a restaurant, our choice will often be based on previous experiences in that restaurant or similar ones. While arranging our weekly schedule, we rely on the past to determine how long certain tasks take, and use that knowledge to adjust our plans. Likewise, a mother breaking up a fight between two children remembers what worked and didn’t work previously to calm such situations, and bases her actions and suggestions on those experiences.
Case-Based Reasoning 19
Examples of CBR-like decision making are many and are not contained within common sense situations. A medical doctor examining a patient with distinct symptoms might determine the most appropriate treatment by recalling another patient that was treated weeks earlier and showed similar, relevant, key characteristics. Properly evaluating the relevancy of case characteristics is an important part of the process. Possibly, a previous patient was also wearing a white shirt and jeans, but this would (almost certainly) not be related to the illness, so a higher quality comparison can be made when focusing on the previous patients’ symptoms instead. Likewise, a drilling engineer, who has experienced dramatic blowout situations, is quickly re-minded of these situations when the combination of critical measurements matches those of a blowout case. He might also be reminded of a mistake he made when the blowouts occurred and use this to avoid repeating the error. A financial consultant working on a difficult credit decision task will be influenced by his experience with previous cases where companies with similar problems as the current one failed, and recommend that the loan application should be refused.
The examples are numerous and, software-wise, this technique has shown the potential for great results when many well-documented histories of past problems and their solutions exist [4][26]. In the following sections the main CBR concepts and stages will be described.
3.3.1 Case
In advance of the following sections, it is important to have a clear idea of what a case is. A case is a contextualized piece of knowledge representing an experience. In general, a case may consist of a problem description, which represents the state of the world when the case occurred, a problem solution, which represents the derived solution to that problem, and/or an outcome, which describes the state of the world after the case occurred [27].
Cases that comprise problems and their solutions can be used to derive solutions to new problems, while cases comprising problems and outcomes can be used to evaluate new situations. If such cases also contain solutions, they can be used to evaluate the outcome of proposed solutions and prevent potential problems. Cases with higher amounts of information can be more useful, but they increase the system’s complexity, making it harder to use. For this reason, most CBR systems are limited to storing only problem descriptions and solutions.
Cases can be represented as simple feature vectors, or using any typical AI formalism such as frames, objects, predicates, semantic nets or rules. [27]. The choice of which representation formalism to use is largely determined by the information to be stored within a case.
Throughout this document two main types of case will be mentioned: cases from the case-base, which are problem-solution pair; and problem cases, which represent the new problem being input to the system and do not have a defined solution. Later on, in the tests and results section (Chapter 6), test cases will also be mentioned. These are similar to case-base problem-solution cases.
Cases are the basis of any CBR system: a system without them would not be a case- based system. However, a system including only cases and no other explicit knowledge (not
20 BACKGROUND even in the similarity measures) is difficult to distinguish from a nearest-neighbour classifier or a database retrieval system [27]. In other words, such system does not exploit the generalisation and adaptation potential of CBR, usually resulting in poor performance due to inefficient retrieval based upon case-by-case search of the whole case-base.
3.3.2 CBR Cycle
Generally, a typical Case-based Reasoning cycle may be described by the following four processes, sometimes referred to as the four REs [24]:
1. Retrieve the most similar case or cases;
2. Reuse the information and knowledge in that case to solve the problem; 3. Revise the proposed solution;
4. Retain the parts of the experience likely to be useful for future problem solving.
A new problem is solved by retrieving one or more previously solved cases, reusing the case in some way, revising the adapted solution and retaining the new experience by incorporating it into the existing knowledge-base (case-base). This cycle is visually represented in Figure 3.9.
Figure 3.9 - Case-based Reasoning Cycle [24]
In detail, a new case is generated from an initial description of the problem. The difference between the problem itself and the case generated from it is that the case only includes some of the problem’s information. The data that is considered irrelevant is removed from the problem, keeping only the features of interest that are intended to be analysed by the system and compared to other known cases. This new case is used to
Case-Based Reasoning 21
retrieve a case from the case-base, the one that is found to be the most relevant to the new problem. The retrieved case is then combined with the new problem case, and is reused to propose a new solution, solving the case. This proposed solution goes through a revision phase, where it is tested for success, either by being applied in a real-world environment or evaluated by a teacher. According to its performance or feedback it may or may not need to be repaired. During the retention process, the experience is retained for future reuse, and the case-base is updated by the introduction of a new learned case, or by modification of some existing cases.
Based on this cycle, it understandable that the quality of a case-based reasoner's solutions depends on five main aspects [25]: The experiences in its knowledge base, its ability to understand new situations based on those old experiences, its aptitude at adaptation, its aptitude at evaluation, and its ability to appropriately integrate new experiences into its memory.
3.3.3 Case-Base Organization
Case storage is a vital aspect when it comes to designing an efficient CBR system, as it is responsible for providing the means to create an efficient and accurate search. These two qualities are usually inversely proportional [27], as an accurate retrieval guarantees that the best matching case will be retrieved, and efficient retrieval guarantees that cases will be retrieved fast enough for acceptable system response times. It is easy to ensure accurate retrieval if efficiency is sacrificed (e.g., by matching all the cases), as it is simple to have a fast retrieval if only a fraction of the employed case-base is searched, possibly missing relevant examples. Therefore, the challenge is to tune the case-base organization and the retrieval algorithm in order to adjust this compromise between accuracy and efficiency of the retrieval algorithm.
In general, there are three main approaches for case-base organization: flat, clustered and hierarchical organization.
Flat organization is the most straightforward case-base type, where the case-base follows a flat structure, such as a list. It is simple to create and to maintain, and retrieval usually searches case-by-case through the whole list. This means it can be very accurate, but also less efficient, especially for medium and large case-bases.
The clustered organization approach is based on gathering clusters of cases. Clusters may be based on mutual similarity or on the similarity to some prototypical cases. The advantage being that the selection of the clusters to be matched would be simple as it would be based on the indexes and/or prototypical cases characterising the clusters. A disadvantage is that this makes adding or deleting a case more complex than in a simple flat organised case-base.
A hierarchical organization is the case-base organisation that is generally obtained when cases that share the same features are grouped together. The case memory is organized as network structure of categories, semantic relations, cases, and index pointers. Each case is associated with a category and the categories are inter-linked within a semantic network. A common approach is having abstract cases, offering high level solutions, and concrete design cases, making it possible to decompose target problems into simpler sub-problems, reusing parts of complex problems as individual cases and recombining solution parts into a coherent whole [28].
22 BACKGROUND
3.3.4 Similarity Measure
A retrieval algorithm should retrieve the cases that are the most similar to the current problem being analysed by the CBR system. This task of comparing cases in order to determine the degree of similarity between them has been executed with a variety of methods, such as induction search, nearest neighbour search, serial search, hierarchical search, parallel search, etc. [27]. It is considered to be one of the core and most challenging tasks in developing a good CBR system [29].
The simplest form of retrieval is the 1st-nearest-neighbour search of the case-base, which performs similarity matching on all the cases in the case-base and returns the best match. As one might expect this method may result in long retrieval times, especially for large case-bases. Therefore, cases are usually preselected prior to similarity matching. Cases can be preselected using a simpler similarity measure that excludes the ones that are not considered a match and as such are not worth the time for performing the full similarity measure process.
3.3.5 Adaptation
Once the best matching case is selected for use, it may not be directly usable to solve the problem or situation being processed. Adaptation looks for prominent differences between the retrieved case and the current case, and, generally, applies a formula or a set of rules to account for those differences when suggesting a solution. It is a domain specific task, for which there are two general approaches [30]:
• Structural adaptation: applies adaptation rules directly to the solution stored in cases. If the solution comprises a single value or a collection of independent values, structural adaptation may involve modifying certain parameters in the appropriate direction, interpolating between several retrieved cases, voting, etc. However, if there are interdependencies between the components of the solution, structural adaptation requires a thorough comprehension and a well-defined model of the problem domain.
• Derivational adaptation: reuses algorithms, methods, or rules that generated the original solution to produce a new solution to the problem currently presented to the system. As such, this approach requires knowledge about how the solution was achieved in the first place, so it is very domain specific and can only be properly performed when there is an underlying understanding of how the recorded solutions were selected.
3.3.6 Advantages
As a reasoner, Case-based Reasoning provides several advantages [25].
To start with, it allows the reasoner to quickly propose solutions to problems without needing to derive them entirely from scratch. While it is always necessary to analyse the new case, with CBR there is a considerable amount of computations and inferences that are skipped. This advantage is helpful for almost all reasoning tasks, including problem solving, planning, explanation, and diagnosis.
Case-Based Reasoning 23
Case-based reasoning also allows a reasoner to propose solutions in domains that are not completely understood. One might say that some domains are impossible to completely understand, such as areas which are strongly connected to human behaviour as is the economy, while others might just not be completely understood yet, such as some areas of medicine. In the medical doctor’s example, from earlier in Section 3.3, it is possible that the patient will be cured as a result of the doctors reasoning and inferences based on the previous cases, and even though the doctor does not completely understand every detail on how treatment A works for the unknown illness with symptoms X, Y and Z, he does know it works, and he can retrieve and reuse that knowledge.
Moreover, CBR makes it possible for a reasoner to generate solutions when no algorithmic method is available for evaluation. It is possible that in some cases there simply is not enough knowledge to derive a dedicated algorithm for problem solving. Evaluating solutions based on previous similar situations might be the only sensible option, leaving the reasoner to make its decision based on what worked in the past. Cases are also useful for interpreting open-ended, poorly defined concepts. A frequent example of this is the way attorneys use past cases and judge decisions as arguments for determining the outcomes of new cases. The domain may be lacking in theory and the interpretation of known cases may be used as a compensation method. The performance of Protos, a program designed to learn categories of a specific domain and classify new cases by explaining their similarities to known exemplars [31], in classifying hearing disorders when little information is known shows that a case-based methodology for interpretation can be more accurate than a generalization-based method when classifications are poorly defined.
Remembering previous experiences may also be useful for warning of the potential for problems that have previously occurred, alerting a reasoner to take actions to avoid repeating similar mistakes. Remembered experiences may be successful or failure episodes, i.e., situations in which the solution was not successful (or as successful) as expected. Also having the knowledge derived from such failed past case, the reasoner may be warned to avoid taking that exact combination of factors for solving the current problem.
Finally, cases help a reasoner focusing its reasoning in the key parts of the problem by pointing out the critical features. Important information in previous situations will tend to be important in new ones. If a set of features was implicated in the failure of a previous case, the reasoner focuses on those features to avoid repeating this failure in the future. Likewise, if a set of features have resulted in a successful case, the reasoner knows to focus on those features to propose a solution to the upcoming problems.
3.3.7 Pitfalls
Just as it happens with people’s own reasoning, there are a few assumptions about the world under which CBR operates [32]:
• Regularity: the assumption that the same actions under the same conditions will have the same or similar outcomes.
• Typicality: the assumptions that experiences represent typical phenomenon that tends to repeat itself.
24 BACKGROUND • Consistency: the assumption that small changes in the situation result in small
changes in the interpretation and in the solution.
• Adaptability: the assumption that situations can be adapted to each other, and that small differences between the situations can be compensated for.
Having these in mind, there are some drawbacks to this kind of reasoning. A case-based reasoner might tend to use old cases blindly, relying on previous experience without validating it in the new situation [25], and whether the assumption that similar problems have similar solutions really holds may depend on the problem domain [4]. It is also possible that the case-based reasoner allows its case-base to make him/her/it biased in solving new problems. This may happen if the knowledge base does not properly and equally represent the full range of the problem domain. Moreover, the similarity metric depends on the domain and greatly affects CBR systems. Sometimes there may not be a good similarity metric to use at all, resulting in poor comparisons and weak foundations for the system’s solutions. Likewise, adaptation is highly domain dependent and in extreme cases may be equally or more complex than a rule-based system.
As such, when applying CBR in a problem domain it is supposed that it satisfies the assumptions above. In the following chapter, the proposed approach for implementing the case-based reasoning automatic visualization system will be described.
25
Chapter 4
Proposed Approach
In this chapter, details about the proposed approach for implementing a CBR system to decide the best visual representation answer for Ansa’s user queries are presented. It starts with information on the development methodology used throughout this project. Secondly, a use case is specified, which exemplifies a typical usage situation of the system and how it should behave based on user interactions. After that, the project’s functional, technological and performance requirements are specified. The succeeding architecture section briefly explains Ansa’s general architecture, as well as its rule-based system for handling visualizations. Finally, the proposed approach’s architecture is explained, as well as each of its composing modules.
4.1 Development Methodology
The development of this dissertation’s work follows the methodology adopted by the Ansa team: Scrum, which is an iterative and incremental development methodology used in Agile Software Development [33]. Scrum is a management, enhancement and maintenance methodology for an existing system or production prototype, which implements a set of development practices based on the assumption that the systems development process is an unpredictable and complex process that can only be roughly described as an overall progression [34]. It recognizes that it is likely customers will change their minds about what they want or need and that there will be unpredictable challenges along the road, for which a predictive or planned approach is not suited. As such, it adopts an empirical approach, accepting that the problem may not be fully understood or defined from the start, and instead focusing on how to maximize the team’s ability to deliver quickly, to respond to emerging requirements and to adapt to evolving technologies and changes in market conditions.
![Figure 3.9 - Case-based Reasoning Cycle [24]](https://thumb-eu.123doks.com/thumbv2/123dok_br/15484351.1039209/36.892.275.583.565.984/figure-case-based-reasoning-cycle.webp)
![Figure 4.1 – General Scrum Workflow [35]](https://thumb-eu.123doks.com/thumbv2/123dok_br/15484351.1039209/42.892.193.660.112.250/figure-general-scrum-workflow.webp)