ELSEVIER
Journal of Food Engineeting 28 (1996) 153- I78 Copyright 0 1996 Elsevicr Science Limited Printed in Great Britain. All rights resewed 0260-8774/96,1$15.00 0260-8774(95)00034-8
Modelling the Tlkansport of Lactic Acid, Sodium Chloride
and Reducing Sugars in Carrot Slices Submerged in Brines
- Part I. Univariate Approach
Regina M. Nabais,’ Madalena C. Vieira & F. Xavier Malcata”
Escola Superior de Biotecnologia, Universidade Catolica Portuguesa, Rua Dr. Antonio Bernardino de Almeida, 4200 Porto, Portugal
(Received 13 June 1994; accepted 6 May 1995)
ABSTRACT
The transport phenomena pertaining to the independent diffusion of lactic acid and sodium chloride from a brine into carrot slices submerged therein, and of reducing sugars in the opposite direction, were experimentally studied at various temperatures and initial concentrations of salt and acid in the brine. The data sets obtained at each combination of temperature and initial concentration of the brine were independently fit to three analytical models derived from just principles on three alternative mechanisms postulated for the time-variation of the dijjfusivity Incremental sum of squares analyses have shown that the diffusion of acid and salt into the carrots is well described by a constant diffusivity, whereas the diffusion of reducing sugars out of the carrots is well described by a diffusivity undergoing a sigmoidal variation with time. This sigmoidal variation may be explained by the assumption that the bursting of the carrot cells is simultaneously proportional to the fraction of intact cells and the fraction of burst cells of the carrot material. The analysis developed is relevant because it allows an approximate prediction of the rates of acid and salt intake, as well as the release rates of reducing sugars, pertaining to brined carrot slices, the basic processes that occur during manufacture of lactic acid carrot pickles. Copyright 0 1996 Elsevier Science Limited.
NOTATION
AC
Area of each exposed surface of the carrot slice (cm’) C,., Concentration of acid in the carrot material (o/o w/v)‘Current address: Escola Superior Agraria, S. Martinho do Bispo, 3000 Coimbra, Portugal. *Author to whom correspondence should be addressed.
154 R. M. Nabais, M. C. Vieira, l? X. Malcata
20
c’
X.iOi D ap,c,a D ap3.a D ap,c.r D ap,f,r D ap,c,s D ap,f,s K3k
KKS
@ c,r CD c,sVolume-averaged concentrations of acid (% w/v)
Volume-averaged concentration of acid in carrot material in equilibrium with the brine (% w/v)
Constant concentration of reducing sugars in carrot material (% w/v) Concentration of salt in the carrot material (% w/v)
Volume-averaged concentrations of salt (% w/v)
Volume-averaged concentrations of salt in carrot material in equilibrium with the brine (% w/v)
Initial concentration of acid in brine (% w/v)
Constant concentration of acid in carrot material (% w/v) Initial concentration of salt in brine (% w/v)
Constant concentrations of salt in carrot material (% w/v) Concentration of reducing sugars in brine (% w/v)
Concentration of reducing sugars in brine in equilibrium with carrot material (% w/v)
Concentration of intact carrot cells (g/cm”)
Concentration of intact carrot cells at start-up of experiment (g/cm”) Total concentration of carrot cells in carrot material (g/cm’)
Apparent diffusivity of acid in the carrot (m”/s)
Apparent diffusivity of acid in the fluid imbedded within the carrot (m’/s) Apparent diffusivity of reducing sugars in the carrot (m”/s)
Apparent diffusivity of reducing sugars in the fluid imbedded within the carrot (m’/s)
Apparent diffusivity of salt in the carrot (m”/s)
Apparent diffusivity of salt in the fluid embedded within the carrot (m’/s) Partition coefficient of acid between the brine and the carrot material defined as C,,,lCr,,,, (% w/v/% w/v)
Second-order rate constant for bursting of carrot cells (cm3/g/h)
Partition coefficient of reducing sugar between brine and carrot material defined as C,,,ICr,,, (% w/v/% w/v)
Partition coefficient of salt between brine and carrot material defined as C C,S,nSl~l,S,oC (% w/v/% w/v)
Half-thickness of the slice (cm)
Non-negative eigenvalues of tan(q,,,) + uaqaG =0 Non-negative eigenvalues of tan(q,,,) + CI,~,,, =0 Non-negative eigenvalues of tan(q,,) + a+n =0
Time elapsed after submersion of carrot slices in brine (h) Time corrected for initial lag time (h)
Volume occupied by carrot (cm3) Volume of brine (cm3)
Coordinate along the direction of diffusional flow (cm) Auxiliary parameter, defined as V&U,L,K,)
Auxiliary parameter, defined as ~@A,L,K,) Auxiliary parameter, defined as V@&LL,Ks)
Time integral of the apparent diffusivity of acid in the carrot material (m2)
Time integral of the apparent diffusivity of reducing sugars in the carrot material (m”)
Modelling the transport of lactic acid 155 INTRODUCTION
Vegetables can be temporarily preserved by submerging them in aqueous solutions with high concentrations of salt and/or acid (brines), in a process called pickling; the high acid content may in turn be obtained by direct addition or through microbial fermentation, which can be spontaneous or induced (Fleming, 1982; Anderson et al.,
1990). The prevention of undesirable microbial degradation and texture change of the vegetable material through pickling with time can be mainly attributed to the osmotic and antiseptic actions of the brine once inside the tissue (Fleming, 1982). Therefore, the ability to predict the rate of transport of salt or acid solutes from the brine into the vegetable material (or fermentable sugars from the vegetable material to the brine in the case where microbial fermentation plays a role) for various operating temperatures is a particularly important challenge in the design of any pickling process.
The final composition of the brine (i.e. the composition that the final consumer will experience) and the composition of the intercellular juice of the vegetable material is a function of chemical and osmotic equilibria (Bell et al., 1972; Schwartz & Carnoad, 1979); such composition (together with the ability of varying the temperature) can be taken advantage of in the creation of a programmed environment for the preferential growth of beneficial micro-organisms (Fabian & Wadsworth, 1939; Etchels et al., 1950; Fleming et al., 1983; Anderson, 1984; Adams & Hall, 1988; Tuncan & Martin, 1990). The water and solutes transported to and from the vegetable material during immersion in aqueous solutions will also have an effect on the final weight (Selman & Rolfe, 1979; Kincan & Kaymak, 1987; Oliveira, 1988) flavour and texture (Etchels & Moore, 1971; Bell et al., 1972) and nutrient content (Schwartzberg & Chao, 1982; Steinkraus, 1983) and are decisive in controlling enzyme activity within the food material (Schwimmer, 1980).
The mechanisms of transport of solutes from/to vegetables and to/from a brine have been extensively studied for high and moderate temperature conditions (Pflug
et al., 1967; Stahl & Loncin, 1979; Selman & Rolfe, 1979; Selman et al., 1983; Potts
er al., 1986; Kincan & Kaymak, 1987; Oliveira, 1988; Biswall & Maguer, 1989; Beristain et al., 1990; Liu, 1992; Moreira et al., 1992). There is a general consensus that the transport of small solutes between the outer brine and the fluid between the cell membrane and the cell wall, or solutes of any size from the brine to the vegetable material, can be accurately modelled by Fick’s law of diffusion using apparent diffusivities (which are a result of the anisotropic structure of the vegetable material). However, at low temperatures (say, below 50°C) the observed rate of transport of large solutes (e.g. reducing sugars) from the vegetable material to the brine does not follow Fick’s law because the cell membrane needs to burst before the solute becomes available for molecular transport. Various models have been proposed for this latter situation which take into account the process direction (leaching or infusion), the electrostatic behavior of the solute, the inorganic or organic nature of the solute, the concentration and distribution of the solute between the two phases, the molecular size of the solute, the integrity and structural arrangement of the solid matrix, and the histological state of the system (Soddu & Gioia, 1979; Schwartzberg & Chao, 1982; Toupin et al., 1989; Oliveira & Silva, 1992; Moreira et al., 1992). In studying the behaviour at low temperatures, Pflug et ccl. (1967) have proposed a graphical method for the fitting of their experimental data, whereas Potts et al. (1986) used an empirical equilibration-prediction approach; in
156 R. A4. Nabais, M. C. Vieira, l? X. Malcata
the case of Soddu & Gioia (1979) such an empirical approach took the form of a Langmuir isotherm. In this communication another approach is proposed, which is based on a combination of a process of molecular transport with a process of release following bursting of the carrot cells according to first-order processes.
Since carrots are one of the most common vegetables which have been traditionally used in pickling processes in southern Europe and northern Africa, an impetus exists for detailed studies on the quantitative evaluation of the combined effects of temperature and salt concentration of the brine on the rates of transport of native sugars from, and added acid to, the carrot material. Carrots possess a strong flavour, and their major components are gluten, starch, sugars, malic and pectic acids, fluor, mannitol and resin (Alabran & Mabrouk, 1973; Phan & Hsu, 1973; Andersson et al., 1990). As with other plants, two main tissues can be considered: (i) the parenchima (or cortex), which is a storage tissue rich in starch and sucrose; and (ii) the vascular system, which encompasses the xylem (upward direction, inner portion of the core), which is rich in salts, and the phloem (downward direction, outer portion of the core), which is rich in glucose and fructose. The parenchima cells are regularly shaped, and have thin walls and vacuoles; the vascular system cells, on the other hand, have walls richer in lignin and their vacuoles increase in size giving place to tubular-shaped cells, which can remain alive and keep their tops (phloem) or die and hence lose their ends (xylem) (Meyer et al., 1965; Goris, 1969; Phan & Hsu, 1973; Richardson, 1975; Salisbury & Ross,
1978; Soddu & Gioia, 1979; Oliveira, 1988). In order to parallel the conditions more likely to be of interest at the industrial processing level, the following ranges for the operating parameters were selected in our studies: salt concentration from 5 to 20% (w/v) and lactic acid concentrations from 05 to 2% (w/v). Since the initial content of reducing sugars of the carrots cannot be artificially manipulated, it was decided to study the rates of diffusion of such sugars under various concentrations of salt in the brine ranging from 0 to 20% (w/v).
EXPERIMENTAL WORK
Materials
Fresh carrots were bought at random at local markets (main cultivar: Nantes). Sodium chloride, sodium hydroxide, potassium dichromate, copper sulphate, potassium permanganate, silver nitrate and lactic acid were purchased from Merck (Germany). Dinitrosalicilic acid was obtained from BDH (UK).
Equipment
Centrifugations were performed with a Universal centrifuge from Hettich (Germany). Measurements of pH were made with a pH-meter from Crisson, model 2002 (Spain) coupled with a standard Ingold combined pH electrode (Switzerland). Isothermal conditions and stirring were achieved using a thermostatted shaker water bath Kotterman 3047 from Labortechnik (Germany). Spectrophotometric measurements were performed with a visible spectrophotometer model 350 from Pye Unicam (UK). Sterilization was accomplished using a laboratory retort Austester 4376 from Selecta (Spain).
Modelling the transport
of
lactic acid IS7Methods
Preparation of brines
Brines were prepared at 25°C using a thermostatted bath with the required amounts of sodium chloride (previously dried overnight at 60°C) or of lactic solution (90% pure), as appropriate, and diluting them to the desired volume with deionized water. The solutions thus prepared were distributed into flasks and sterilized for 15 min in a laboratory retort.
Diffusion experiments
Before the experiments, the carrots had both tops cut off, were thoroughly washed with tap water, submerged for 15 min in a 0.2% (w/v) solution of copper sulphate, and were finally submerged for 15 min in a 0.2% (w/v) solution of potassium permanganate. The carrots were then sliced in pieces 1 cm-high and the diameters were measured using a micrometer. Each slice was, at this time, stuck on a sterilized stainless steel pin, submerged in a beaker containing 50 ml of an aqueous brine with the desired salt concentration and gently stirred in an uniform fashion using the orbital shaker (orbital velocity setting: 5) set at the temperature required.
Analysis of sodium chloride
After removal from the brine, the carrot slices were quickly rinsed with deionized water, slightly dried with tissue paper, cut into very small pieces, submerged in 50 ml of deionized water in a stoppered flask and heated for 30 min in a laboratory retort (McKnee, 1985). After cooking the carrots pieces, together with the aqueous extract, were homogenized in a mixer and centrifuged for 10 min at 5000 rpm. Finally, 2 ml of the clarified supernatant were titrated with 0.05 N solution of silver nitrate using potassium dichromate as indicator.
Analysis of reducing sugars
Aliquots of the brines were periodically taken, diluted with deionized water and analysed using the dinitrosalicilic acid method (Miller, 1959). The results were expressed as glucose equivalent. Residual reducing sugars in the carrot slices were obtained by analysing, using the same method, the clarified extract obtained as described in the section ‘Analysis of sodium chloride’.
Analysis of lactic acid
The total acidity of the solutions was measured and expressed as lactic acid equivalent. For this purpose, an aliquot of 2 ml of the clarified extract was titrated with a 0.01 N solution of sodium hydroxide until pH 8.2 was reached and remained for at least 1 min; the titre of the blank (which consisted of the solution obtained when a second carrot slice was submerged in deionized water) was deducted in an
appropriate fashion.
Measurement of partition coefficients
The partition coefficients for salt, acid and reducing sugars was obtained as the ratio of the per cent concentration (w/v) in the crushed carrot material to the brine counterpart after equilibrium conditions were reached.
158 R. M. Nabais, M. C. Vieira, E X. Malcata
TABLE 1
Geometrical and physical characteristics (and associated standard deviations) of the carrot slices utilized in the experiments (approximate diameter, 3 cm; approximate height,
1 cm) Location Volume (106 m3) Mass (kg) Densi 7 (Wm ) Total reducing f% Ww)) Core O-670 k 0.043 0.00073 f 0~00040 1048f277 1.32 k 0.65 Cortex 5.9 f 3.4 0.0067 f 0.0036 1128+378 0.73 f 0.29
Total 6.7f3.8 0.0079 & 0.0039 1112+349 1.28 _t O-53
EXPERIMENTAL RESULTS
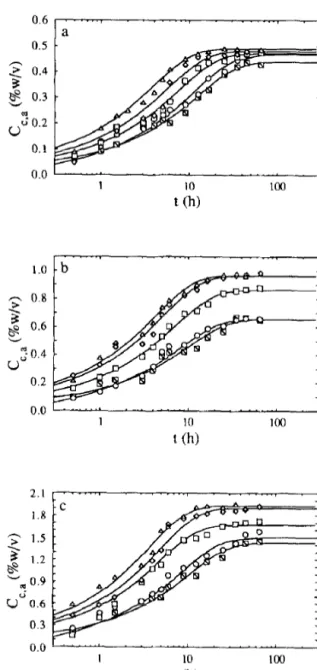
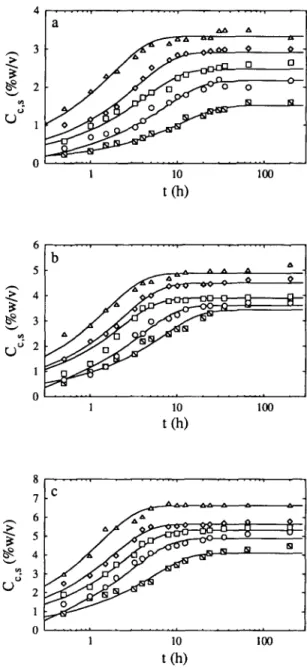
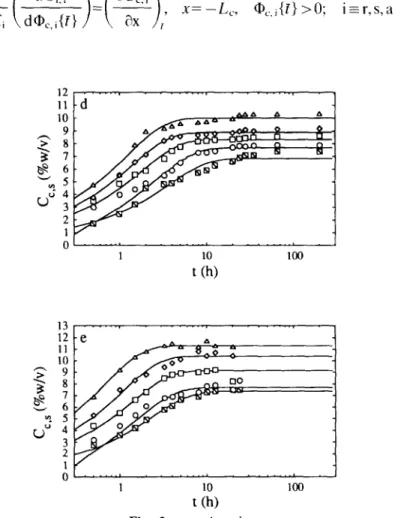
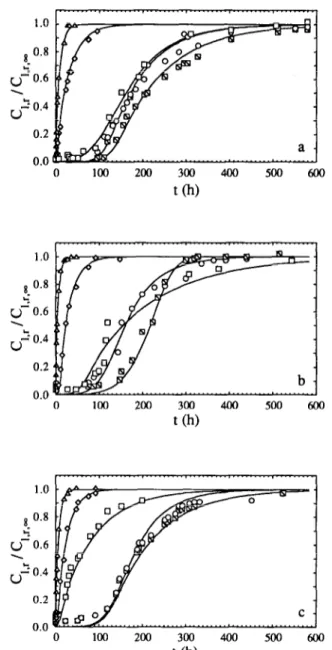
Geometrical characteristics and physico-chemical properties of the carrot slices are listed in Table 1. The effect of the lactic acid concentration in the brine and the temperature on the observed rates of transport of acid from the brines to the carrot slices was studied for acid levels of 05, 1 and 2% (w/v) and temperatures of 15, 20, 30, 40 and 50°C and the experimental results thus obtained are depicted in Fig. 1. The effect of the salt concentration in the brine and the temperature on the observed rates of transport of salt from the brines to the carrot slice was studied for salt levels of 5, 7.5, 10, 15 and 20% (w/v) and temperatures of 15, 20, 30, 40 and 50°C and the experimental results thus obtained are depicted in Fig. 2. The effect of the salt concentration in the brine and the temperature on the observed rates of transport of reducing sugars from the carrot slices to the brine was studied for salt levels of 0, 5, 7.5, 10, 15 and 20% (w/v) and temperatures of 15, 20, 30, 40 and 50°C and the experimental results thus obtained are depicted in Fig. 3.
MATHEMATICAL ANALYSIS
Assume that the carrot slice behaves as an infinite slab of uniform carrot material of thickness 2L, submerged in a well-stirred solution. The mass balances to solute within the carrot material can be written as:
where C,,i is the concentration of solute i in the carrot material, i.e. reducing sugars
(i=r), salt (i=s) or lactic acid (i=a), Dap,c,i {f} is the apparent diffusivity of solute i
in the carrot material (assumed to be, in general, a function of time) and x is the coordinate along the direction of diffusional flow (x=0 at the centre of the carrot slice). In eqn (l), f is the time elapsed according to a predefined scale (i.e. f=t--to) where the lag time, to, is the time at which the transport of the species under consideration is assumed to essentially start; the value of to may tentatively be set equal to 0 (i.e. the time at which the carrot slice is submerged in the brine) or be left as an adjustable parameter. Equation (1) can be rearranged to read (Crank, 1975):
Modelling the transport of lactic acid 159 1.0 - 0.8
a
$ 0.6 V v 50.4 0.2 0.0 2.1 I.8 1.5 1.2 0.9 0.6 0.3 0.0 1 10 t (h)Fig. 1. Plot of the concentration of lactic acid in the carrot material, C,,;,, vs the time
elapsed after submersion, t: experimental values (m, 15°C; o, 20°C; q , 30°C; o, 40°C; and n -50°C) and fit of model A (_) for (a) 0.5%, (b) 1% and (c) 2% (w/v) total acid in t<
160 R. M. Nabais, M. C. Vieira, l? X. Malcata
0’ I
1 10 loo
t 04
Fig. 2. Plot of the concentration of sodium chloride in the carrot material, C,,,, vs the time
elapsed after submersion, t: experimental values (N, 15°C; o, 20°C; o, 30°C; o, 40°C; and A,
-50°C) and fit of model A (_) for (a) 5.0%, (b) 75%, (c) lO.O%, (d) 15.0% and (e) 20% (w/v) total salt in the brine.
Modelling the transport of lactic acid 161 (2) where ’ ~,,i{r} = 1 D,p,,,i{<} d<; i=r,s,a (3) fll
Equation (2) which is a form of Fick’s second law, is subject to one of the following initial conditions:
Cc.i=Cc.i.O7 -L,lXIL,, @~,i{r}=O; i=r
Cc,i=O, -L,lXlL,, ~‘c,i{f}=O; i=s,a !4)
where C&, is the initial concentration of solute i in the carrot material and L, is the half-thickness of the carrot slab. Equation (1) is also subject to the following two boundary conditions:
12, . . . . . . . . . . ..I .... .I .
162 R. M. Nabais, M. C. Vieira, I;: X. Malcata 8 0.8 "'0.6 . "20.4 8 0.8 "'0.6 . 8 0.8 "'0.6 . t 04 0.2 0.0 0 loo 200 300 400 500 600 t(h)
Fig. 3. Plot of the concentration of reducing sugars in the brine, Cl,r, normalized by the
equilibrium estimated concentration, C,,,,, vs the time elapsed after submersion, t: experimental values (m, 15°C; o, 20°C; q , 30°C; c, 40°C; and A, 50°C) and fit of model C(_)
for (a) O.O%, (b) 5.0%, (c) 7.5%, (d) 10-O%, (e) 150% and (f) 20% (w/v) total salt in the brine.
Modelling the transport of lactic acid 163
where V, is the volume of brine, Cli is the concentration of solute i in the brine, K, is the partition coefficient of solute’i between the brine and the carrot material, i.e. C,., , ICI,,. I (where G, x is the concentration of solute i in the brine in equilibrium
8 0.8 uZ0.6 . $0.4 0.2 t (W 8. “2 0.8 t (h) 1.0 8 0.8 ">0.6 . "20.4 0.2 t (h) Fig. 3. continued.
164 R. M. Nabais, M. C. Vieira, F X. Malcata
with the carrot material and C’c,i,m is the concentration of solute i in the carrot material in equilibrium with the brine) and A, is the area of each exposed surface of the carrot slice (assuming a semi-infinite geometry).
Combining eqn (2)-eqn (5) the concentration of species i within the carrot slice is given by (Crank, 1975): cc,i{x> t}=Cc,i,O-(Cc,i,O-Cc,i,s?)
(
CC 2( 1 + ~i)COs{qi,X/Lc)‘+,,CI
(l+~i+cc~q:,)COS{qi,,}
expi_q~n~~~)j); i-r(
z
Cc,i{%tl=Cc,i,oc 1+ C 2( 1+ Q)COS {qi, nxlLc II = I (I+ Mi + ~fqf”)COS {qi,n).nxp{-q’n~~f’]); i-s+
(6)
where Cc,i,o is the initial concentration of solute i in the carrot material, and where ai is a dimensionless parameter defined as:V*
c(i G
2A,L,Ki
and qn (n = 1,2,...) denotes every non-negative eigenvalue of
tan {qi,nl = - %qi,n (8)
Integration of eqn (6) in the space variable and subsequent combination with eqn (8) yields: s L C,i{x,f) dx ec,i{f)= ” s L. ‘dx zcc, i, 0 - (Cc, i, 0 - cc, i, u;) 0
(
1-f 2Cii( 1 + ai) n=l l+Mi+Nfqtn exp{_q’n:ii”)j); i-rs
L Cc,i{X,fl dx Cqi{flc ” s L. Ldx =Cc,i,oc, 0(
1-f 2ai( 1+ Xi) n=l l+Ui+N2q:”Model&g the transport
qf
lactic acid I tf?for the carrot material, where C, i is the volume-averaged concentration of solute i in the carrot material, and Cj,, is the volume-averaged concentration of solute i in the carrot material in equilibrium with the brine.
The constancy of the total amount of solute in the brine and carrot slice com- bined allows one to write:
aiCr,i{r} +Cc,,{f}=C,,i,,j; i-r
as well as
!XiCr,i{f} +C,i{f}=%iCr,i,~,; i=s,a (10)
xiCl.i, * if) + Cc,i, 5 If) =Cc,i.(l; i = r
aiCr,i., {f} + Cc,i.-, {f}=C&r,j,& i = s, a (11) Combination of eqn (9)-eqn (11) yields
(12)
The decision whether to use eqn (9) or eqn (12) to fit the experimental data depends on the type of experimental measurements possible. The measurement of the amount of reducing sugars leached from the carrot slice is more accurately achieved via measurement of the variation in the concentration of these species in the brine (because the initial concentration here is negligible), and hence eqn (12) should be employed (in this case, C I,r.r plays the role of an adjustable parameter); by the same token, the measurement of the amount of salt and lactic acid absorbed by the carrot slice is more accurately achieved via measurement of the variation in the concentration of these species in the carrot material (because the initial concen- tration here is negligible), and hence eqn (9) should be employed (in this case, CV,;, , plays the role of an adjustable parameter).Concerning the functional form of Q,(f), three situations will be considered, giving rise to as many different models (see below). All such models assume that, before submersion of the carrots in the brine, a fraction of the plant cells have died and hence their cytoplasm membranes have burst; for such cells (in a concentration denoted by Cx.tot - CX,~, where CX,~~,~ is the total amount of plant cells and C,.o is the concentration of cells that were initially intact), the intracellular fluid is not essentially different from the intercellular fluid for transport of the solutes. The cells that were initially intact will burst owing to the osmotic pressure of the solutes in the brine at rates that show different time dependencies depending on the model considered. The diffusivity should then, in its simplest form, be given by:
Dap,c,i @I Cx,,., - Cx {fI
Dap,f,i = CX,.,,-CX,, ( 13)
166 R. M. Nabais, M. C. Vieira, E X. Malcata
for molecular transport and where C,(t) is the concentration of cells still left intact at time f.
Model A
At the moment of submersion (or a short time thereafter) virtually all plant cells have already burst (i.e O<CX{t} IC~,~= 0); hence, the diffusivity of solutes within the carrot material is essentially a constant, and eqn (13) becomes:
D ap,c,i{f)=Dap,f,i (14)
where Dap,f,i is an adjustable parameter. Recalling eqn (3) one finally obtains:
@c,i{t} -D,p,c,i(t-tto); i=r,s,a (15)
where Dap,c,i and to are the adjustable parameters.
Model B
At the time of submersion of the carrots in the brine, some of the cells have already burst (i.e. CX,tot >C,,>O), and the remaining intact cells will burst at a rate that is proportional to the number of cells still left intact. Mathematically, this corresponds to a first-order process, viz.:
dcx
--=kiCx;dt @t=O,
cx=cx,,
(16)
where ki is a constant. Upon integration, eqn (16) yields:
Cx=Cx,o exp{ -kif} (17)
Combination of eqn (13) and eqn (17) gives, following some algebraic rearrangement, 1 D ap,c,i{fl=Dap,f,i ( CdC&
1 -
Cx,JCxm - 1 - Cx,JCx,<,,
exp{ -ki(t-to)) > (18)where Dap,f,i, to, (CXOK x,,,t) and ki are the three statistically independent adjustable
parameters. Recalling eqn (3), one finally obtains:
D @c,i(f)= a~, f, i
1 - Cx,JCx,<,,
t-to-
Cx$x,,,,(l -exp{ -ki(t-to)))ki
>
( 19)
Model CAt the time of submersion of the carrots in the brine, some of the cells have already burst (i.e. CX,tot > C x,o LO), and the remaining intact cells will burst at a rate that is proportional to the number of cells still left intact, on one hand, and that is proportional to the number of cells that have already burst, on the other (this latter behaviour may be explained by the fact that a cell will more easily burst if it is surrounded by plain intercellular fluid rather than by cells with intact membranes). Mathematically, this corresponds to the combination of a first-order process with first-order inhibition, viz.
Mode&g the transport of lactic acid 167
dCx
--=kiCX(CX.totdt -Cx); et=o,
cx=cx,,
where ki is a constant. Equation (20) is a Riccati equation which, upon integration, yields the logistic curve (Bailey & Ollis, 1986) viz.
cx=
Cx. OCx.
totexp{
-
Wx, d)
C X, tot - CX,O(~ -
exp{
-
Wx.
d1)
Combination of eqn (13) and eqn (21) gives, following some algebraic rearrangement:
Dap,c,i{f) = Dap,f,i
1 -Cx,oICx,t~~t(~ -exp{ -kiCx,tott>)
(W
where Dap,f,i, (C~.dCx,~,,t) and ki.Cx.tot are the three statistically independent
adjustable parameters. Recalling eqn (3) one finally obtains:
@c,itr> =
Dap.f,i
ki
Cx,tot(l
-C~lC~,tot> ln {%+(1-e) expikC,,,..,t))(23) From inspection of the aforementioned models, it is apparent that Model A is nested in either Model B or C since eqn (18) and eqn (22) respectively, reduce, in both cases, to an analogue of eqn (14) when the two parameters ki and to tend to zero.
STATISTICAL ANALYSIS
The non-linear regression of the experimental data on the transport of lactic acid and sodium chloride to the carrots, and transport of reducing sugars to the brine were made by unweighted least squares using a software package, GREG (Caracotsios et al., 1985). Initial guesses of the relevant parameters, viz. the diffusivities and the equilibrium concentrations, were obtained from the order of magnitude of similar diffusivities in liquid phases (say, lo-‘” m2/s) and observation of the asymptotic values of concentrations in the brine or in the carrot obtained after long-term (constrained by the perishable nature of the carrot material) experiments, respectively. The lag times were estimated by extrapolation of the linear increasing portion of the concentration curves at (relatively) short times to zero concentration. Trial and error guesses had to be made for the remaining parameters.
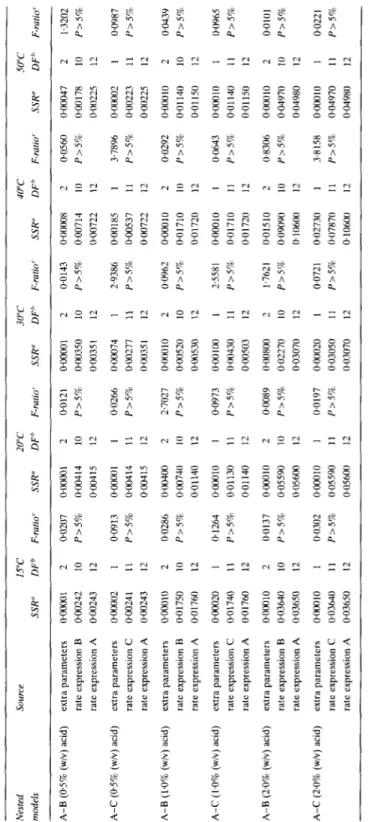
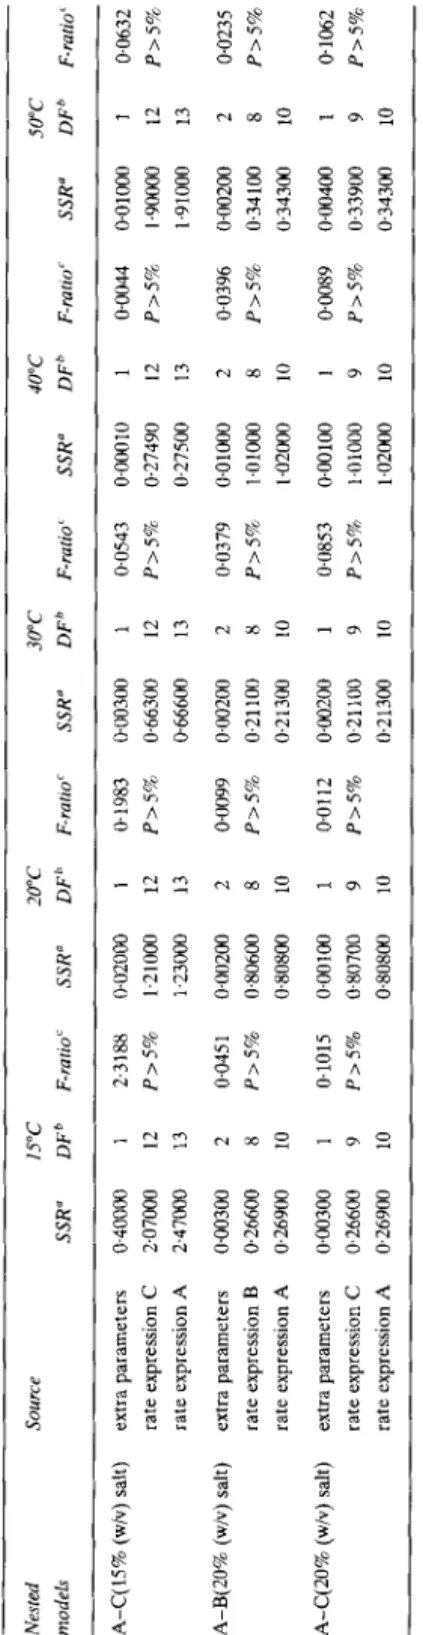
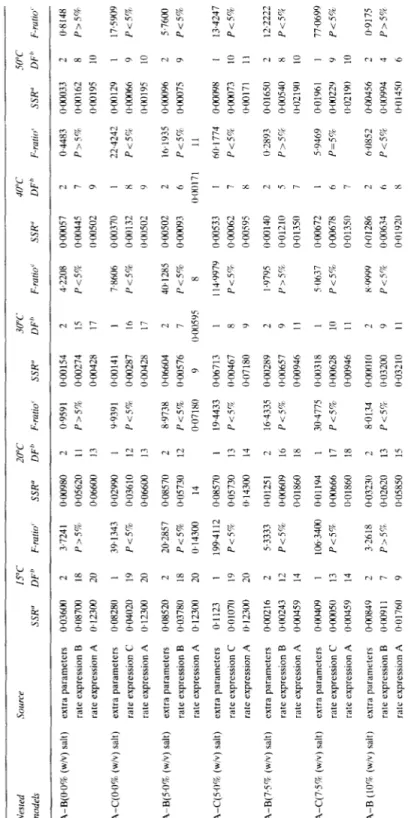
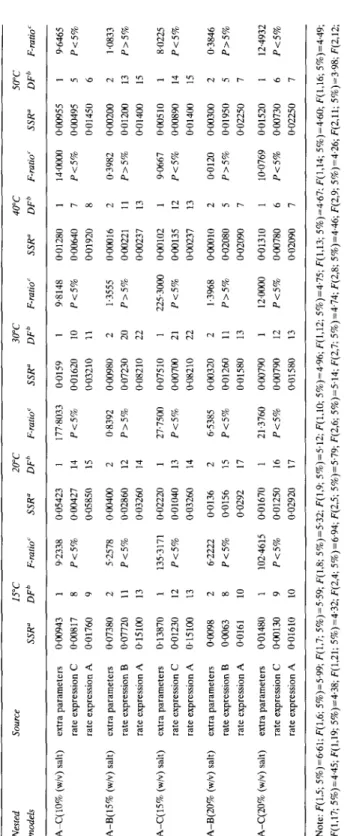
The statistical adequacies of the base (partial) models with respect to the two alternative (full) models were tested via extra sum of squares analyses. These analy- ses are depicted in Tables 2-4, and are based on a rationale available elsewhere (Bates & Watts, 1980). The parameter estimates obtained from the non-linear regression fits using the statistically best models for the transport of acid, salt and reducing sugars are listed in Tables 5-7, and the corresponding theoretical curves are plotted in Figs 1-3, respectively.
TABLE 2 Extra Residual Sum of Squares Analyses Involving Models A and B, or Models A and C, for the Transport of Acid from the Brine into the Carrots Source WC 20°C 3OT 40°C 50°C SSR” DFb F-rarro’ SSR” DFh F-rUtiO’ SSR” DF” F-ratio’ SSR” DFh F-rllt10’ SSR” DF” F-i-&f A-B (05% (w/v) acid) extra parameters rate expression B rate expression A @00242 0.00243 A-C (05% (w/v) acid) extra parameters rate expression C rate expression A OGO241 000243 A-B (1.0% (w/v) acid) extra parameters oooo1O rate expression B PO1750 rate expression A 0.01760 A-C (1.0% (w/v) acld) extra parameters OaOO2o rate expression C 0.01740 rate expression A 0.01760 A-B (2-O% (w/v) acid) extra parameters ~00010 rate expression B 0.03640 rate expression A 003650 A-C (2.0% (w/v) acid) extra parameters rate expression C rate expression A O~(MNlO WO3640 @03650 2 10 12 1 11 12 2 10 12 1 11 12 2 10 12 1 11 12 - 0.0207 OaOcQl P>S% oGQ4 I 4 0.004 15 0.0913 0~00001 P>S% 0+0414 0~00415 0.0286 O~Oa400 P>5% 0~00740 0.01140 0.1264 0~00010 P>5% 0~01130 0.01140 0.0137 0~00010 P>5% 0.05590 0.05600 0.0302 ~00010 P>5% 0.05590 0.05600 2 10 12 I I1 12 2 10 12 1 11 12 2 10 12 1 11 12 0.0121 @OooOl P>5% 0~00350 ow35 I 0.0266 0.00074 P>S% 0.00277 0.0035 I 2.7027 0~00010 P>S% 0~00520 0~00530 0.0973 0.00 IO0 P>5% oGO430 0.00503 0.0089 0+0800 P>S% 0.02270 0.03070 0.0197 0~00020 P>5% 0~03050 0~03070 2 10 12 1 11 12 2 10 12 1 11 I2 2 IO 12 1 11 12 PO143 owOO8 P2570 0.00714 OX10722 2.9386 0~00185 P>S% oao537 0.00722 WO962 0~00010 P>5% 0.01710 0.01720 2.5581 oaOo1o P>S% 0~01710 0.01720 1.7621 0~01510 P>5% 0~09OYO 0~10600 0.0721 0.02730 P>5% 0.07870 0.10600 2 IO 12 I 11 12 2 10 12 I 11 12 2 10 12 1 11 12 0.0560 0~00047 P>S% 0~00178 O~Ol~22S 3.7896 oomlo2 P>5% O+lO223 0.00225 0.0292 oaO1o P>S% 0~01140 0.01 I50 0.0643 owO1o P>5% 0.01140 0.01150 0.8306 OaJOlO P>S% 0.04970 0.04980 3.8158 003010 P>5% 0.04970 0.04980 2 10 12 1 11 12 2 10 12 1 11 I2 2 10 12 1 11 12 1.3202 P>5% 0.0987 P>5% 0.0439 P>5% PO965 P>S% 0~0101 P>5% 0.0221 P>5% Note: F(l,ll; 5%)=4.84; F(2,lO; 5%)=4.10.“SSR= sum of squares of residuals; “DF=number of degrees of freedom; MSS=SSR/DF: ‘F ratio=(MSS associated with the extra parameters)/ (MSS associated with the ftdl model); P=probability that the given value of the F ratio happens by pure chance.
TABLE 3 - conrd. Nested SOlUCe 15°C 20°C 30°C 40°C 50°C models SSR” DFb F-mid SSR” DF” F-ratlO’ SSR” DFh F-raiio’ SSR” DF’ F-rl7110’ SSR” DF’ F-ratio’ A-C(lS% (w/v) salt) extra parameters 0~40000 1 2.3188 0~02000 1 0.1983 0~00300 1 0.0543 0~00010 1 0.0044 0~01000 1 0.0632 rate expression C 207000 12 P>S% 1~21000 12 P>S% 0.66300 12 P>5% 0.27490 12 P>5% 1~9oco0 12 P>S% rate expression A 2,470CO 13 1.23ocKl 13 066600 13 0.27500 13 1~91000 13 A-B(20% (w/v) salt) extra parameters 0~00300 2 0.045 1 0~002oa 2 0.0099 0~00200 2 0.0379 0~01000 2 0.0396 0~00200 2 0.0235 rate expression B 0.26600 8 P>S% 0.80600 8 P>5% 0~21100 8 P>5% 1.01000 8 P>5% 0.34100 8 P>S% rate expression A 0.26900 10 0~80800 10 0.21300 10 1~02000 10 0343nll 10 A-C(20% (w/v) salt) extra parameters 0~00300 1 0.1015 0~00100 1 @0112 o+lo2oo 1 0.0853 0~00100 1 0.0089 oal4oo 1 @lo62 rate expression C 0,266Oo 9 P>5% 0.80700 9 P>5% 0~21100 9 P>5% 101000 9 P>S% 0.33900 9 P>5% rate expression A 0.26900 10 0~80800 10 0.21300 10 1~02000 10 0.34300 10 Note: F(1,ll; 5%)=4.84; F(1,12; 5%)=4.75; F(2,lO; 5%)=4.10; F(2,ll; 5%)=3.98.‘SSR=sum of squares of residuals; “DF=number of degrees of freedom; MSS=SSRDF, % ratio=(MSS associated with the extra parameters)/(MSS associated with the full model); P=prohability that the given value of the F ratio happens by pure chance.
TABLE 4 Extra Residual Sum of Squares Analyses Involving Models A and B, or Models A and C. for the Trarnporr ot Reducing Sugars tram the Carrots into the Brmr Nested source 15°C 20°C 30°C 40°C 50°C mod& SSR” DFb F-ratio’ SSR” DF* F-r&f SSR” DF” F-IlltLO’ SSR” DF’ F-ratio’ SSR” DF” F-rurro’ 0.00033 2 0.8148 OGO162 8 P>S% 0.00195 10 0.00 129
(I.00066 O~(X)I9S ODJO96 oaO7s
1 175909 Y P<S% 10 2 57600 9 Pi.592 O~wnYX I 134247 OGH~73 IO P<S% 0~00171 11 0.01650 2 12.2222 oaO54o 8 P<S% 0~0219(1 IO 0.0196 I I 77.0699 OGu22Y Y P<5% ~1~02190 10 0.00456 2 0.917s ow994 4 P>5% l~Ol45~1 6 A-B(O.O% (w/v) salt) extra parameters 0.03600 rate expressmn B 0~08700 rate expression A 0~12300 2 18 20 A-C(O.O% (w/v) salt) extra parameters lI~O828U rare expression C 0.04020 rate expression A 0~12300 19 20 A-B(5.0%! (w/v) salt) extra parameters 0.08520 2 rate expression B 0.03780 18 rate expressmn A 0~12300 20 A-C(U)% (w/v) salt) ext*a parameters 0.1123 rate expression C 0~010711 rate exprewon A 0. I 2300 A-B(7FF (w/v) salt) extra parameters 0.00216 rate expression B 0.00243 rate expression A 0.00459 I9 20 2 12 14 A-C(7,SV (w/v) salt) extra parameters rate expression C rate expression A
OW409 0axl50 ou1459 I3 14 A-B [lOcr, (w/v) salt) extra paramrters 0.00849 rate expression B (IGO I raft expresuon A 0.01760 9 3.7241 O~W980 2 0.9591 0.00154 P>S% 0.05620 II P>5% 0.00274 0~06600 I3 0.00428 39.1343 0.02990 Pc57c 0.03610 0.06600 Y.9391 0.00141 P<s% 0.00287 0.00428 2@2857 0.08570 P-C59 lb05730 0.14300 I4 1994112 0.08570 P<S% 0.05730 (I.14300 I 13 14 8.9738 O.06604 P<5% 0.00576 0~07180 9 19.4433 0.06713 P<5V (I.00467 0.07180 53333 lb01251 2 16.4335 0.00289 P<5% 0+K~609 16 P<i% 0.00657 0.01860 18 0.00946 106.3400 0.01194 P<S% 1bW666 Il.01860 30.4775 0.00318 Pc5% lb00628 0.00946 3-2618 0.03230 P>SQ 0.02620 0~05850 1 17 18 2 13 15 8.0134 OaloI~J P<5’i; 0~03200 0.03210 4.2208 P<5% O~OWS7 0.00445 O~WSO2 DW370 0.00132 0W502 0.00502 0.00093 1 0.4483 P>W i 7 9 7,X606 Pi5% 22.4242 P<5% x 9 2 6 0~00171 I6 17 2 40.1285 P<5% 8 I 14.9979 P<5m, 16.193.5 P<SQ II h@ I 774 Pi%
0.00533 o-00062 O~WSOS 0.00672 O-W678 0~013.50 0.01286 0.00634 O~rllY20 7 K I.9795 P>S% 0.2893 P 15 c; 5 0637 P<S% 5.9469 P=5R 10 II 6 x+999 PC% hm.52 P<S% 1 Y II
TABLE 4 - conrd. Nested Source 15°C 20°C 30°C 40°C 50°C models SSR” DFb F-ratio’ SSR” DFh F-ratio‘ SSR” DFb F-ratio’ SSR” DFb F-ratio r SSR” DF’ F-ratio’ AmC(lO% (w/v) salt) extra parameters oao943 rate expression C 0.00817 rate expression A 0.01760 A-8(15% (w/v) salt) extra parameters 0.07380 rate expression B 0.07720 rate expression A 015100 A-C(15% (w/v) salt) extra parameters @13870 rate expression C 0.01230 rate expression A 0~15100 A-B(20% (w/v) salt) extra parameters rate expression B rate expression A O+lO98 OGil63 0.0161 A-C(ZO% (w/v) salt) extra parameters 0~01480 rate expression C oao13o rate expression A 0.01610 1 8 9 2 11 13 1 12 13 2 8 10 1 9 10 9.2338 0.05423 P<5% OJlO427 0.05850 5.2578 oao4oo P<5% 0.02860 0.03260 135.3171 0.02220 P<5% 0~01040 0.03260 6.2222 0.0136 P<5% PO156 0.0292 102.4615 PO1670 P<5% 0.01250 0.02920 14 15 2 12 14 1 13 14 2 15 17 16 17 177.8033 0.0159 1 P<5% 0.01620 10 0.03210 11 0.8392 0.00980 2 P25% 0.07230 20 0.08210 22 27.7500 0.07510 1 P<5% oao7oa 21 0~08210 22 6.5385 OO!I320 2 P<5% 0.01260 11 0.01580 13 21.3760 000790 1 P<5% oQo79o 12 0.01580 13 9.8148 0.01280 1 14aIoo oQo955 1 P<5% 0.00640 7 P<5% 0~00495 5 0.01920 8 0.01450 6 1.3555 0.00016 P>5% oaO221 OT!iI237 2 11 13 0.3982 oao2oo P>5% 0~01200 0~01400 2 13 15 225.3000 OGO102 1 9.0667 0~00510 1 P<5% @00135 12 P<5% 0.00890 14 0.00237 13 0~01400 15 1.3968 0~00010 P>5% 0~02080 0.02090 PO120 oGQ300 P>5% 0.01950 0.02250 12aooo wo1310 1 10.0769 0.01520 1 P<5% 0.00780 6 P<5% oao73o 6 0.02090 7 0.02250 7 9.6465 P<5% 1.0833 P25% 8.0225 P<5% 0.3846 P>5% 12.4932 P<5% Note: P(1.5; 5%)=6.61; F(1,6; 5%)=5.99; F(1,7; 5%)=5.59; F(l,S; 5%)=5.32; F(1,9; 5%)=5.12; F(1.10; 5%)=496; F(1,12; 5%)=4.75; F(lJ3; 5%)=4.67; F(1,14; 5%)=4.60; F(1.16; 5%)=4.49; F&17; 5%)=4.45; F&19; 5%)=4.38; F(1,21; 5%)=432; F(2,4; 5%)=6.94; F(2,5; 5%)=5,79; F(2,6; 5%)=5.14; F(2,7; 5%)=4.74: F(2,8; 5%)=4.46; F(2,9; 5%)=4.26; F(2,ll; 5%)=3.98; F(2,12; 5%)=3,89; F(2,13; 5%)=3.81; F(2,15: 5%)=3,68; F(2,16; 5%)=3.63; F(2,18; 5%)=3.55; F(2,20; 5%)=3.49.“SSR=sum of squares of residuals; bDF=number of degrees of freedom; MSS=SSR/ DF; ‘F ratio=(MSS associated with the extra parameters)/(MSS associated wth the full model); P=probability that the given value of the F ratio happens by pure chance.
Mode&g the transport of lactic acid 173
TABLE 5
Results of the Regression Analysis of the Fit of the Data on Transport of Lactic Acid to the Model using Rate Expression A for Various Temperatures and Initial Concentrations of
Lactic Acid
Temperature ID
(“C,
Units 0.5% (w/v) 1.0% (w/v) 2.070 (wlv,
acid acid acid
Value MIIh Value MIIh Value MII”
15 20 30 40 50 m2/s z (w/v) m2/s kk (w/v) m2/s h % (w/v) m2/s h % (w/v) m2/s h % (w/v) 9.720 0.000 0.439 9.670 0.000 0.470 9.490 0.07 0.472 9.370 0.41 0.481 9.200 0.18 0.490 0.066 0.0” 1 0.077 oG4 0.077 0.31 0.019 0.095 0.18 0.024 0.052 0.15 0.011 9.61 0.000 0.655 9.510 0.000 0.657 9.450 0.000 0.861 9.320 0.000 0.962 9.240 0.000 0.965 0.11 9.620 OG5 0.000 1.430 0.082 9.530 oG3 0.000 1.500 0.041 9.270 ok 0.426 1.671 0.064 9.290 o&4 0.000 1.900 0.052 9.170 (J 0.000 0.026 1.930 0.048 O&l 0.080 % 0.074 0.048 0.079 0.040 0.08 1 :c 0.084 0.055 OG3 “ID=identification; bMII=95% marginal inference interval.
TABLE 6
Results of the Regression Analysis of the Fit of the Data on Transport of Sodium Chloride to the Model using Kate Expression A for Various Temperatures and Initial Concentrations of Sodium Chloride
ETrpwure ID Units s@% (w/v) 75% (W/I’) lU% (w/L’) 15% (w/w) L’U% (!+!WJ
I”(‘) salt .salt salt .salt *w/t
-__
I/ah MIP Value MIP VUllM MII" V&e MU" VUlUC MI/”
m’ls 9,640 0.073 9.420 0489 Y.300 0.085 9.160 0.09 I x.950 043Y h 0.000 r 0.000 -L 0~000 0,022 0~000 ‘X 0~000 I o/c (w/v) 1,520 0.075 3.43 0.19 4.12 0.21 6.85 0.32 7-37 lb15 m’ls 9.440 0.062 9.170 0.085 9.080 0.064 9.020 0.063 X.790 OM5 h 0.000 JL 0.35 0.17 0.06 0.19 0.000 -,_ 0~000 ‘I %* (w/v) 2.180 0.082 3.6 1.4 4.X8 0.1 I 7.69 0.22 7.70 II.23 m’/s 0.210 0.059 8,940 0,068 X.980 0.033 8.840 WO42 8.720 1 Hl?X h 0~000 x 0.35 0.11 0.000 ;c 0~000 ‘% omo I, % (w/v) 2.480 0.077 3.90 0.10 5.333 0.084 8.35 0. I 5 Y.14 0. I I m’ls 9.120 0.093 8.980 0~028 8~850 0,044 8.720 0.028 x.600 ( I+57 h 0.000 a 0~000 % 0.000 K 0400 r* 0,000 7 % (w/v) 2.92 0.14 4.500 0.061 6.65 0.11 XJX~O 0~094 10.40 0.23 m’ls 8.820 0.061 8,770 0.059 x.700 0~055 8.67 0.13 8.400 OGi I h 0~000 a 0.000 X’ 0.000 Z’ 0.02 0.25 0.01 0. I2 % (w/v) 3,330 0,083 4.89 0.12 6.63 0.14 10.00 0.26 11.3(1 0.13 “ID=identification; bMII=Y5% marginal inference interval
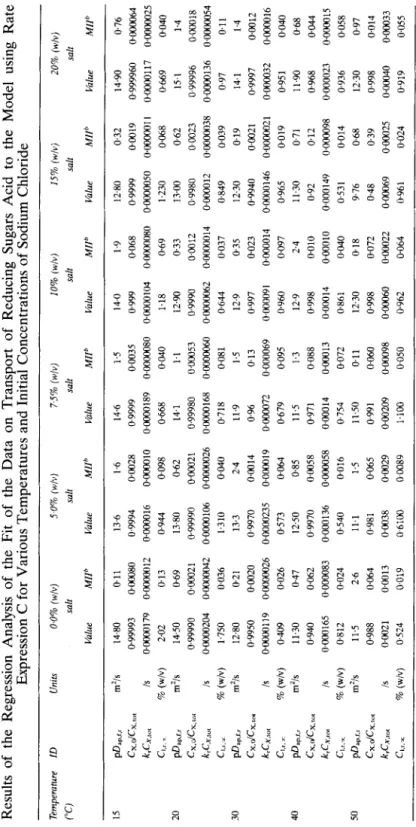
TABLE 7 Results of the Regression Analysis of the Fit of the Data on Transport of Reducing Sugars Acid to the Model using Rate Expression C for Various Temperatures and Initial Concentrations of Sodium Chloride Temperahue ID (“C) Unils 0.0% (w/v) 5.0% (w/v) 7.5% (WiVJ 10% (wlvj 15% (w/v) 20% (w/v) salt salt salt salt salt salt VflLU MIIb KllU Mllh Vahe MIP VRlU MIIb lhhe MIP Vallle MIIb 40 dls Is % (w/v) m% Is % (w/v) m*/s Is % (w/v) m’is is % (w/v) m*/s Is % (w/v) 14.80 0.11 13.6 0.99993 OGXI80 0.9994 oaCO179 oawO12 OGGOOl6 2.02 0.13 0.944 14.50 0.69 13.80 0.99990 ON!O21 0.99990 0Gl00204 OGlOGO42 @0000106 1.750 0.036 1.310 12.80 0.21 13.3 0.9950 oaO20 0.9970 ooxa119 0aOOw26 OGOOO235 0409 0.026 0,573 11.30 0.47 1250 0.940 0.062 0.9970 0.000165 0.000083 @000136 0,812 0.024 0540 11.5 2.6 11.1 0.988 0.064 0.981 Oaul 0.0013 00338 0,524 DO19 0~6100 1.6
IN028 0,098 0.62 Ooxl21 OW_U!O26 oao
24
oGO14 ~000019 0,064 0.85 OaO58 0,016 1.5 0.065 0.0029 Do089
146 1.5 0.9999 0.0035 OXIOOO189 0aOooo80 0.668 0,040 14.1 1.1 0.99980 oaO53 OGCOl68 oaOoOO6O 0.718 0.081 11.9 1.5 0.96 0.13 00XO72 0.000069 0.679 0,095 11.5 1.3 0,971 0.088 oGoo14 oaO13 0.754 0.072 11.50 Cl1 0,991 0.060 0.00209 O~ooO98 1.100 0.050 14.0 1.9 0,999 0.068 0aO00104 0aONl080 1.18 0.69 12.90 0.33 O,QQW oCo12 oaOcoO62 oaOOOo14 0.644 0.037 12.9 0.35 0.997 0,023 oaNO9 I 0oN014 0.960 0,097 12.9 2.4 0.998 0.010 0alO14 0~00010 0.861 owe 12.30 0.18 0,998 0,072 OGQO60 oao22 12.80 0.32 14.90 0.76 0.9999 oax9 0.999960 OGC0O64 oaOOoO5o OaGaJl I oOOOO117 OGWOO25 1.230 0.068 0.669 0.040 13al 0.62 15.1 1.4 0~9980 0.0023 0.99996 0a3a18 oaOOo12 0Gi)00038 @0000136 oaOOCos4 0.849 0.039 0.97 0.11 12.30 0.19 14.1 1.4 0.9940 0.0021 0.9997 OaO12 0~0000146 0~00cOO21 O.OOCO32 ONiOO16 0.965 0,019 0.951 0.040 11.30 0.71 11.90 0.68 0.92 0.12 0.968 0.044 0~000149 0030098 0~000023 oTnOo15 0.531 0,014 0.936 0,058 9.76 0.68 12.30 0.97 0.48 0.39 0.998 0.014 OGOO69 OXIOO25 oaOO4o oaoo33 0.961 0,024 0.919 0.055 “ID=identification; bMII=95% marginal inference interval.
Modelling the transport of lactic acid 175
DISCUSSION AND CONCLUSIONS
As explained above, Models A, B and C require rupture of the cell membrane prior to release of the sugars into the brine (although this rupture may follow different kinetics depending on the model in question); this assumption is confirmed by the observation that the weight of immersed carrot slices increased by 7-10% (w/w) during brining in plain water (data not shown), an increase which is most likely a result of the osmotic intake of water by the cells that will eventually degenerate into bursting thereof (or, at least, into expansion of the cell wall with concomitant increase in its porosity, which is equivalent for our purposes to bursting). The observation that V, varies implies that parameter ai, as defined by eqn (7), is not a constant for each experiment, and it also implies that (dC,/dt), as utilized in eqn (16) and (20), should be replaced by (dC,ldt) -tC,[dln(V,)ldt]. However, the non- linear regression results were virtually insensitive to deliberate disturbances of up to
10% on V,, i.e. the difference between the best parameter estimates obtained therewith and the original parameter estimates obtained under the assumption that bulk intake of water by the carrots is absent, was only a very small fraction of the listep parameter 95% inference intervals. It should also be noted here that, although x,, C:,i and Cc,iy< decrease, and Cl,i and C,,i, increase as time of immersion elapses by virtue of such an osmotic intake of water by the carrots, such variations cancel out in the mass balances depicted as eqn (10) and eqn (11).
It is apparent from inspection of Tables 5 and 6 that the inference intervals associated with parameter to overlap the null hypothesis for virtually every data set. On the other hand, most parameters associated with Models B and C pertaining to the simulation of transport of acid and salt remain indeterminate after successful non-linear regression analyses (results not shown). Coupling these observations with the results of the extra sum of squares analyses tabulated in Tables 2 and 3, one is finally led to the conclusion that Model A is statistically sufficient to model every data set pertaining to the transport of acid and salt under the assumption that to-O. Most parameters associated with Model B for the simulation of transport of reducing sugars (results not shown) remain indeterminate after successful non-linear regression analysis. Although the 95% inference intervals of virtually all parameters associated with Models A (results not shown) and C (see Table 7) do not overlap zero, the sum of squares of residuals associated with the latter is sufficiently smaller than that of the former to be of statistical significance (see Table 4). Hence, from the set of three models postulated and tested, Model C should be elected as the best representation of the data generated for the transport of reducing sugars. The values for the diffusivities of salt are similar to those obtained by Bomben et al. (1974) in experiments pertaining to desalting of vegetable pickles; these authors also found increases in the diffusivities as temperature increases. For the higher temperatures, the apparent diffusion coefficients obtained for the transport of reducing sugars according to Model A (results not shown) are of the order of magnitude of those reported by Oliveira (1988).
The total concentration of the brines in terms of acid or salt was deliberately fixed, a situation that is in contrast with the total concentration of reducing sugars in the carrot which is a function of the maturation state, the variety, the size, the axial position, etc. (i.e. variables which are usually beyond one’s control). Therefore, although the concentrations of acid and salt in the carrot approach equilibrium values which are close to the total initial concentration of the brine (and higher as
176 R. M. Nabais, M. C. Vieira, l? X. Malcata
the temperature increases, as apparent from inspection of Figs 1 and 2), the concentrations of reducing sugars in the brine vary randomly between experiments performed at different temperatures and initial concentration of salt in the brine. Therefore, a much more informative picture of the situation is obtained if such concentrations are normalized by the equilibrium concentrations of reducing sugars for each data set (as done in Fig. 3). Using these transformed concentrations, it is apparent that high temperatures (say 40°C and above) lead to a behaviour which is consistent with the direct application of Fick’s law, whereas low temperatures (say, 30°C and below) lead to a situation where full occurrence of the diffusional transport is slower as temperature is decreased. Recalling that the transport of acid and salt are well modelled by Model A and that transport of reducing sugars is well modelled by Model C, one can also conclude that increases in temperature lead to increases in Dap,r,i, or in both Dap,f,i and kiCx,tot (as would be expected from the assumption of Arrhenius dependencies on temperature).
It is remarkable that the degree of integrity of the carrot cells at the start-up of the experiments, which is measured by parameter CX,JCX,tot, was in all but one case very close to unity (i.e. above 0.99), which is an indication of the fact that the carrots were essentially intact (and were likely to have been harvested just prior to experimentation). It should be noted that the marginal inference intervals associated with this parameter were in all cases very narrow, which suggests that slight (say 0.1% or less) variations of this parameter about their best estimate lead to major distortions of the fit. The influence of the integrity of the cells on the rates of sugar transfer have been quantified previously by Soddu & Gioia (1979) and Oliveira (I988), although theoretical explanations for this fact followed alternative approaches.
For practical purposes, the production of lactic acid pickles by fermentation requires that a significant amount of fermentable sugars are available in the brine soon after submersion of the vegetable; our experiments indicate that high tem- peratures (say, above 30°C) should be employed in order to accelerate the process of sugar leaching (i.e. to have it virtually completed within 48 h). (The transport of salt into the carrots is much faster than that of sugar irrespective of the operating temperature utilized, so the operating temperature does not play an important role in this case.) On the other hand, owing to the low acid tolerance of the fermenting strains (according to Fleming (1982), the threshold is approximately 1.4%) the varieties commonly used in commercial pickling need not be those initially richer in sugar. Having lower initial contents of sugars is often related to higher contents of structural components, and this is also an advantage in the production of pickles where problems of final texture (which is considerably affected by the amount of acid produced (Bell et cd, 1972)) have to be addressed.
Given the significant variations of the various adjustable parameters with the operating conditions chosen, a logical sequence of this work would be to attempt to quantify these relationships. The results of that quantification are available in the following paper of this series.
ACKNOWLEDGEMENTS
The availability of Dr Fernanda A. Oliveira, c/o Escola Superior de Biotecnologia, for critical discussions relevant to the topic of this communication is hereby gratefully acknowledged.
Model&g the transport of lactic acid 177
REFERENCES
Adams, M. R. & Hall, C. J. (1988). Growth inhibition of food-borne pathogens by lactic and acetic acids and their mixtures. ht. 1. Food Sci. Technol., 23, 287.
Alabran, D. M. & Mabrouk, A. F. (1973). Sugars and free nitrogenous compounds in fresh carrots. J. Agric. Food Chem., 21, 205.
Anderson, R. (1984). Characteristics of the bacterial flora isolated during spontaneous lactic acid fermentation of carrots and red beets. Lebensmitt.- Wiss. Technol., 17, 282.
Anderson, R., Erikson, C. E., Salomonsson, A. C. & Theander, 0. (1990). Lactic acid fermentation of fresh and stored carrot: chemical, microbial, and sensory evaluation of products. Lebensmitt.- Wiss. Technol., 23, 34.
Bailey, J. E. & Ollis, D. F. (1986). Biochemical Engineering Fundamentals. McGraw-Hill, New York.
Bates, D. M. & Watts, D. G. (1980). Nonlinear Regression Analyses and Its Application.,.
Wiley, New York.
Bell, T. A., Turney, L. J. & Etchells, J. L. (1972). Influence of different organic acids on the firmness of fresh-pack pickles. J. Food Sci., 37, 446.
Beristain, C. I., Azuara, E., Cortez, R. & Garcia, H. S. (1990). Mass transfer during osmotic dehydration of pineapple rings. Int. J. Food Sci. Technol., 25, 576.
Biswall, R. N. & Maguer, M. (1989). Mass transfer in plant materials in contact with aqueous solutions of ethanol and sodium chloride: equilibrium data. J. Food Proces. Engng, II, 159. Bomben, J. L., Durkee, E. L., Lowe, E. & Secor, G. E. (1974). A laboratory study on counter
current desalting of pickles. J. Food Sci., 39, 260.
Caracotsios, M., Stewart, W. E. & Sorensen, J. P. (1985). GREG User:7 Manual. Department of Chemical Engineering of the University of Wisconsin, Madison.
Crank, J. (1975). The Mathematics of Diffusion. Oxford University Press, Oxford.
Etchels, J. L., Bell, T. A. & Jones, I. D. (1950). Softening of commercial cucumber salt-stock in relation to polygalacturonase activity. Food Technol., 4, 157.
Etchels, J. L. & Moore, W. R. (1971). Factors influencing the brining of pickling cucumbers - questions and answers. Pickle Pack Sci., 1, 1.
Fabian, F. W. & Wadsworth, C. K. (1939). Experimental work on lactic acid in preserving pickles and pickle products. 1. Rate of penetration of acetic and lactic acid in pickles. Food Res., 4, 499.
Fleming, H. P. (1982). Fermented vegetables. In Economic Microbiology, Fermented Food.7.
ed. H. Rose. Academic Press, New York, p. 227.
Fleming, H. P., McFeeters, R. L., Thompson, R. L. & Sanders, D. C. (1983). Storage stability of vegetables fermented with pH control. J. Food Sci., 48, 975.
Goris, A. (1969). Carbohydrate metabolism of cultivated carrot roots (variety Nantaisc demi longue) during the vegetative cycle of the plant. Qual. Plant. Mater: Vegetab., 18, 283. Kincan, N. S. & Kaymak, F. (1987). Modelling of dry matter losses from carrots during
blanching. J. Food Proc. Engng, 9, 201.
Liu, H. (1992). A kinetic study of salt diffusion in potato at high temperature. J. Food Sci. Technol., 27, 443.
McKnee, J. M. T. (1985). A single method for the extraction of reducing sugars and nonreducing sugars from carrots and other storage vegetables. J. Sci. Food Agric., 36, 55.
Meyer, B. S., Anderson, D. B. & Bohning, R. (1965). Introdugafi 2 Fisiologia Vegetal. Fundaco Calouste Gulbenkian, Lisbon.
Miller, G. L. (1959). Use of dinitrosalicylic acid reagent for determination of reducing sugar.
Analyt. Chem., 31,426.
Moreira, L. A., Oliveira, F. A. R. & Silva, T. R. (1992) Prediction of pH change in processed acidified turnips. Int. J. Food Sci. Technol., 57, 928.
Oliveira, F. A. (1988). Mass transfer analysis for the leaching of water soluble components from food. Ph.D. thesis, Department of Food Science, University of Leeds, UK.
178 R. M. Nabais, M. C. Vieira, F X. Malcata
Oliveira, F. A. R. & Silva, C. L. M. (1992) Freezing influences diffusion of reducing sugars in carrot cortex. Int. J. Food Sci. Technol., 57, 932.
Phan, C. T. & Hsu, H. (1973). Physical and chemical changes occurring in the carrot root during growth. Can. J. Plant Sci. 53, 629.
Pflug, I. J., Fellers, P. J. & Gurevitz, D. (1967). Diffusion rates in the desalting of pickles. Food Technol., 21, 1634.
Potts, E. A., Fleming, H. P., McFeeters, R. F. & Guinnup, D. E. (1986). Equilibration of solutes in nonfermenting, brined pickling cucumbers. J. Food Sci., 51, 434.
Richardson, M. (1975). Translocation in Plants. Edward Arnold, London.
Salisbury, F. & Ross, C. (1978). Plant Physiology. Wadsworth Publishers, Belmont, California. Schwartz, J. B. & Carnoad, P. A. (1979). Recycling water in vegetable blanching. Food
Technol., 33, 54.
Schwartzberg, H. B. and Chao, R. Y. (1982). Solute diffusivities in leaching processes. Food Technol. 36, 73.
Schwimmer, S. (1980). Influence of water activity on enzyme reactivity and stability. Food Technol., 34, 64.
Selman, J. D. & Rolfe, E. J. (1979). Effects of water blanching on pea seeds. I. Fresh weight changes and solute loss. J. Food Technol., 14, 493.
Selman, J. D., Rice, P. & Abdul-Rezzak, R. K. (1983). A study of apparent diffusion coefficients for solute losses from carrots during blanching in water. J. Food Technol., 18, 427.
Soddu, A. & Gioia, F. (1979). Diffusion through living systems: sugar loss from sugar beets. Chem. Engng Sci., 34,763.
Stahl, R. & Loncin, M. (1979). Prediction of diffusion in solid foodstuffs. J. Food Proc. Preset-v., 3, 213.
Steinkraus, K. H. (1983). Acid fermented vegetables. In Handbook of Indigenous Fermented Foods Involving an Acid Fermentation. Marcel Dekker, New York.
Toupin, C. J., Marcotte, M. & Maguer, M. (1989). Osmotically-induced mass transfer in plant storage tissues: a mathematical model. Part I. J. Food Engng, 10, 13.
Tuncan, E. U. & Martin, S. E. (1990). Combined effects of salts and temperature on the thermal destruction of Staphylococcus aureus MF-31. J. Food Sci., 55, 833.