UNIVERSIDADE DE LISBOA
FACULDADE DE MOTRICIDADE HUMANA
Sexual dimorphism in upper-limb blood flow restricted exercise
Dissertação elaborada com vista à obtenção do grau de Mestre em Treino Desportivo
Orientador: Prof. Doutor Pedro Luís Camecelha de Pezarat Correia Coorientador: Prof. Doutor Gonçalo Laima Vilhena de Mendonça
Júri: Presidente
Doutor Francisco José Bessone Ferreira Alves, professor catedrático da Faculdade de Motricidade Humana da Universidade de Lisboa.
Vogais
Doutor Pedro Luís Camecelha de Pezarat Correia, professor associado com agregação da Faculdade de Motricidade Humana da Universidade de Lisboa.
Doutor Pedro Miguel Sousa Fatela, professor auxiliar da Universidade Europeia.
Afonso de Sousa Gomes Borges 2017
3 “I have been impressed with the urgency of doing. Knowing is not enough; we must apply. Being willing is not enough; we must do.” Leonardo da Vinci
5 Acknowledgments (Português)
Em primeiro lugar, quero deixar um especial agradecimento à minha família, por todo o suporte ao longo de todo o meu percurso académico e no culminar desta mais recente etapa. Em especial à minha Mãe pelo apoio incondicional que sempre tornou tudo possível e às minhas Irmãs por inconscientemente fazerem de mim um irmão mais velho mais responsável.
Um sincero agradecimento aos professores orientadores da tese e do início do meu percurso de investigação científica, professores que se tornaram uma importante referência e com quem aprendi muito. Ao Professor Doutor Pedro Pezarat Correia por abertamente me ter recebido no Laboratório de Comportamento Motor e me ter orientado no meu primeiro contacto com a investigação científica, além da disponibilidade e preocupação em ajudar em todas as circunstâncias ao longo do processo. Ao Professor Doutor Gonçalo Mendonça, por me ter confiado este estudo e me ter atribuído importantes funções no laboratório. Um grande reconhecimento por ter confiado nas minhas capacidades e sobretudo pelo auxílio sistemático e fundamental ao longo do desenvolvimento da tese. Ainda ao Professor Doutor Pedro Mil-Homens pela boa disposição e pela excelente capacidade de trabalho, foi para mim uma importante referência durante o mestrado, ao Professor Doutor Francisco Alves enquanto coordenador do mestrado foi um importante mediador na orientação para o ramo de especialização e a outros professores que marcaram de alguma forma o meu percurso no ensino superior.
Ao Pedro e à Carolina, amigos e colegas de laboratório, pelas partilhas e discussões dentro e fora do laboratório que tornaram a aprendizagem e o percurso mais fácil e divertido. Também ao Paulo Correia e ao Paulo Santos que se mostram sempre disponíveis para ajudar.
6 Para aquele grupo de amigos que me fazem refletir, que questionam e me desafiam e com quem posso sempre contar, em especial ao Tiago e ao André, os mais “antigos” e com quem já aprendi muito e espero aprender mais.
Por último mas não menos importante, quero agradecer a todos os participantes e outros intervenientes neste e nos estudos em que me envolvi, pela disponível e indispensável participação, incluindo aqueles que me desafiaram e me incentivaram na realização da tese.
7 Abbreviations
1RM – 1-repetition maximum ANOVA – analysis of variance ANCOVA – analysis of covariance AOP – absolute occlusion pressure AT – adipose thickness
BFR – blood flow restriction BMI – body mass index BP – blood pressure CSA – cross-sectional area CV – coefficient of variation
DOMS – delayed onset muscle soreness EMG – electromyography
HI – high intensity
ICC – intraclass correlation coefficient
LIBFR – low intensity exercise with blood flow restriction MAP – mean arterial pressure
MU – motor units
MVC – maximum voluntary contraction PCr – phosphocreatine
8 Pi – inorganic phosphate
R2 – coefficient of determination ROM – range of motion
SD – standard deviation VIF - variance inflation factors
Units of measure
cm – centimeters
h - hours
kg – kilograms
kg/m2 - kilograms per square meter
min - minutes
mmHg – millimeters of mercury
N.m – newton-meter
s - seconds
9 Table of Contents
I. Introduction ... 16
II. Review of literature ... 18
Low intensity training with blood flow restriction ... 18
Acute responses to low intensity training with blood flow restriction ... 22
Sexual Dimorphism in response to low intensity training with blood flow restriction ... 25
Limitations and potential safety issues regarding BFR resistance exercise ... 29
III. Purpose and goals ... 31
IV. Methods ... 32
Participants ... 32
Study Design ... 32
Study #1 – AOP prediction ... 34
AOP determination and prediction ... 34
Determination of AOP ... 35
Study #2 – Torque decrement following HI vs. LIBFR training ... 36
1-Repetition maximum ... 37
Maximal voluntary contraction: ... 38
Acute resistance training ... 39
Statistical Analysis ... 40
Study #1 – AOP prediction ... 40
Study #2 – Torque decrement following HI vs. LIBFR training ... 41
V. Results ... 43
Baseline measurements ... 43
Study #1 – AOP prediction ... 44
Study #2 – Torque decrement following HI vs. LIBFR training... 48
VI. Discussion ... 51
Study #1 – AOP prediction ... 51
Study #2 - Torque decrement following HI vs. LIBFR training ... 55
Limitations ... 58
VII. Conclusions ... 60
10 Tables Index
Table 1. Exercise protocols ... 36
Table 2. Characteristics of participants ... 43
Table 3. Reliability analysis of resting hemodynamics and absolute occlusion pressure (AOP) values in men and women ... 45
Table 4. Regression model for absolute occlusion pressure (AOP) prediction ... 46
Table 5. Maximal voluntary contraction (MVC) before and after two different protocols of acute resistance training. ... 49
Figures
Figure 1. Schematic representation of study #1 and #2. ... 33
Figure 2. Graphic representation of absolute occlusion pressure determination ... 36
Figure 3. Graphic representation of LIBFR exercise ... 40
Figure 4. Schematic representation of the hemodynamic variables and absolute occlusion pressure (AOP) ... 44
Figure 5. Relationship between absolute occlusion pressure (AOP) with systolic blood
pressure (systolic BP) and arm circumference in men and women ... 46
Figure 6. Bland-Altman plot between actual and predicted absolute occlusion pressure (AOP) ... 47
11 Figure 7. Torque decrement following high intensity (HI) and low intensity resistance
12 Abstract
Purpose: Low intensity blood flow restricted (LIBFR) exercise elicits acute changes in torque output and muscle activation. The magnitude of these changes affect chronic adaptions to this type of training. However, despite its widespread use by men and women, it is not known whether the acute impact of LIBFR follows a sexually dimorphic pattern. We aimed at exploring whether: 1) the relationship of absolute occlusion pressure (AOP) with arm circumference and resting blood pressure (BP) differs between men and women; and 2) there is sexual dimorphism in fatigue following two different upper-limb resistance-training protocols (non-BFR high intensity - HI resistance training vs. LIBFR exercise).
Methods: Sixty-two healthy young participants (31 men: 21.7 ± 2.3; 31 women: 22.0 ± 2.0 yrs) were included in this study. Participants visited the laboratory on two different occasions (biceps curl - HI day vs. LIBFR day; randomized and counterbalanced fashion). Arm circumference as well as other anthropometric measurements were obtained from each participant. BP and AOP were taken twice for reliability purposes. Participants performed maximum voluntary contractions (MVC) at pre- and post-training time points. One-repetition maximum (1RM) was quantified in each participant before pre-training MVC. HI was performed at 75% 1RM and LIBFR at 20% 1RM with 60% blood flow restriction (BFR). Results: Multiple linear regression analyses showed that arm circumference, systolic BP and sex were all significant predictors of AOP (p < 0.05), explaining 42% of its variance. Bland-Altman plots revealed that the mean difference between actual and estimated AOP was virtually zero (men: -0.14; women: -0.01 mmHg), with no systematic over or under-estimation. Both HI and LIBFR training protocols induced significant muscle fatigue in men and women from pre- to post-training (p < 0.05). HI was more fatiguing than LIBFR in both sexes (p < 0.05) even after controlling for the differences in volume load between protocols. Importantly, the
13 magnitude of torque decrement was similar between men and women after HI and LIBFR training.
Conclusions: Arm circumference, systolic BP and sex are significant predictors of upper-limb AOP. Their measurement allows the indirect estimation of BFR pressure to use within the context of exercise training. Performing upper-limb LIBFR exercise using a multiple-set training protocol is less fatiguing than HI resistance exercise in men and women and this is independent of volume load. Torque decrements in response to upper-limb LIBFR and HI do not follow a sexually dimorphic pattern, providing evidence that there is no need to establish different guidelines for men and women when prescribing upper-limb LIBFR exercise.
Keywords: KAATSU, blood flow restriction, low-intensity exercise combined with blood flow restriction, upper-limbs, blood pressure, absolute occlusion pressure, acute response, muscle fatigue, torque decrements, sexual dimorphism.
14 Resumo (Português)
Objetivos: O treino de força de baixa intensidade com restrição vascular (LIBFR) provoca alterações agudas na produção de torque e na atividade muscular. A magnitude destas alterações influencia as adaptações crónicas a este tipo de treino. Apesar de amplamente utilizado em homens e mulheres, não se sabe se existe um dimorfismo sexual na resposta aguda ao treino LIBFR. O estudo procurou explorar: 1) Se a relação da pressão de oclusão absoluta (AOP) com o perímetro do braço e a pressão arterial de repouso (BP) difere entre homem e mulher; e 2) se existe um dimorfismo sexual na fadiga muscular como resposta a dois protocolos de treino de força distintos no membro superior (Treino de alta intensidade sem restrição vascular – HI vs. LIBFR).
Métodos: Sessenta e dois participantes jovens e saudáveis (31 homens: 21.7 ± 2.3; 31 mulheres: 22.0 ± 2.0 anos) foram incluídos no estudo. Os participantes visitaram o laboratório em duas ocasiões diferentes onde realizaram os dois protocolos de treino (flexão do antebraço – dia HI vs. dia LIBFR; realizados de forma aleatória e alternada entre dias). Variáveis antropométricas incluindo perímetro do braço foram obtidas para cada participante. As variáveis BP e AOP foram recolhidas em duplicado para propósitos de fiabilidade. Os participantes realizaram contrações voluntárias máximas (MVC) nos momentos pré- e pós-treino. O valor de 1-repetição máxima (1RM) foi avaliado em cada participante antecedendo a MVC pré-treino. O protocolo HI foi realizado a 75% 1RM e LIBFR a 20% 1RM com 60% de pressão de restrição (BFR). Resultados: O modelo de regressão linear múltipla mostrou que as variáveis perímetro do braço, pressão arterial sistólica e sexo são preditoras da AOP (p < 0.05) e explicam 42% da variância. Gráficos de Bland-Altman mostraram que a diferença média entre a AOP real e estimada foi próxima de zero (homens: -0.14; mulher: -0.01 mmHg), sem sobre ou subestimação sistemática. Ambos os protocolos de treino (HI e LIBFR) induziram fadiga
15 muscular significativa no homem e na mulher do pré para pós-treino (p < 0.05). O treino de HI foi no entanto mais fatigante que o LIBFR para ambos os sexos (p < 0.05), mesmo quando covariando as diferenças no volume da carga entre protocolos. Além disso, a magnitude do decréscimo de torque do pré para o pós-treino foi semelhante entre homem e mulher, para ambos os protocolos (HI e LIBFR).
Conclusões: As variáveis perímetro do braço, pressão arterial sistólica e sexo são preditores significativos da AOP no membro superior. A sua avaliação permite estimar indiretamente a BFR a aplicar no contexto de treino. Protocolos de treino LIBFR para o membro superior com múltiplas séries e número de repetições definidas são menos fatigantes que protocolos HI, tanto para homens e mulheres, independentemente do volume da carga. O decréscimo de torque em resposta a protocolos LIBFR e HI não apresenta um padrão de dimorfismo sexual, mostrando que para efeitos de prescrição de treino LIBFR no membro superior não existe necessidade de diferenciar as orientações metodológicas para homens e mulheres.
Palavras-chave: KAATSU, restrição vascular, treino de força com restrição vascular, membro superior, pressão arterial, pressão de oclusão absoluta, resposta aguda, fadiga muscular, decréscimo de torque, dimorfismo sexual.
16 I. Introduction
Low-intensity exercise combined with blood flow restriction (LIBFR), often known as KAATSU training, is known to elicit increases in both muscle size and strength to a similar, or even greater, extent than resistance training performed at higher intensities (Shinohara, Kouzaki, Yoshihisa & Fukunaga, 1997; Takarada, Takazawa, Sato, Takebayashi, Tanaka & Ishii, 2000; Abe, Kearns & Sato, 2006; Karabulut, Abe, Sato & Bemben, 2010; Clark, Manini, Hoffman, Williams, Guiler, Knutson & Kushnick, 2011). This relatively new method of training involves the application of an inflatable cuff or tourniquet around a limb, usually proximal to the trained muscles and aims to limit blood flow to and from the contracting muscles (Scott, Loenneke, Slattery & Dascombe, 2015).
Despite being performed with a low total exercise training volume, LIBFR has been consistently shown to be effective in increasing muscle thickness and muscle function (i.e. strength, power, endurance), making it a viable option to enhance muscle size and endurance for middle-aged individuals who may be unable to perform resistance training with high loads. (Abe, Yasuda, Midorikawa, Sato, Inoue, Koizumi & Ishii, 2005; Fahs, Loenneke, Thiebaud, Rossow, Kim & Abe, 2015). Furthermore, the increases both in strength and rate of torque development with this training approach are particularly relevant for the elderly or post-surgery rehabilitation patients, for whom training with high mechanical stress may be dangerous (Shinohara et al., 1997). For these individuals, a reduced overload at the joints and ligaments may possibly reduce the incidence of injury, while still providing an adequate stimulus to improve muscle strength and elicit muscle hypertrophy (Takarada et al., 2000, Takarada, Sato & Ishii, 2002; Moore, Burgomaster, Schofield, Gibala, Sale & Philips, 2004; Karabulut, Abe, Sato & Bemben, 2007). Furthermore, research has also demonstrated muscular benefits from BFR training in athletic populations (Takarada et al., 2002; Cook, Kilduff & Beaven, 2014).
17 There is compelling evidence that LIBFR exercise induces changes in torque and muscle activation with relative loads of approximately 20-30% 1RM when supplemented with low to moderate restrictive pressure (40-60% of absolute occlusion pressure, AOP) (Loenneke, Kim, Fahs, Thiebaud, Abe, Larson & Bemben, 2015b). These acute responses to BFR exercise may ultimately affect the adaptations to this form of training, thus supporting the mechanistic rationale for muscle hypertrophy post-LIBFR resistance exercise (Loenneke, Wilson & Wilson, 2010). BFR pressures relative to the individual AOP have shown to be the most effective method of prescribing BFR exercise (Laurentino, Ugrinowitsch, Roschel, Aoki, Soares, Neves & Tricoli, 2012; Scott et al., 2015). Still, training pressures greater than these submaximal levels (40-60%AOP) do not increase the muscular response and may otherwise exacerbate the risk for potential injury (Loenneke et al., 2015b).
It is not known whether the response to upper-limb LIBFR training follows a sexually dimorphic pattern (Counts, Rossow, Mattocks, Mouser, Jessee, Buckner, Dankel & Loenneke, 2016). Despite the use of BFR exercise being widespread between sexes, there is few information on the impact of BFR on women due to their underrepresentation in the literature. This is an important limitation of the existent research because, when compared to men, women have muscle fibers of smaller diameter (Miller, MacDougal, Tarnopolsky & Sale, 1993), higher density of type I muscle fibers (Moritani, Oda, Shibata, Matsumoto & Mimasa, 1991), higher muscle capillarization and heightened muscle perfusion (Hunter, 2014). All these sexually dimorphic factors likely influence the blood flow response to LIBFR exercise, as well as the acute and chronic muscle adaptations to this training stimulus. For all these reasons, it is important to explore whether men and women exhibit differences in response to BFR resistance training. Ultimately, this will allow optimizing exercise prescription for those interested in engaging in this type of exercise training.
18 II. Review of literature
Low intensity training with blood flow restriction
LIBFR exercise is currently accepted as an effective training method to increase muscle size and strength in different populations. To restrict blood flow during resistance exercise, a cuff or band (typically a pneumatic cuff) is placed on the most proximal portion of the exercising limb. If properly pressurized, cuff inflation will reduce arterial blood inflow to the working muscle and occlude venous return. This elicits pooling of venous blood around the exercising muscle (Fahs, Loenneke, Rossow, Thiebaud & Bemben, 2012) and likely triggers a series of mechanisms implicated in muscle hypertrophy.
The efficacy of BFR exercise on generating muscle growth is achieved by balancing the level of blood flow restriction with an appropriate level of muscle activation and fatigue (contractile/metabolic impairment) (Fahs et al., 2012). Thus, when performing and prescribing LIBFR training, there are numerous variables to manipulate, such as cuff pressure to be used on an individual basis. Ultimately, cuff pressure should be defined based on the individual aspects (e.g. limb size) and methodological characteristics (e.g. cuff size and pressure, exercise protocol) of each exercise prescription (Fahs et al., 2012). Currently there is no standard method for the application of blood flow restriction during resistance exercise. BFR varies as a function of cuff specificities (size and material), pressure and duration of restriction and all these factors dictate the need for a careful consideration in the prescription of BFR resistance training (Fahs
et al., 2012). Nevertheless, there are a few recommendations in the available literature that have
been widely accepted as effective for prescribing BFR exercise: (A) Blood flow restriction
devices: different sized inflatable nylon cuffs are often used for BFR. Wider cuffs need less
inflation pressures to be more effective at restricting arterial blood flow (Loenneke, Fahs, Rossow, Sherk, Thiebaud, Abe, Bemben & Bemben, 2012). Wider cuffs (6 – 13.5 cm) are often
19 used for lower body exercise and narrower cuffs (3 – 6 cm) for upper body training (Fahs et al., 2012). (B) Cuff pressure: many studies have used standardized pressures between 140 – 240 mmHg (e.g. Abe et al., 2005; Fahs, Rossow, Loenneke, Thiebaud, Kim, Bemben & Bemben, 2011) and/or 100 – 160 mmHg (e.g. Takarada et al., 2000; Moore et al., 2004) for lower and upper body, respectively. This has been shown to be effective for inducing significant muscle adaptations. Other authors prescribed restrictive pressures based on a supramaximal value of the participants’ resting brachial systolic BP, typically 130% (e.g. Takano, Morita, Lida, Asada, Kato, Uno & Eto, 2005; Abe et al., 2006; Yasuda, Brechue, Fujita, Shirakawa, Sato & Abe, 2009). However, this methodology was shown to be unsuccessful in controlling the magnitude of BFR (Loenneke et al., 2012). More recently, it was shown that limb circumference has a great influence on the pressure necessary to occlude blood flow (AOP). Thus, there is general agreement that limb circumference should be viewed as a fundamental variable within the context of LIBFR exercise prescription (Fahs et al., 2012; Cook, Murphy & Labarbera, 2013). Accordingly, recent studies have established individualized BFR pressures based on a percentage of AOP, which takes in consideration potential individual factors influencing this pressure on the exercising limb (Laurentino et al., 2012; Loenneke, Fahs, Rossow, Thiebaud, Mattocks, Abe & Bemben, 2013a). Current research acknowledges the importance of setting an individualized cuff pressure (Loenneke et al., 2013a; Scott et al., 2015) and further recommends setting a relative BFR pressure based on a percentage of each individual AOP value. This pressure should be high enough to occlude venous return, but sufficiently low to ensure partial arterial inflow into the exercising limb (Loenneke et al., 2013a; Loenneke, Thiebaud & Abe, 2014). This approach is one of the most reliable and effective methods for cuff pressure prescription because it maximizes short- and long-term responses to LIBFR exercise (Laurentino, Ugrinowitsch, Aibara, Fernandes, Parcell, Ricard & Tricoli, 2008; Laurentino et
20 BFR intensity greatly influences muscular activation and neuromuscular fatigue (Loenneke et
al., 2015b; Fatela, Reis, Mendonça. Avela & Mil-Homens, 2016). The direct measurement of AOP is though often not practical for BFR exercise practitioners, but it can be estimated or predicted with reasonable success based on standardized regression models, specific for upper and lower body (Loenneke, Allen, Mouser, Thiebaud, Kim, Abe & Bemben, 2015a; Hunt, Stodart & Ferguson, 2016). Therefore, accounting for factors such as systolic BP, cuff size and limb circumference for AOP prediction is important not only to promote an optimal training overload, but also for warranting safe exercise prescription to each participant (Loenneke et al., 2012, 2013a, 2015a). Despite past research has used BFR pressures equivalent to 80% AOP (Laurentino et al., 2012), more recently it was shown that an individualized BFR pressure of 50% AOP maximizes electromyographic (EMG) amplitude, torque decrement, acute muscle swelling and heightened levels of blood lactate, suggesting that high relative pressures (>60%AOP) are not needed to benefit from LIBFR exercise (Loenneke et al., 2015b). As importantly, pressures between 40-60% AOP elicit similar blood flow characteristics. Thus, there is compelling evidence that the use of restrictive pressures > 60% should simply be avoided within the context of LIBFR exercise (Mouser, Ade, Black, Bemben & Bemben, 2017). Despite sex has not been previously explored as predictor of AOP, there are considerable differences between men and women from a physiological standpoint. Accordingly, the interaction between sex and BFR is highly likely. Setting the individual AOP typically relies on the three following methods: (1) taking a direct measurement of the individual AOP using a Doppler probe to detect (via visual and auditory signals) the pressure (in mmHg) where blood flow is completely interrupted by inflating a pneumatic cuff (Laurentino et al., 2008); (2) AOP prediction based on ranges of individual limb circumference (Loenneke et al., 2013a) determined by previous data set based on a large sample size; and (3) prediction through regression equations that include different AOP predicting factors, also from large sample sizes
21 (Loenneke et al., 2015a; Hunt et al., 2016; Mouser et al., 2017). (C) Continuous vs. intermittent
blood flow restriction: The existent data suggest that continuous blood flow restriction,
maintained during the entire training session, is more effective than intermittent blood flow for increasing the recruitment of high-threshold motor units (MU) and metabolic stress during low-load exercise (Fahs et al., 2012).
As for the resistance exercise protocol, the following variables are particularly important: (A) Exercise intensity: resistance exercise intensities ranging from 15% maximal voluntary contraction (MVC) (Kacin & Strazar, 2011) to 80% 1RM (Laurentino et al., 2008) have been used. However, for increasing muscle size and strength, many studies standardized the relative intensity to 20-40%1RM (Fahs et al., 2012; Scott et al. 2015). (B) Exercise volume: BFR resistance exercise, very often performed with low loads (LIBFR), reduces the total load volume of exercise required to elicit strength and hypertrophy gains. LIBFR exercise to volitional fatigue is commonly described in the literature. Nevertheless, its use should be avoided as it exacerbates delayed onset muscle soreness, which potentially limits training frequency (Fahs et al., 2012). As an alternative, LIBFR training may be prescribed using a protocol of one set of 30 repetitions, followed by three sets of 15 repetitions. This protocol has been shown to be effective in enhancing acute muscle activation and increasing muscular strength as well as hypertrophy without increasing indices of muscle damage (Loenneke et al., 2014; Scott et al., 2015). Despite not replicating the neural demands of HI resistance training, this protocol is highly demanding from a metabolic stand point (Suga, Okita, Takada, Omokawa, Kadoguchi, Yokota, … & Kinugawa, 2012). As importantly, during multiple set exercise, rest between each set should be around 30 to 45 s to ensure sufficient venous pooling (Scott et al., 2015).
22 Acute responses to low intensity training with blood flow restriction
As previously stated, LIBFR resistance exercise is effective for inducing significant acute responses in neuromuscular function. Overall, LIBFR enhances neuromuscular fatigue in response to resistance training and this is expressed by clear changes in torque output and muscle activation (Loenneke et al., 2015b). Muscle fatigue following LIBFR exercise may result from metabolite accumulation (Loenneke et al., 2015b). Torque decrement following
LIBFR is likely the result of a dysfunction in the phosphorylation of myosin regulatory chains, which makes them less sensitive to the calcium released from the sarcoplasmic reticulum, along with a reduced creatine phosphate concentration, increased inorganic phosphate (Pi) and hydrogen ions concentration (Cook et al., 2013). This metabolic milieu, in parallel with reduced oxygen availability (not anoxic) to the exercising muscle, may increase recruitment of high-threshold MU via stimulation of group III and IV afferent fibers (Yasuda, Abe, Brechue, Lida, Takano, Meguro & Nakajima, 2010; Loenneke, Fahs, Wilson & Bemben, 2011a). Wernbom, Jarrebring, Andreasson & Augustsson (2009) also found that an acute session of LIBFR resistance training reduces local muscle endurance.
Cook and coworkers (2013) reported increased muscle activation and significant decrements in torque following LIBFR resistance exercise to volitional fatigue similar to a HI condition (with matched training volume) (~ 30%). Moreover, data from this study also indicates that LIBFR induced fatigue originates from peripheral and not central factors (e.g. possible failures in the excitation-contraction coupling and/or impairments in the contractile properties) (Cook et al., 2013).
Loenneke and coworkers (2015b) found that low relative loads (30% 1RM), and low to moderate restrictive pressures (40-50% AOP), maximize the acute response to BFR exercise. This indicates that, when performed using higher pressures of vascular restriction, LIBFR may
23 actually lose effectiveness for inducing positive neuromuscular adaptations. In addition, these authors also speculated that this specific combination of low-muscle loading with moderate vascular restriction might produce similar gains in muscle size and strength as HI resistance training. Cook, Clark & Ploutz-Snyder (2007) also found that, in a volume-matched condition between HI and LIBFR exercise, LIBFR exercise reduces torque output by ~ 56% (MVC) and that this is paired by an acute rise (nine fold increase) in serum GH levels (Pierce, Clark, Ploutz-Snyder & Kanaley, 2006).
A few authors reported that torque decrement post-LIBFR lasts between a few hours up to 24 h of recovery (Umbel, Hoffman, Dearth, Chleboun, Manini & Clark, 2009; Wernbom, Paulsen, Nilsen, Hisdal & Raastad, 2012; Cook et al., 2013). Fatiguing protocols, such as those including three sets of knee extensions, performed at 35% MVC to failure, are accompanied by significant decrements in MVC (~13%), high values of delayed onset muscle soreness (DOMS) and muscle swelling after 24 h of recovery from a single training session (Umbel et al., 2009). Five sets of muscle contractions, performed at 30% 1RM, also showed prolonged MVC reductions (~ 15%) at four hrs following exercise (Wernbom et al., 2012). The latter study found that, under these circumstances, decreased capacity for force production was paired by a significant depletion of phosphocreatine (PCr) and increases in Pi (an indicator of muscle fatigue). The authors also postulated that low pH might have a partial role in inhibiting the central nervous system due to lactate accumulation and the effect of cuff restriction on the excitability of nerve and/or muscle cells. Furthermore, the presence of tetranectin at these specific time points also indicates increased sarcolemmal permeability and ongoing muscle regeneration. Both these studies provide evidence about the efficacy of this training approach for eliciting increases in acute indicators of muscle fatigue. However, it is important to note that all these experimental designs used fatiguing protocols, designed to induce greater muscle damage (Loenneke, Thiebaud, Fahs, Rossow, Abe & Bemben, 2013b), as well as restrictive
24 pressures based either on arbitrary values (100 and 90 mmHg for men and women, respectively; Wernbom et al., 2012) or the participants systolic BP (130% systolic BP; Umbel et al., 2009).
Although the optimal LIBFR resistance training protocol is not yet firmly established, some studies prescribed a standardized 4-set approach (30 + 15 + 15 + 15 reps) and found significant effects on torque decrement. Yasuda and coworkers (2009) found that MVC decreased by 37% immediately after completing this specific protocol with moderate vascular restriction (i.e. 160 mmHg). However, these authors did not compare their findings with those resulting from HI training. Thiebaud, Yasuda, Loenneke & Abe (2013a) also found a 36% decrease in MVC post-4 sets of training at 30% 1RM, using a restrictive pressure of 120 mmHg. The first study on the acute effects of LIBFR exercise on torque, combining this typical multiple-set LIBFR exercise protocol with an individualized restrictive pressure (60% of predicted AOP based on the individual limb circumference; Loenneke et al., 2013b), also reported acute decreases in torque output. Interestingly, there was a rapid rebound of torque production back to baseline just after 1 h post-exercise. More recently, Dankel, Buckner, Counts, Jessee, Mouser, Mattocks,… & Loenneke (2017a) also reported torque decrements
following a 4-set LIBFR exercise protocol performed at 30% 1RM and using a restrictive pressure of 40% AOP. Despite the relevance of all these findings, it should be noted that, if performed too frequently or incorrectly (e.g. excessive pressure of restriction and/or performing muscle contractions to volitional failure vs. to a predetermined number of repetitions), LIBFR might exert a negative impact on muscle function (prolonged reductions in torque output) and this may well be secondary to end-organ injury (Loenneke et al., 2013b). For all these reasons,
the available research clearly supports the use of the standardized 4-set approach when prescribing LIBFR exercise. Unfortunately, most research designs on the acute responses to LIBFR exercise have not included female participants. It is not known whether women respond to this form of training in a similar fashion as men. Specifically, there are no data comparing
25 acute fatigue between men and women exercising with the standardized 4-set protocol at a given % of AOP. Since there are considerable differences in neuromuscular function between men and women (e.g. relative proportion of type I and type II muscle fibers), sexual dimorphism in the acute response to LIBFR exercise is highly likely. This topic will be further detailed in the following section.
Sexual Dimorphism in response to low intensity training with blood flow restriction
There is almost no research on sexual dimorphism in response to acute or chronic LIBFR exercise (Counts et al., 2016). As both sexes exhibit considerable differences in neuromuscular physiology and exercise performance, exploring whether men and women respond differently to this specific form of exercise is important for optimizing exercise prescription (Hunter, 2014). If sex differences do exist during BFR resistance exercise, it might thus warrant the need to set separate training recommendations for men and women (Labarbera, Murphy, Laroche & Cook, 2013).
Even though men tend to be stronger than women (depending on the muscle groups and tasks), because of their larger muscle mass, they are often more fatigable (Hunter, 2014). Men and women exhibit no differences in muscle voluntary activation and this is corroborated by past research showing no sex differences in specific muscle strength (i.e. force/muscle cross-section area) (Miller et al., 1993). Therefore, differences in fatigability are not secondary to low levels of muscle activation in women. Sex differences in muscle strength also reflect the larger diameter muscle fibers in men for both lower and upper limbs (Miller et al., 1993). Women, on the other hand, tend to have a higher density in skeletal muscle capillarization and greater muscle perfusion than men (for some muscle groups). This implicates an earlier onset of muscle fatigue in men because of a lower oxygen delivery to the muscle tissue and a rapid accumulation of metabolites that interfere with the contractile function (Hunter, 2014). Additionally, blood
26 flow tends to be more restricted in men than women during sustained isometric contractions at a given relative intensity because the larger muscle mass in men tends to exert more pressure onto the feed arteries during exercise (Hunter, Griffith, Schlachter & Kufahl, 2009). Women may also have greater elevations in absolute and relative blood flow during exercise when compared with men (Parker, Smithmyer, Pelberg, Mishkin, Herr & Proctor, 2007). Differences in sympathetic-mediated activity can also influence muscle perfusion and promote sexual dimorphism in fatigability and this is associated with β2 adrenergic receptors mediated
vasodilation. These metabotropic receptors are located with greater density on type I than type II muscle fibers (Parker et al., 2007; Roatta & Farina, 2010). This is important because the lower muscle fatigability in women (i.e. lower decrement in torque output and muscle activity) (Hakkinen, 1993) is thought to be primarily related with their greater proportion of type I muscle fibers (Moritani et al., 1991). Thus, women have smaller muscle mass with greater proportional area of type I muscle fibers (Hunter, 2014). This is secondary to differences in gene expression in interaction with the activity of sex-specific hormones (Roth, Ferrel, Peters, Metter, Hurley & Rogers, 2002; Maher, Fu, Isfort, Varbanov, Qu & Tarnopolsky, 2009; Cit in Hunter, 2014).
The contractile properties of muscle fibers may also explain lower levels of muscle fatigue in women vs. men. Specifically, women have slower contractile properties and lower peak rates of relaxation at a 30 Hz tetanus (Wust, Morse, Haan, Jones & Degen, 2008). Moreover, muscle metabolism also differs between men and women, with men showing greater rate of glycolysis and women a greater rate of lipolysis (Russ, Lanza, Rothman & Kent-Braun, 2005). This corroborates the concept that women are less fatigable and have a faster recovery of muscle fatigue than men (Hunter, 2014). Interestingly, during isometric fatiguing contractions, Keller, Pruse, Yoon, Schlinder-Delap, Harkins & Hunter (2011) showed that the phase of the menstrual cycle does not affect torque output and muscle fatigability. Isometric
27 exercise represents a physiological inductor of vascular restriction. Thus, fluctuations in female hormone during the menstrual cycle are not likely to underlie differences in muscle fatigability between sexes.
To our knowledge, there is only one study comparing the acute neuromuscular responses to LIBFR training between men and women (Labarbera, et al., 2013). The authors explored between-sex differences in response to three sets of BFR knee extensions to volitional fatigue at 20% peak torque. LIBFR training was more effective than LI non-BFR in decreasing torque output (39% vs. 35%) and enhancing muscle EMG activity and this occurred similarly between men and women. However, women were able to perform more repetitions regardless of the condition (LIBFR vs. LI non-BFR), thus demonstrating greater muscular endurance. The existent literature on the chronic impact of LIBFR exercise in women is very scarce. Sakamaki, Yasuda & Abe (2012) studied the interaction between menstrual cycle and LIBFR adaptations in women. The authors found that muscle hypertrophy is greater post-upper-limb LIBFR training (5-7% CSA) during the luteal than follicular phase of the menstrual cycle. Interestingly, the authors reported no between-sex differences in the magnitude of improvement in muscle volume and MVC. Thiebaud, Loenneke, Fahs, Rossow, Kim, Abe, ... & Bemben (2013b) also reported increases in muscle thickness and strength in post-menopausal woman following LIBFR exercise and this was similar to that reported after moderate-to-high intensity training. Similarly, Segal, Williams, Davis, Wallace & Mikesky (2015) found significant improvements in 1RM and muscle size of women with symptomatic knee osteoarthritis involved following a LIBFR training regimen. Finally, it was recently shown that, in response to LIBFR training, women exhibit a shift in muscle fiber type composition (from isoform IIx – fast glycolytic fibers to IIa – fast oxidative fibers) and this is similar to that seen after HI training (Ellefsen, Hammarstrom, Strand, Zacharoff, Whist, Rauk & Cumming, 2015).
28 Blood flow and muscle perfusion both follow a sexually dimorphic pattern. This is relevant because sex differences in muscle fatigability may be partially explained by different blood flow characteristics in response to a given level of BFR (Hunter, 2014). When compared to men, women have heightened muscle perfusion and capillarization (Hunter, 2014). They also achieve greater muscle blood flow (relative and absolute values) during exercise (Parker et al., 2007) and exhibit more sensitivity to vascular changes (vasoconstriction and vasodilation) in response to arterial occlusion (Levenson, Pessana, Gariepy, Armentano & Simon, 2001). Thus, their magnitude of muscle fatigue following 4 sets of LIBFR resistance exercise (30 + 15 + 15 + 15 repetitions), performed at a given level of relative BFR, is likely different from that seen in men. Dankel, Mouser, Jessee, Mattocks, Buckner & Loenneke (2017b) demonstrated that relative blood flow, as well as brachial artery diameter, is similar between sexes post-1 and 4 min of recovery from LIBFR training. Conversely, in their study, Hunt et al. (2016) found that, when compared to men, women achieve 60% AOP at lower external cuff pressures for the popliteal artery, but not for the brachial artery.
Past studies aimed at identifying predictors of AOP (Loenneke et al. 2015a, Hunt et al., 2016). One of these studies accounted for factors such as systolic and diastolic BP, limb size, muscle CSA and adipose thickness (AT). Data analysis indicate that limb circumference and systolic BP explained most of AOP variance (~ 60%; Loenneke et al., 2015a). The other study accounted for the same variables and also for MAP and BMI. It was found that AOP prediction was improved when controlling for the impact of systolic BP, BMI and AT (Hunt et al., 2016). It is not known whether the relationship between AOP and its predictors varies as a function of sex. Given that women are substantially different from men from a physiological standpoint (e.g. skeletal muscle composition, blood flow response to exercise, body composition), we believe that sex may also be predictive of AOP.
29 Limitations and potential safety issues regarding BFR resistance exercise
While BFR resistance exercise seems to benefit skeletal muscle adaptations, it is important to recognize possible limitations and contraindications associated to this training method. The current limitations related to the application of LIBFR training are primarily related to BFR pressure per se. It is recommended and vastly accepted that the tourniquet cuff should be applied in the most proximal portion of the training limb (Fahs et al., 2012). This, however, has been shown to induce an unbalanced hypertrophy at the level of the quadriceps
femoris muscle (less hypertrophy at the most proximal vs. distal portions of the muscle) (Kacin
& Strazar, 2011; Ellefsen et al., 2015).
During acute LIBFR training sessions, the occlusive stimulus might also disturb the post-exercise hypotension (resulting from peripheral vasodilation) that typically follows resistance exercise. This is secondary to the negative impact of acute BFR exercise on the capacity of the endothelium for nitric oxide release (Rossow, Fahs, Loenneke, Thiebaud, Sherk, Abe & Bemben, 2012). As importantly, there is preliminary evidence that stiffness of both the tendon-aponeurosis complex and patellar tendon do not adapt to LIBFR training (Kubo, Komuro, Ishiguro, Tsunoda, Sato, Ishii & Fukunaga, 2006). This is relevant because the level of connective tissue adaptation with LIBFR training lags behind muscle hypertrophy and this might increase the individual susceptibility for tendon injuries.
As for potential safety issues that may limit the practice of BFR exercise itself, some researchers report a few side effects, such as subcutaneous hemorrhage and numbness (13.1 and 1.3% incidence, respectively) (Nakajima, Kurano, Lida, Takano, Oonuma, Morita, … & Nagata, 2006), and exertional rhabdomyolysis in untrained individuals (Iversen & Røstad, 2010; Clark & Manini, 2017). However, all these intercurrences tend to occur at the beginning of a BFR training program in individuals unaccustomed to this type of training (Nakajima,
30 Morita & Sato, 2011). As a result of these possible side effects, Nakajima et al (2011) defined a set of absolute contraindications to BFR exercise such as the presence of: (1) history of deep-vein thrombosis, (2) pregnancy, (3) varicose deep-veins and several other factors related to clinical history and inactivity. Loenneke, Wilson, Wilson, Pujol & Bemben (2011b) summarize the potential risk for complications (cardiovascular events, oxidative stress, muscle and nerve damage) and identify excessive cuff pressure and width as the most common causes of complications during BFR exercise.
Despite implicating some minor health-related risks, LIBFR exercise is characterized by low training volume and low relative loads (comparing with HI protocols). For this reason, it causes minimal muscle damage and it is not accompanied by prolonged decrements in muscle function, tissue swelling or delayed onset muscle soreness (Loenneke et al., 2013b; Loenneke
et al., 2014). Thus, when used in a well-controlled environment, by trained and experienced
personnel, BFR exercise provides a safe and effective training alternative for most individuals, regardless of age and training status (Loenneke et al., 2011b).
31 III. Purpose and goals
This study aimed at exploring whether, for the upper-limb, the relationship of absolute occlusion pressure (AOP) with arm circumference and resting blood pressure (BP) differs between men and women. This is relevant because, during LIBFR exercise, cuff pressure is typically normalized to AOP values. We also sought to determine if fatigue following two different upper limb resistance-training protocols (non-BFR high intensity – HI resistance training vs. LIBFR exercise) follows a sexually dimorphic pattern. It was hypothesized that arm circumference and systolic BP would interact differently with both sexes for predicting AOP. Additionally, we hypothesized that LIBFR upper limb exercise would be as fatiguing as HI resistance training in both men and women. Finally, since women tend to have a greater proportion of type I muscle fibers than men (Moritani et al., 1991), we also hypothesized that they would respond to an acute session of LIBFR exercise with lower levels of fatigue (less decrement in peak torque) when compared to men.
32 IV. Methods
Participants
A total of 62 healthy young and moderately active participants (31 men, 21.7 ± 2.3 yrs and 31 women, 22.0 ± 2.0 yrs) and accustomed to resistance training were included in this study. Participants were recruited from the local community and from the Faculty surroundings via word-of-mouth and using social networks. Participation involved two testing sessions of approximately 60 min. The risks involved in the experimental design were carefully explained to each participant and informed consent was obtained from all participants prior to study entry. The study complied with the principles set forth in the Declaration of Helsinki and was approved by the Faculty´s Ethics Committee (CEFMH Nº 4/2017).
All participants were non-obese, normotensive (systolic/diastolic BP repeatedly below 135/85 mmHg, respectively; Pickering, Hall, Appel, Falkner, Graves, Hill, … & Roccella, 2005) and free from any known cardiovascular, metabolic, respiratory and/or orthopedic diseases, assessed by a health-screening questionnaire and through baseline measurements. Exclusion criteria also included other concerns that could limit exercise performance (i.e. smoking habits and sedentary behavior). At baseline, each participant was required to complete a questionnaire for determining the degree of handedness (Waterloo handedness questionnaire
–revised; Elias, Bryden & Bulman-Fleming, 1998). Participants were all tested with the
dominant upper limb. Finally, participants were asked to maintain the same diet and to avoid intense physical exercise for at least 24 h before testing.
Study Design
During the first visit to the laboratory, all testing procedures were carefully explained to each participant and informed consent was obtained. Participants were also screened for
pre-33 existent medical conditions and then completed the degree of handedness questionnaire. The study involved two testing sessions and can be subdivided in two distinctive experimental designs: (1) one for exploring the relationship between AOP and its predictors in both men and women; (2) the other for comparing the magnitude of fatigue resulting from LIBFR vs. HI resistance training in both men and women (Fig. 1). Despite relying on a common framework (group of participants and testing sessions study), these experimental designs were substantially different and, for this reason, will be described separately.
All testing sessions were scheduled for the morning period (between 8:00 and 12:00 h) to warrant similar conditions between participants and visits. All participants were requested to wear an athletic outfit. Data were obtained for an overall period of ~ 7 months (October 2016 – May 2017).
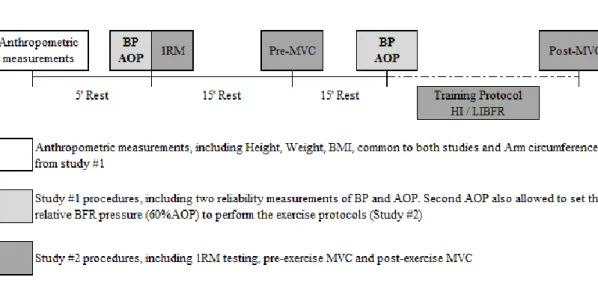
Figure 1. Schematic representation of both studies: study #1 and #2. Anthropometric measurements were common
to both studies, completed only on the first session and included height, weight, BMI and arm circumference (only for study #1); Study #1 included blood pressure (BP) and AOP measurements taken twice for reliability purposes. Study #2 included two exercise protocols performed on a randomized fashion: HI and LIBFR resistance exercise protocols; Maximum voluntary contractions (MVC) were taken before and after training. 1RM testing was measured before pre-training MVC. HI was performed at 75% 1RM and LIBFR at 20% 1RM. Participants remained in a sitting position throughout the entire testing sessions.
34 Baseline measurements were taken at the first visit to the laboratory and included body mass to the nearest 0.01 kg (TANITA® BF-350 body composition analyzer, Arlington Heights, IL) and height to the nearest 0.5 cm. Body mass index was then calculated as the ratio of body mass in kg to the square of the participants’ height in meters. Resting BP was also obtained after completing the anthropometric measurements.
Study #1 – AOP prediction
AOP determination and prediction
Study #1 involved the direct resting measurements of AOP, arm circumference and BP in the seated position [past research indicates that all these variables are predictive of AOP (Loenneke et al., 2015a)]. These measurements were taken exclusively on the LIBFR testing session. Arm circumference was determined at 50% of the dominant arm length. Arm length was previously measured, taking the dominant arm humerus as anatomical reference. The upper extremity of the humerus was then located through palpation of the acromion and following from the lateral lip to the greater tuberosity, inferior to the acromion’s internal edge, further marked with ink. Another mark was made at the lateral epicondyle of the humerus following the humerus length, with the arm at 90º of elbow flexion. Arm length was measured using a tape measure and was considered as the distance (cm) from the greater tuberculum of the humerus (tuberculum majus humeri) to the lateral epicondyle of the humerus (Epicondylus
lateralis humeri; Huri, Biçer, Mirioğlu, Öztürk, Deveci & Tan, 2014). Then, the arm
circumference was measured as the horizontal circumference taken at 50% of the determined arm length (arm relaxed and extended close to the trunk) (Buckner, Dankel, Counts, Jessee, Mouser, Mattocks,… & Loenneke, 2017). Minimum possible pressure was exerted with the tape measure.
35 BP was determined using an automatic BP monitor, in duplicate (Tango SunTech Medical Morrisville, NC). Measurements were taken on the non-dominant arm, with the participants in the seated position after 5 min of rest at baseline and then immediately before the training intervention, from study #2. (1st and 2nd BP measurement, respectively). The first measurement was used for exclusion of participants with abnormal resting BP and the second to examine the stability and reliability of BP as a function of time (before using it as a predictor of AOP).
Determination of AOP
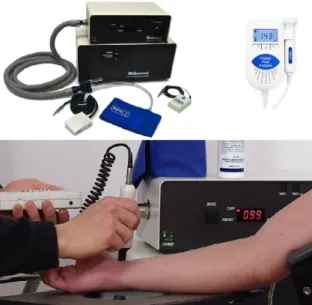
All blood flow measurements were taken at rest in the chair-seated position to better correspond to the blood flow dynamics during exercise (Loenneke et al., 2015a). Arterial blood flow was detected using a vascular Doppler probe (8 MHz Pocket Fetal Doppler, ULTPD1CV8) placed over the radial artery, at the wrist level. Pulse was detected via auditory and visual signs obtained from the Doppler probe. A narrow 6 x 83 cm pneumatic cuff (SC5 Tourniquet cuffTM, D.E. Hokanson®, Inc., Bellevue, WA) was placed on the most proximal end of the dominant arm and inflated using a rapid inflation device (E20 Rapid Cuff Inflator, D.E. Hokanson®, Inc. Bellevue, WA). The cuff was initially inflated to 50% of the individual resting systolic BP and then raised up to the point when radial pulse was interrupted (Laurentino et al., 2008). AOP was recorded as the nearest 1 mmHg pressure at which pulse was not present. Finally, for exploring the stability of AOP over time, Doppler measurements were taken twice on the dominant arm (immediately after completing the 1st and 2nd BP measurements) (Fig. 2).
36
Figure 2. Graphic representation of absolute occlusion pressure determination (down) and instrumentation,
including the rapid inflator cuff left; D.E. Hokanson®, Inc. Bellevue, WA) and the Doppler probe (upper-right; 8 MHz Pocket Fetal Doppler, ULTPD1CV8).
Study #2 – Torque decrement following HI vs. LIBFR training
We used a randomized, crossover study design. Each participant underwent the study protocol twice on separate days within a 1-wk period under the following two conditions: non-BFR HI vs. LInon-BFR biceps curl contractions (Table 1).
Table 1. Exercise protocols
Set 1 Set 2 Set 3 Set 4 Pause
HI
(75%1RM) 10 10 10 10 Reps 60’’
LIBFR
(20%1RM, 60%BFR) 30 15 15 15 Reps 30’’
Abbreviations: HI, high intensity; LIBFR, low intensity blood flow restricted; 1RM, 1-repetition maximum; BFR, blood flow restriction; Reps, 1-repetitions.
During the first visit, each participant was tested for maximum dynamic muscle strength (one repetition maximum – 1RM). 1RM values were subsequently used to normalize the
37 exercise intensity prescribed in each training condition on an individual basis. Maximum voluntary contraction (MVC) was determined for the dominant elbow flexors at pre- and post-training time points. Pre-post-training MVC was taken after 15 min of rest post-1RM measurement (recovery from fatigue). According to past research, 15 min of rest allow a full recovery of muscular [PCr] (McCann, Mole & Caton, 1995), which is the primary substrate for ATP synthesis during MVC testing (Robergs & Roberts, 1997). Both protocols of resistance training (HI and LIBFR resistance training) involved unilateral dumbbell elbow flexions while each participant remained seated on the chair of an isokinetic dynamometer. Resistance training was initiated after 15 min of rest post-MVC (pre-training MVC). Arm support for elbow flexion exercise was ensured for all participants throughout the entire testing sessions. MVC was measured once again immediately after the last set of exercise training in each condition. This was done to quantify the decrements in torque resulting from the acute exposure to each training protocol (∆ torque from pre- to post-training time point).
1-Repetition maximum
1RM testing preceded pre-exercise MVC and acute resistance training on the first visit to the laboratory. The individual 1RM values were then used to determine the load compatible with the relative intensity prescribed for HI and LIBFR (75% and 20% 1RM, respectively). 1RM was determined for the dominant upper-limb during elbow flexion exercise using dumbbells (the same free weights used during acute resistance training). Testing procedures followed the recommendations advanced by Brown and Weir (2001). Briefly, the protocol was initiated with 8-10 repetitions performed at a load of ~ 50% of estimated 1RM (subjective measure). Then, the load was adjusted to 75% of the estimated 1RM and each participant was instructed to complete 5 repetitions. These two initial sets of muscle contractions served as specific warm-up. Subsequently, the load was adjusted as necessary and each participant performed the maximum number of repetitions until volitional failure (with verbal
38 encouragement). The load was increased by 5% whenever participants complete more than 5 repetitions before failure. 3 min of rest were allowed between the first three trials. Further trials required 5 min of rest to ensure full recovery. A repetition was considered valid if the participants lifted the dumbbell through the entire range of motion (ROM). 1RM was accepted as the maximum load that each participant could mobilize in a single maximum dynamic elbow flexion or estimated by Epley’s formula (1) whenever each participant performed 1-5 repetitions (Le Suer et al., 1997 cit in Martín-Hernández, Marin, Menendez, Ferrero, Loenneke & Herrero, 2013).
(1)1RM = Load (kg) x (1 + (0.033 x nº of repetitions))
Maximal voluntary contraction:
Maximal voluntary contractions (MVC) were performed twice in each training session (pre-HI and LIBFR; post-HI and LIBFR) to quantify the levels of fatigue resulting from both training protocols and to further explore possible interactions with sex. MVC was tested on a Biodex isokinetic dynamometer (Biodex Medical Systems, System 3, Shirley, NY) using the isometric mode for elbow flexion exercise. A specific warm up was done before testing. Specifically, each participant performed 10-12 repetitions through full ROM using the dynamometer isokinetic mode. Participants were tested in the seated position securely fixed with chest and waist straps and exercise was performed at 60º of elbow flexion using the isometric mode. They were instructed to exert their maximum force as fast as possible through the full duration of each trial. Verbal encouragement and audible feedback from the dynamometer software were provided to each participant. MVC was recorded as peak torque (N.m) obtained in 3 isometric contractions trials lasting 5 s each. One minute of recovery was allowed between trials. The percentage difference between peak torque obtained in the pre- and post-exercise MVC (%MVC) was taken as an index of fatigue and further used for data analysis.
39 For both HI and LIBFR conditions, post-training MVCs were always taken within 30 s of the final repetition of the last set of resistance training.
Acute resistance training
Training load was computed as a function of 1RM obtained for each participant and set at 75 and 20% 1RM for the HI and LIBFR training protocols, respectively. For the LIBFR training protocol, BFR pressure was adjusted to 60% AOP. This relative pressure has shown to maximize acute muscle fatigue in response to BFR exercise (Loenneke et al., 2015b). HI training consisted of a conventional hypertrophic resistance exercise, in which participants performed 4 sets of 10 repetitions at 75% 1RM (2 s CON; 2 s ECC) with 60 s of passive rest between. This protocol follows the latest guidelines set forth by the American College of Sport Medicine for progression models in resistance training for healthy adults (ACSM position stand; Ratamess, Alvar, Evetoch, Housh, Kibler & Kraemer, 2009). LIBFR training consisted of 4 sets of 30+15+15+15 repetitions performed at 20%1RM (1s CON; 1s ECC) with 60% BFR pressure. Recovery between sets was prescribed for 30 s of passive rest. BFR was achieved by inflating a nylon cuff (similar to that described for AOP) within the most proximal portion of the arm. This specific training protocol has proven effective for inducing muscle hypertrophy with a moderate vascular restriction (Loenneke & Pujol, 2009) and has been used consistently in studies examining the physiological responses to BFR resistance training (e.g. Loenneke et
al., 2013b; Yasuda et al., 2009, 2010). In addition, at pre-training time point, the cuff was inflated to 3 progressive accommodative pressures (25, 50 and 75% of the individual cuff pressure corresponding to 60% AOP) during 30 s with 10 s of rest between them. Afterwards, cuff pressure was set to the 60% AOP pressure throughout the entire LIBFR training session (~ 4min of continuous BFR, including exercise and rest periods). A metronome was used during exercise to ensure that participants held the prescribed cadence of contraction in both exercise conditions. Verbal encouragement was provided during exercise for motivational purposes.
40 Finally, for LIBFR protocol, cuff pressure was released after the training protocol immediately before the post-training MVC.
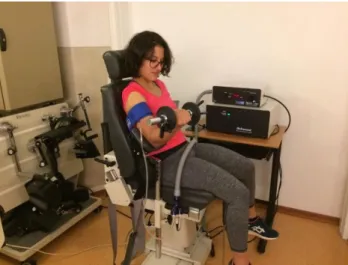
Figure 3. Graphic representation of LIBFR exercise and instrumentation. Rapid inflator cuff was applied at the
most proximal part of the dominant arm. Exercise was performed in a multiple-set fashion (30 + 15 +15 +15 reps with 30s rest) with free-weights at 20% of 1RM and 60%BFR. Cuff pressure was kept during the full protocol (i.e. including sets and rest) and released immediately before post-exercise MVC. Exercise was performed in the isokinetic dynamometer chair with arm support for elbow flexion.
Statistical Analysis
Since each group of participants had more than 30 persons (31 men and 31 women), data were assumed to be normally distributed. Data were tested for homoscedasticity through Levene´s tests. Between-sex comparisons were computed for anthropometric and baseline cardiovascular data, as well as for 1RM and AOP measurements, using independent t-tests.
Study #1 – AOP prediction
The stability and reliability of resting hemodynamics and AOP (in both sexes) between days was explored using paired-sample t-tests, intraclass correlation coefficients (ICC) and coefficients of variation (CV). Multiple linear regression analysis was computed to determine whether sex, systolic BP and arm circumference (independent variables) were significant
41 predictors of AOP (dependent variable). All independent variables were forced entered into the regression equation in one simple block (enter method). Removal values for the regression analysis were performed at p > 0.05. Coefficient of determination (R2) was used to determine the percent of variance explained by each regression model. Variance inflation factors (VIF) were used to assess multicollinearity (i.e. multicollinearity criteria set for VIF ≥ 10).
A leave-one-participant-out approach was conducted to further validate the regression model for AOP prediction (Staudenmayer, Zhu & Catellier, 2012). A regression model was obtained on the data from all participants excluding one. This was successively done for all participants. Then, the resulting regression equation was used to predict the AOP of the previously excluded participant, obtaining the estimated AOP on a participant-by-participant basis (2). Absolute percent error for the left-out participant was also calculated as:
(2) [(actual AOP – estimated AOP) x 100/actual AOP].
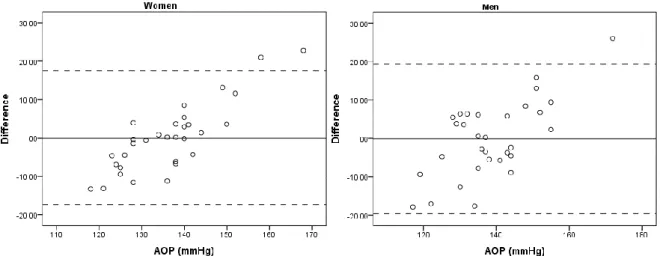
Independent-samples t-tests were used to evaluate the difference in absolute percent error between men and women. The agreement between actual and estimated AOP for the left-out participants was analyzed with Bland-Altman plots (Bland & Altman, 1999). Bland-Altman plots R2 were also determined for men and women to test for heteroscedasticity (i.e.
heteroscedasticity criteria set for R2 >0.1; Nevill & Atkinson, 1997). Finally, paired t-tests were used to explore the differences between actual and estimated AOP values within sexes.
Study #2 – Torque decrement following HI vs. LIBFR training
The impact of each training protocol on torque decrement between sexes was determined using a three-way repeated measures ANOVA [(condition: LIBFR vs. HI) x (time: pre- vs. post-training) x (sex: men vs. women)]. The percentage difference in MVC values obtained at pre- and post-training time points was calculated in both conditions to compare the magnitude of torque decrement between sexes after each training protocol. Since the levels of
42 fatigue resulting from different protocols of resistance training vary as a function of volume load (i.e. nº sets x nº repetitions x load lifted) (Loenneke et al., 2011), we also explored whether volume load was similar between LIBFR and HI protocols (using independent t-tests). Additionally, a repeated measures ANCOVA was computed to compare torque decrements between sexes in each condition (LIBFR vs. HI), while controlling for a new variable defined as the percentage difference in volume load between protocols (% volume-load difference between LIBFR and HI). Between-day variability in pre-training MVC (day 1 vs. day 2) was determined separately, in men and women, using paired-samples t tests. Finally, test-retest reliability of pre-training MVC was explored in both sexes using ICC and CV analyses. Based on the 95% confidence interval of the ICC estimate, values less than 0.5, between 0.5 and 0.75, between 0.75 and 0.9, and greater than 0.90 were considered as poor, moderate, good, or
excellent reliability, respectively (Koo & Li, 2016). All statistical analysis were computed using
the Statistical Software Package for Social Sciences (SPSS 24.0, SPSS Inc., Chicago, IL) and significance was set at p < 0.05. All data are reported as mean ± standard deviation (SD).
43 V. Results
Baseline measurements
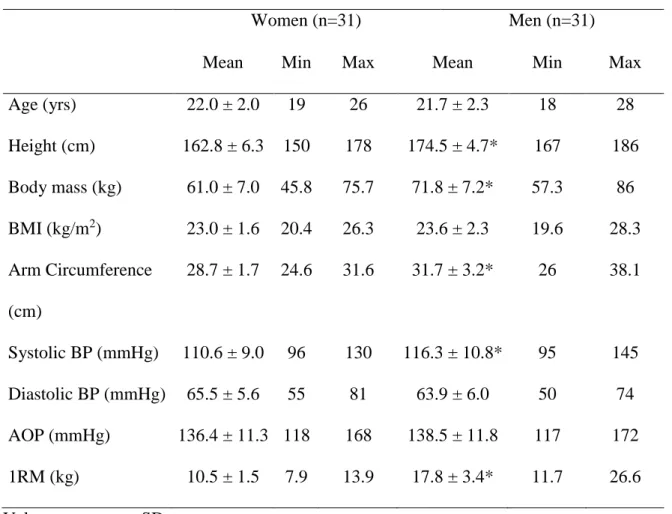
Anthropometric and cardiovascular characteristics of the participants at baseline are presented in table 2. Both groups were of similar age and, despite being taller and heavier, men had similar BMI as women. Men also had higher systolic BP and arm circumference than women. While there were no sex differences in AOP, we found that men exhibited higher values of 1RM than women (Table 2).
Table 2. Characteristics of participants
Women (n=31) Men (n=31)
Mean Min Max Mean Min Max
Age (yrs) 22.0 ± 2.0 19 26 21.7 ± 2.3 18 28 Height (cm) 162.8 ± 6.3 150 178 174.5 ± 4.7* 167 186 Body mass (kg) 61.0 ± 7.0 45.8 75.7 71.8 ± 7.2* 57.3 86 BMI (kg/m2) 23.0 ± 1.6 20.4 26.3 23.6 ± 2.3 19.6 28.3 Arm Circumference (cm) 28.7 ± 1.7 24.6 31.6 31.7 ± 3.2* 26 38.1 Systolic BP (mmHg) 110.6 ± 9.0 96 130 116.3 ± 10.8* 95 145 Diastolic BP (mmHg) 65.5 ± 5.6 55 81 63.9 ± 6.0 50 74 AOP (mmHg) 136.4 ± 11.3 118 168 138.5 ± 11.8 117 172 1RM (kg) 10.5 ± 1.5 7.9 13.9 17.8 ± 3.4* 11.7 26.6
Values are mean ± SD
Abbreviations: BMI, body mass index; BP, blood pressure; AOP, absolute occlusion pressure; 1RM, 1-repetition maximum. * p < 0.05, significant differences between sexes.
44 Study #1 – AOP prediction
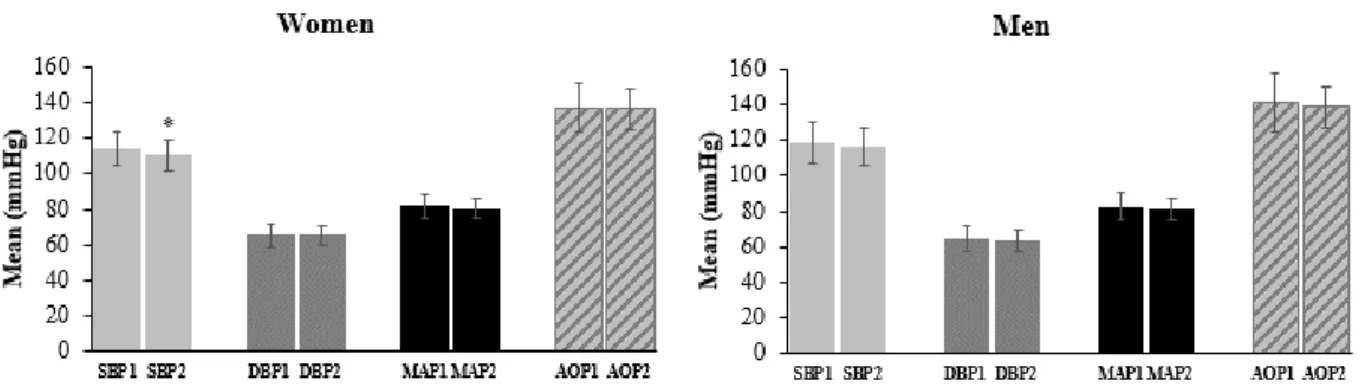
Figure 4 shows the measurements of hemodynamic variables and AOP obtained in men and women at two different time points. Table 3 shows the reliability of these measurements. There were no significant differences between any of these measurements taken at day 1 and 2, except for systolic BP in females (p < 0.05). Men and women had similar AOP and hemodynamic status (p > 0.05), except for systolic BP, which was higher in men (p < 0.05).
Figure 4. Schematic representation of the hemodynamic variables and absolute occlusion pressure (AOP) framed
in study #1, including systolic BP, diastolic BP, mean arterial pressure (MAP) and AOP, obtained in men and women at two different time points. *p<0.05, significant difference between measures
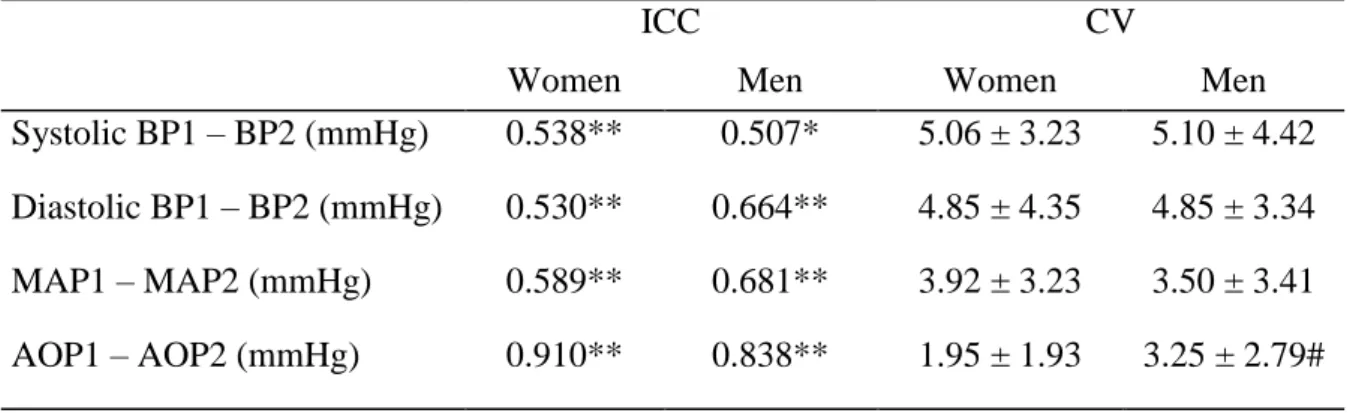
45 Table 3. Reliability analysis of resting hemodynamics and absolute occlusion pressure
(AOP) values in men and women
ICC CV
Women Men Women Men
Systolic BP1 – BP2 (mmHg) 0.538** 0.507* 5.06 ± 3.23 5.10 ± 4.42 Diastolic BP1 – BP2 (mmHg) 0.530** 0.664** 4.85 ± 4.35 4.85 ± 3.34 MAP1 – MAP2 (mmHg) 0.589** 0.681** 3.92 ± 3.23 3.50 ± 3.41 AOP1 – AOP2 (mmHg) 0.910** 0.838** 1.95 ± 1.93 3.25 ± 2.79# Values are mean ± SD
Abbreviations: ICC, intraclass correlation coefficient; CV, coefficient of variation; BP, blood pressure; MAP, mean arterial pressure; AOP, absolute occlusion pressure. *p<0.01; **p<0.001; #p<0.05, significant differences between sexes.
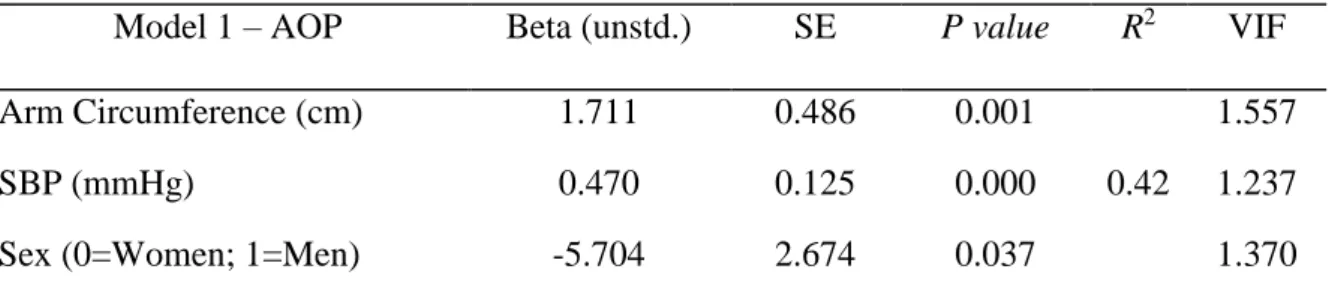
Table 4 shows the regression model for AOP prediction. We found that arm circumference, systolic BP and sex were all significant predictors of AOP (p < 0.05), explaining 42% of variance in AOP (F = 13.9; p < 0.001). None of the tested variables met the criteria for collinearity (VIF was < 10 in all of them). The prediction equation of AOP for women was: AOP = 35.278 + (1.711 x arm circumference [cm]) + (0.47 x systolic BP [mmHg]). For men, the prediction equation was AOP = 35.278 + (1.711 x arm circumference [cm]) + (0.47 x systolic BP [mmHg]) – 5.704.